How to Use Power Query in Excel to Automate Recurring Reports
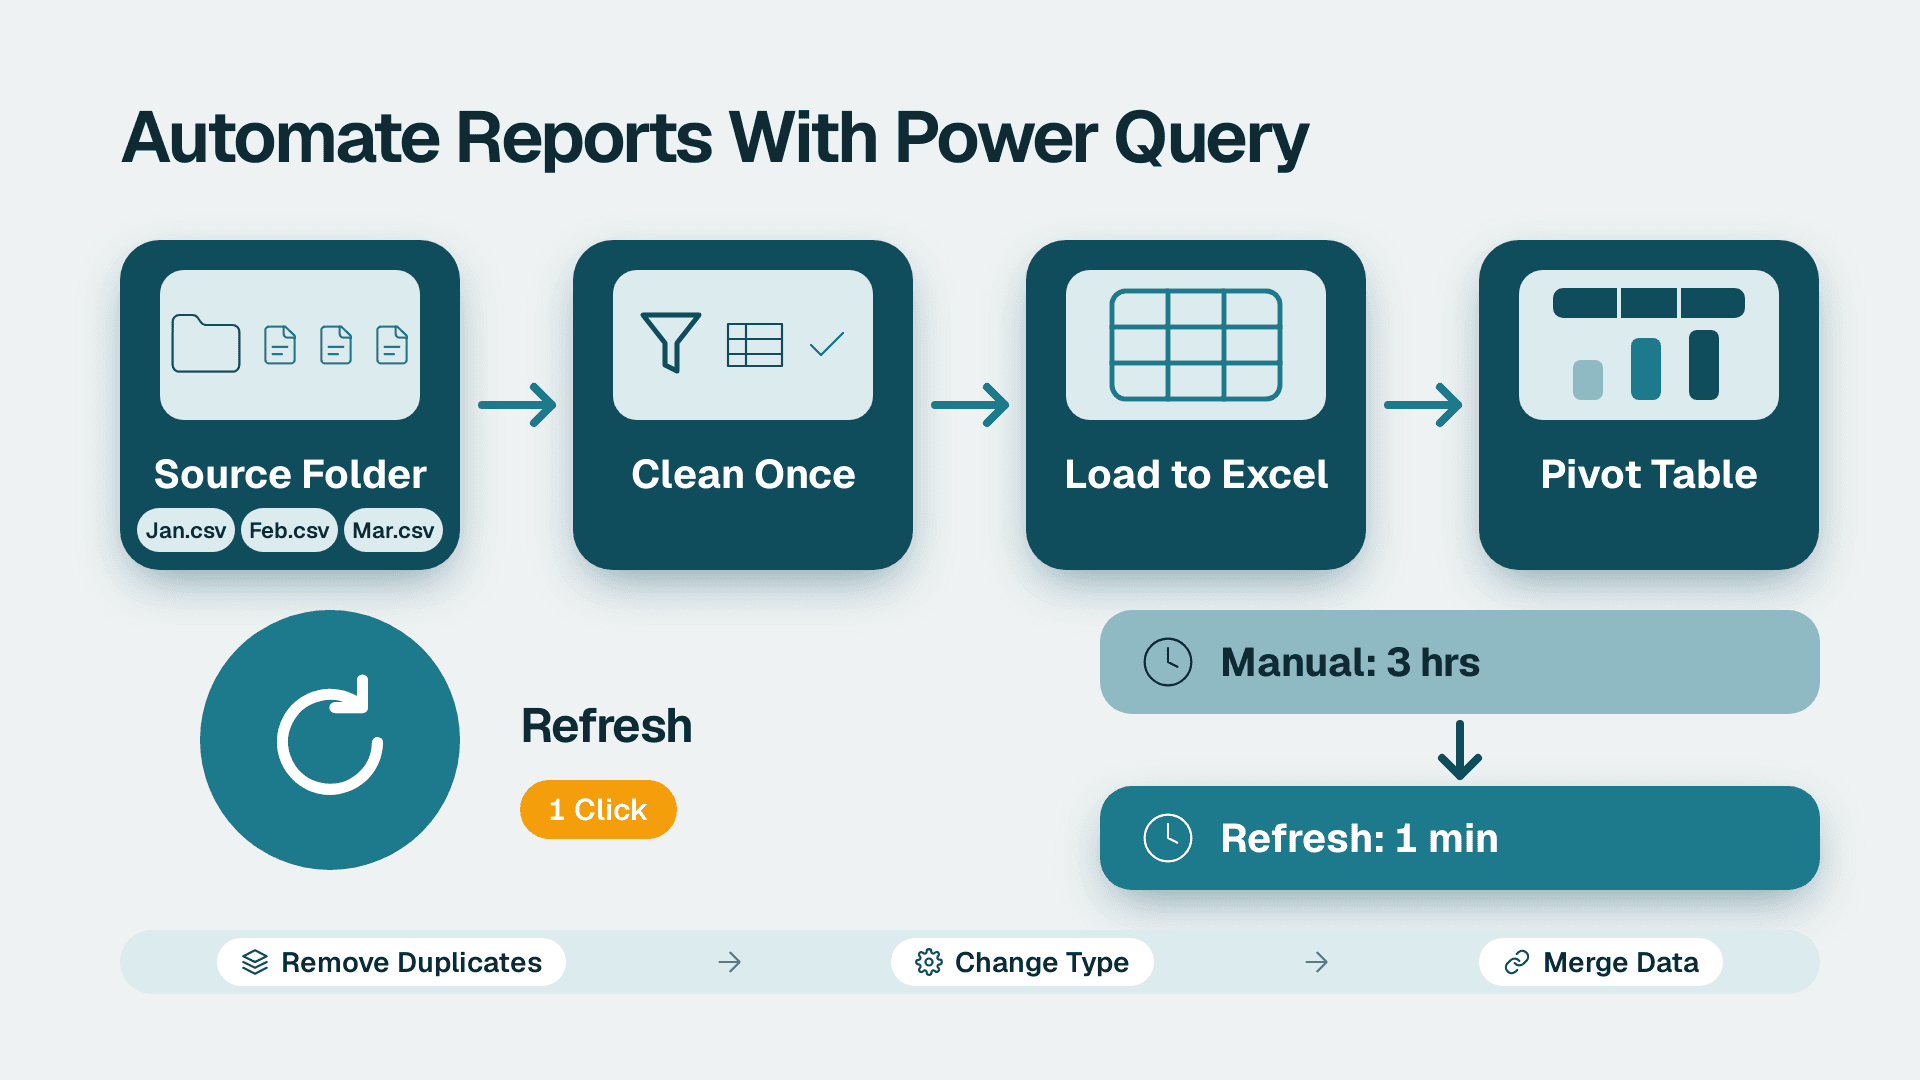
You can automate a recurring Excel report with Power Query in about two to three hours: connect to the folder your exports land in, clean the data once, load it to a pivot table, and from then on refresh with one click. This guide also shows the signs that mean it's time to move the same queries into Power BI.
Key Takeaways
- Power Query records every cleanup action as a repeatable step, so a monthly report becomes a refresh instead of a rebuild.
- The From Folder connector lets you drop a new export into a folder and have it picked up automatically.
- Power Query beats macros for data preparation because the steps are visible and editable without writing code.
- Row counts, refresh times, shared access and audit needs tell you when Excel is no longer the right home for the report.
- Your queries are not wasted when you move to Power BI, because the same M code carries across.
What You'll Need
Before you start, confirm the following. Most failed attempts trace back to one of these.
- Excel for Windows, Excel for Mac or Excel for the Web. Power Query is available in all three, and in Excel it appears as Get & Transform. This walkthrough uses the Windows desktop app, where the menus are most complete.
- A recent Excel build for Windows. Power Query on Windows relies on .NET framework 4.7.2 or later and on the Microsoft Edge WebView2 run-time. If the editor will not open, check those two first.
- Read access to the source files. A shared drive, SharePoint library or OneDrive folder works. You need permission to open the files, not to change them.
- Three or more past exports of the same report. Real files with real mess in them let you test the steps properly.
- About two to three hours. The first build takes that long. Every later refresh takes seconds.
If you are deciding whether Excel is the right tool at all, Power BI consulting can scope that decision with you, and Step 7 below gives you a self-check you can run first.
What Is Power Query in Excel, and How Does It Work?
Power Query is the data connection and preparation engine inside Excel. Microsoft's own documentation, the Power Query for Excel reference, calls it Get & Transform. It works in four phases: Connect, Transform, Combine and Load.
The important idea is that each transformation is recorded as a step. You can see the steps in the APPLIED STEPS list in the Query Settings pane, click any one to inspect it, and edit or delete it. When new data arrives, Excel replays the same steps. That is the whole automation.
If you want the cleaning side in more depth, our guide on using Power Query to clean data before modeling in Power BI goes further on the transformations themselves.
Step 1: Put the Source Files in One Folder
The most reliable pattern for a recurring report is a single folder that holds every period's export.
1. Create a folder such as Monthly Sales Exports on a shared drive, SharePoint library or OneDrive.
2. Save each export with a consistent name, for example sales-2026-09.csv, sales-2026-10.csv.
3. Open each file once and confirm the columns are in the same order with the same header names. If one month says Customer and the next says Client, fix that in the source or plan to handle it in Step 4.
4. Remove any files that are not part of the report. The connector in the next step reads everything in the folder.
You should now see a clean list of files with matching names and no stray documents.
Step 2: How Do I Set Up a Power Query in Excel?
This is the step most people search for first.
1. Open a new, blank Excel workbook and save it as Monthly Sales Report.xlsx in a different folder from your exports.
2. Select the Data tab on the ribbon.
3. Click Get Data, then From File, then From Folder.
4. Browse to your Monthly Sales Exports folder and click Open.
5. In the preview window you will see one row per file, with columns such as Name, Extension and Date modified.
6. Click Combine, then Combine & Transform Data.
7. In the dialog that appears, pick the first file as the sample, confirm the delimiter and file origin look right, and click OK.
On newer builds, the modern Get Data dialog was introduced in Excel version 2510 for Windows and is reached the same way, through Data then Get Data. Labels can differ slightly, but the folder connector works the same way.
What you should see: the Power Query Editor opens in a new window, showing the combined rows from all files. On the left, the Queries pane lists your main query plus helper queries such as Transform Sample File. On the right, Query Settings shows APPLIED STEPS.
If the editor does not open on its own, you can launch it from the Get Data command in the Get & Transform Data group by choosing Launch Query Editor.
Step 3: How Do I Clean the Data With Power Query?
Now record the cleanup once. Work from the top of the ribbon in the editor.
1. On the Home tab, click Use First Row as Headers if the headers are still showing as data.
2. Select each column and set its type from Transform then Data Type. Use Date for dates, Decimal Number for amounts and Text for IDs such as invoice or account numbers.
3. Click Home then Remove Rows then Remove Blank Rows to drop empty lines.
4. Select columns you do not need, right-click one of the headers, and choose Remove Columns.
5. Use Transform then Replace Values to standardize entries, for example replacing N/A with nothing.
6. Use Add Column then Custom Column for calculations. For example, name the column Net Amount and enter:
`= [Gross Amount] - [Discount]`
After each action, watch APPLIED STEPS. A new line appears every time, such as Changed Type or Removed Blank Rows. If something goes wrong, click the X beside that step to delete it.
The table below shows the settings that matter most in this step.
| Setting | Where to find it | Why it matters |
|---|---|---|
| **Data Type** | Transform tab | Wrong types break sums and sorting |
| **Remove Blank Rows** | Home > Remove Rows | Blank lines distort counts |
| **Custom Column** | Add Column tab | Keeps calculations inside the query |
| **Applied Steps** | Query Settings pane | Shows and edits every recorded action |
Step 4: How Do I Handle Changes and Combine More Data?
Real reports rarely stay identical. This step makes the query tolerant of that.
1. If you need to stack data from two different sources, use Home then Append Queries. An append creates a query containing all rows from the first query followed by all rows from the second. Choose Append Queries as New for a separate result (an intermediate append) or Append Queries to extend the current query (an inline append).
2. If you need to bring in a lookup, such as a region list or product category table, use Home then Merge Queries, select the matching column in each table, and expand the new column once the merge completes.
3. To see the underlying code, click View then Advanced Editor. Power Query records your work in the M language, and you can write and modify your own steps there.
4. If a column name changes between months, you can rename it in the editor, so the downstream pivot table is unaffected.
A typical edit in the Advanced Editor is a filter line like this:
`= Table.SelectRows(#"Changed Type", each [Net Amount] <> null)`
What you should see: the preview refreshes, rows with nothing in Net Amount disappear, and a new line appears in APPLIED STEPS.
Step 5: Load the Query Into Excel
1. In the editor, click Home then the arrow under Close & Load, then Close & Load To....
2. In the dialog, choose Table if you want the clean data on a sheet, or Only Create Connection if you only want a pivot table on top of it.
3. Choose New worksheet and click OK.
What you should see: a new sheet with your cleaned, combined data formatted as an Excel table, and the Queries & Connections pane open on the right. It shows the query name and the number of rows loaded.
For large data sets, loading only a connection and a data model keeps the sheet light. If you are looking at hundreds of thousands of rows, that choice matters.
Step 6: How Do I Create a Pivot Table and Refresh It Automatically?
This is where the report becomes something a manager can read.
1. Click any cell in the loaded table.
2. Select Insert then PivotTable, confirm the table range and choose New Worksheet.
3. Drag Region to Rows, Month to Columns and Net Amount to Values.
4. Right-click a value, choose Value Field Settings, and set the number format.
Next, make the refresh as hands-off as Excel allows.
1. Open Data then Queries & Connections, right-click your query, and choose Properties.
2. Tick Refresh data when opening the file.
3. If you want the pivot to update with it, tick Refresh this connection on Refresh All.
4. Click OK.
From now on, the monthly routine is: drop the new export into the folder, open the workbook, and click Data then Refresh All. The pivot table updates with the new month.
| Option | Where | What it does |
|---|---|---|
| **Refresh data when opening the file** | Query Properties | Updates on open |
| **Refresh All** | Data tab | Updates every query and pivot |
| **Only Create Connection** | Close & Load To | Keeps the sheet empty and light |
A workbook refreshes only when someone opens it. Excel on its own will not run the refresh overnight on a closed file. That limit comes up again in the next step.
Step 7: What Are the Signs You've Outgrown Excel and Need Power BI?
Power Query in Excel solves the preparation problem. It does not solve every reporting problem. Run through this list honestly.
| Sign | What it looks like in practice |
|---|---|
| **Refresh is slow** | You start a refresh and go for coffee |
| **File size keeps growing** | The workbook is slow to open and email |
| **Nobody refreshes on schedule** | Reports go stale when one person is away |
| **Many copies of the file** | Several versions circulate and numbers disagree |
| **Access control matters** | Different people should see different rows |
| **You need an audit trail** | Leadership asks who looked at what, and when |
If you tick one or two, Excel with Power Query is probably still fine. If you tick three or more, you are paying for Excel in manual effort and in trust.
Switching is less painful than it sounds because the work carries across. In Power BI Desktop, you can open Transform data, create a blank query, open the Advanced Editor and paste the M code from your Excel query. Your cleaning logic comes with you. The rest of the move is publishing to the service and setting a refresh schedule, so the report no longer depends on one person opening a file.
Costs are modest to start. Power BI Pro is $14 per user per month and Premium Per User is $24 per user per month, at list prices since 1 April 2025. Our comparison of Power BI Pro vs PPU vs Fabric explains which tier fits which team. If you are new to the platform, what Power BI is, in plain English is a good primer. One caution on AI features: Copilot in Power BI needs a paid Fabric capacity of F2 or higher, or Power BI Premium P1 or higher, so a Pro or PPU licence alone is not enough.
Once the data is moving, design matters as much as plumbing. Our Power BI dashboards leaders actually use build guide covers what to put on the page.
Is It Better to Use DAX or Power Query?
They do different jobs, so the answer is usually both. Use Power Query to shape data before it loads: combining files, fixing types, removing columns, merging lookups. Use DAX to calculate on the loaded model: year-to-date totals, ratios, running balances that respond to filters. A rule of thumb: if the result is the same no matter what the viewer selects, do it in Power Query. If it should change with the filter, use DAX.
Is Power Query Better Than VBA?
For data preparation, usually yes. Power Query shows every step in a list, needs no code for common tasks, and a colleague can open the query and see what happened. A macro is a script that is harder to audit and tends to break when someone moves a column. Macros still make sense for actions inside the workbook, such as formatting or sending a file. Many teams keep a macro only for the last mile and let Power Query handle the data.
Common Mistakes
- Hard-coding a single file path. If you connect to one file instead of the folder, every new month needs a manual edit. Fix it by rebuilding the connection with Get Data then From Folder.
- Leaving column types as automatic guesses. An ID such as 00123 loses its leading zeros if it is read as a number. Set the type to Text explicitly, and check the Changed Type step.
- Cleaning in the sheet instead of in the query. Manual edits on the loaded table are wiped on the next refresh. Make every fix a step in APPLIED STEPS.
- Mixing report files and unrelated files in the source folder. The folder connector reads everything. Keep the folder to source exports only, or add a filter on the Extension column in the editor.
- Putting the output workbook in the source folder. The query then reads its own workbook. Store the report separately.
Troubleshooting
- The Power Query Editor will not open, or Get Data is greyed out. Likely cause: a missing component such as the Edge WebView2 run-time or .NET framework 4.7.2 or later, or an Excel build that predates the feature. Update Office and install the missing component, then restart Excel.
- Refresh fails with an error naming a column. Likely cause: a source file renamed or removed a column the steps refer to. Open the editor, find the step flagged in APPLIED STEPS, and update the column name or remove the step.
- Refresh succeeds but totals look wrong. Likely cause: duplicate rows from an overlapping export, or a wrong data type. Check the folder for duplicate files and review the Changed Type step.
If your report has already outgrown a single workbook, a short scoping conversation is quicker than another round of patching. Book a review through Power BI consulting and we will tell you plainly whether Excel with Power Query still fits.
Sources
Facts and prices checked November 2026.
---
About Lets Viz: Lets Viz has delivered Power BI and analytics work since 2020 for mid-market teams in finance, healthcare, manufacturing, retail and professional services. We hold a 5.0 Clutch rating, and our practitioners build, govern and support the reports we design.