How to Find Duplicate Workbooks and Unused Dashboards
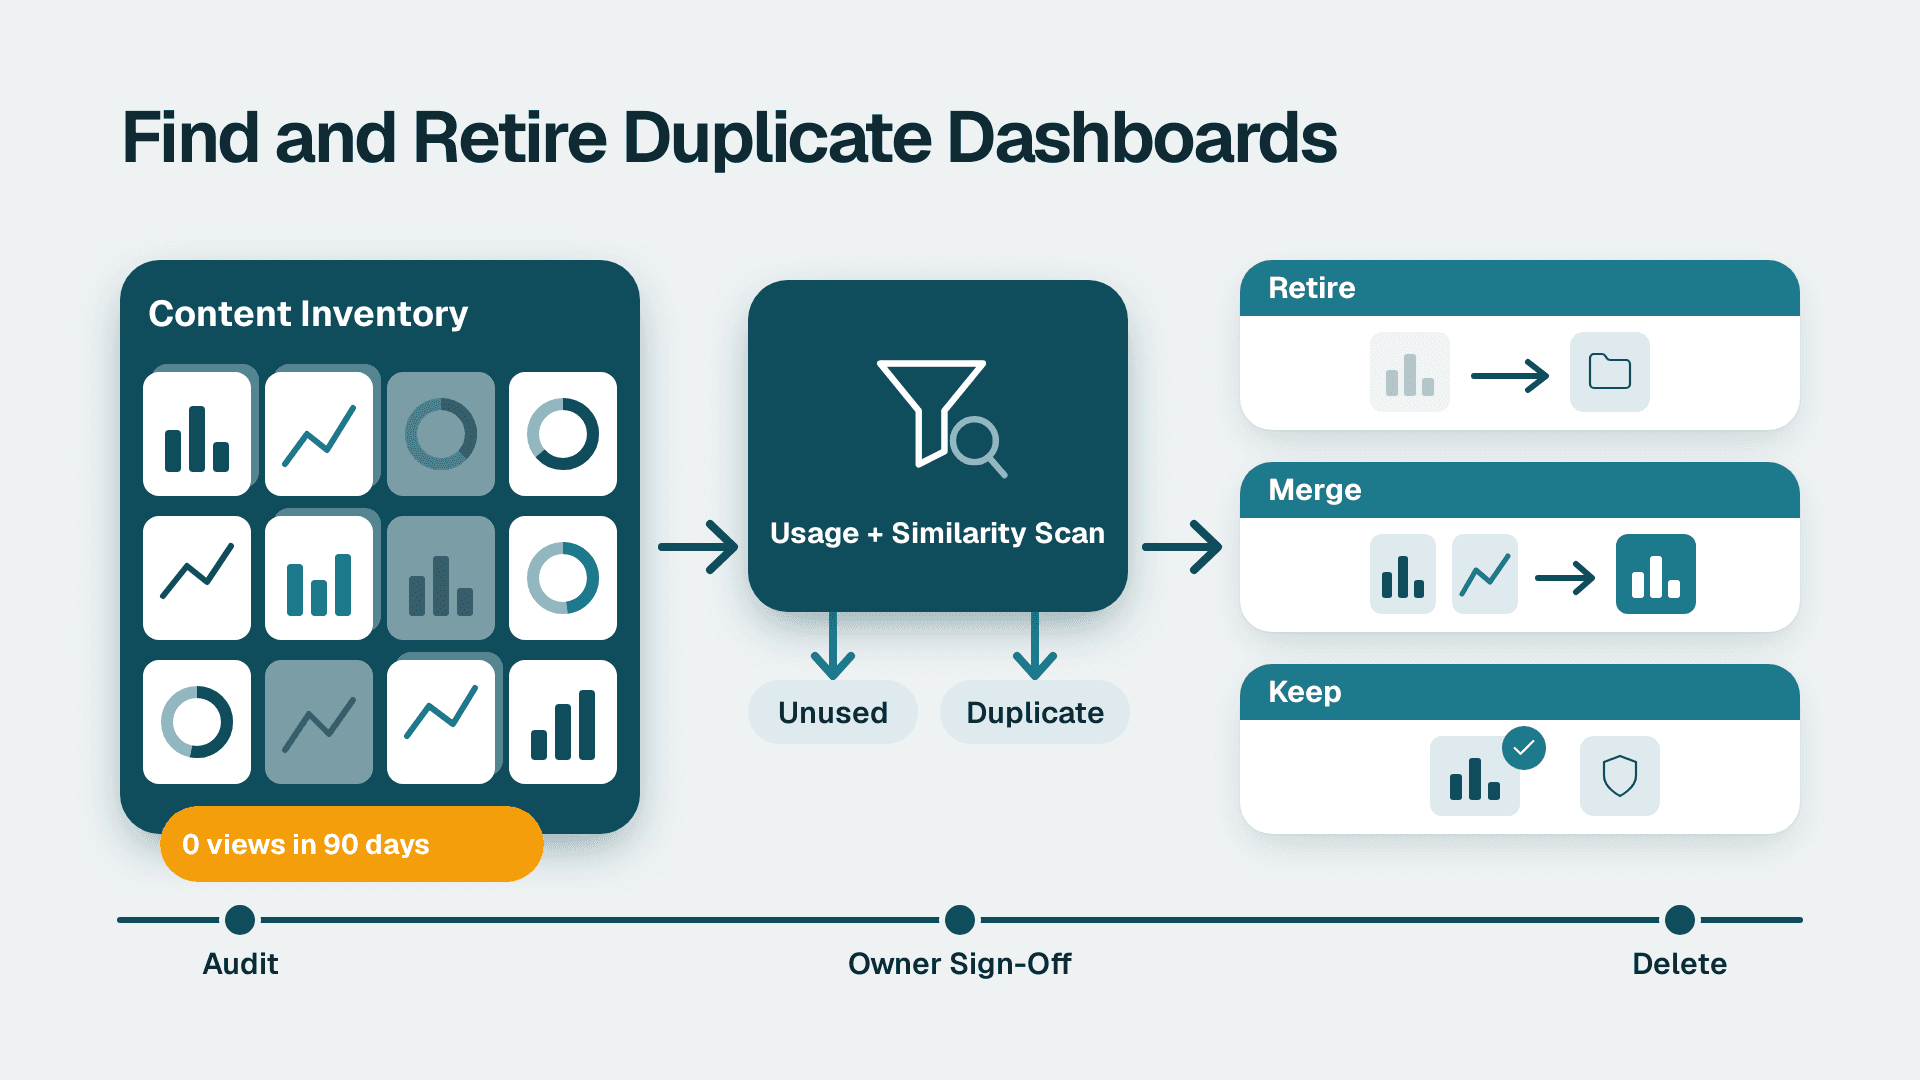
You will build a defensible inventory of redundant workbooks, unused dashboards and duplicate data sources, then decide what to retire, merge or keep. For a mid-sized site with a few hundred workbooks, plan on one to two working days for the audit itself and a further week for owner sign-off. The last step compares the result with Power BI workspace governance and lineage tools.
What You'll Need
- Site administrator rights on your current BI server or cloud site, so you can see every project, workbook and data source, including other people's content.
- Access to the administrative views (usage and stale-content reports), or permission to call the server's REST API for content listings and view counts.
- Read access to the database or warehouse that the data sources point to, so you can compare connection strings and queries.
- A spreadsheet with these columns: Item name, Type, Project, Owner, Last modified, Last viewed, Views (90 days), Connection, Duplicate group, Decision.
- For the comparison step: a Power BI tenant with Fabric administrator (formerly Power BI administrator) rights, plus access to the Microsoft Purview audit log if your compliance team has enabled it.
- A named approver for each business area. In regulated industries, this is usually the data owner or compliance lead, and you need them before anything is deleted.
If you want a quick view of how mature your reporting estate is before you start, the free BI readiness self-assessment takes a few minutes and tells you whether governance or tooling is the bigger gap.
Step 1: Set the audit scope and retention rules
Decide what "unused" and "duplicate" mean before you look at any data. Otherwise the argument starts after the list is built, and the list loses.
1. Write down your unused threshold. A common starting point is zero views in 180 days, extended to 400 days for anything tied to annual or regulatory reporting such as year-end filings.
2. Write down your duplicate rule: two items are duplicates when they share the same data source connection and the same set of fields, regardless of name.
3. List the protected categories: anything referenced in a policy, audit evidence pack or regulator submission is excluded from deletion until the owner confirms.
4. Decide where retired content goes. Create a project called Archive - Pending Deletion and set its permissions so only administrators and the original owner can open it.
What you should see: a one-page scope note with the thresholds, protected categories and archive location, signed off by your approver. If the note is not agreed, do not continue.
Step 2: Export the full content inventory
You need every workbook, dashboard and data source in one flat table, with owner and dates.
1. In the site's admin area, open Content, then switch between the Workbooks and Data Sources tabs. Turn on the columns Owner, Project, Modified and Size using the column selector.
2. For larger estates, use the REST API instead of the UI. Call the query endpoints for workbooks and data sources with a page size of 100 and loop until the total count matches what the UI shows.
3. Paste the output into your spreadsheet, one row per item, with Type set to Workbook or Data Source.
4. Add a second tab for extracts and subscriptions, because scheduled refreshes and email subscriptions keep otherwise dead content looking busy.
What you should see: a row count that equals the total shown on the Content page. If the counts differ, a project or permission is hiding content from you, so fix that first.
Step 3: Pull usage data to find unused dashboards
A dashboard that nobody opens is the easiest win, but only if the usage data is reliable.
1. Open the administrative views and choose Traffic to Views. Set the date range to your unused threshold from Step 1, and export the table.
2. Open the Stale Content view and set the inactivity period to the same number of days. Export it as well.
3. In your spreadsheet, add Views (90 days) and Last viewed by matching on the item's unique ID, never on name. Names are duplicated constantly, which is the point of this audit.
4. Filter for Views = 0 and Last viewed older than your threshold. Colour these rows amber.
5. Remove views from the owner and from the refresh service account. In an auditable environment, an owner checking their own dashboard is not consumption.
What you should see: a shortlist of amber rows. In most estates this is a surprisingly large share of the total, but do not guess the figure for yours; count it.
Check for hidden dependencies
For each amber workbook, check its Connected Workbooks (for a data source) or its Subscriptions and Alerts (for a dashboard). A data source with zero views of its own but five dependent workbooks is not unused. Mark these "dependency - keep for now".
Step 4: Find duplicate workbooks and data sources
Usage tells you what is ignored. Duplication tells you what is competing.
1. Sort the workbook rows by Connection (server, database and table or custom query). Rows that share a connection are candidates.
2. Assign each candidate group an ID in Duplicate group, for example DG-014.
3. Open each pair and compare three things: the fields used, the calculated fields (look for the same formula under two names), and the filters applied at data-source level.
4. For data sources, look for the typical patterns: a published source plus an embedded copy of the same connection, several extracts of one table with different refresh times, and copies named "Final", "v2" or "Copy of".
5. In each group, mark one item Survivor (the most used, most recently modified, with a named owner) and the rest Merge or Retire.
What you should see: groups of two to six items with one survivor each. Where two items look identical but give different numbers, stop and record it as a definition conflict. This is the most valuable finding in the audit, because it means two teams are reporting different answers to the same question.
Redundant data sources versus redundant workbooks
Treat them separately. Retiring a workbook affects the people who open it. Retiring a data source breaks every workbook that depends on it. Always do data source changes second, after the dependent workbooks have been re-pointed.
Step 5: Review ownership, certification and sensitive data
In a regulated industry the question is not just "is it used" but "is it permitted to exist".
1. Filter for rows where Owner is a departed employee or a service account with no named human. Send these to the business-area approver first.
2. Check which items carry a certification or a sensitivity label. Items with neither, connected to personal or financial data, go to the top of the review queue.
3. For each amber or duplicate row, record who has permissions on it. A forgotten workbook with broad permissions and live data is a bigger risk than a forgotten workbook that only its author can see.
4. Check extract refresh jobs. An unused workbook that still refreshes nightly is consuming compute and keeping a copy of data alive in a place nobody monitors.
What you should see: a column called Risk with values High, Medium and Low. Review High items before touching anything else, because an audit that finds unmanaged sensitive data should trigger your incident or data-protection process, not just a cleanup ticket.
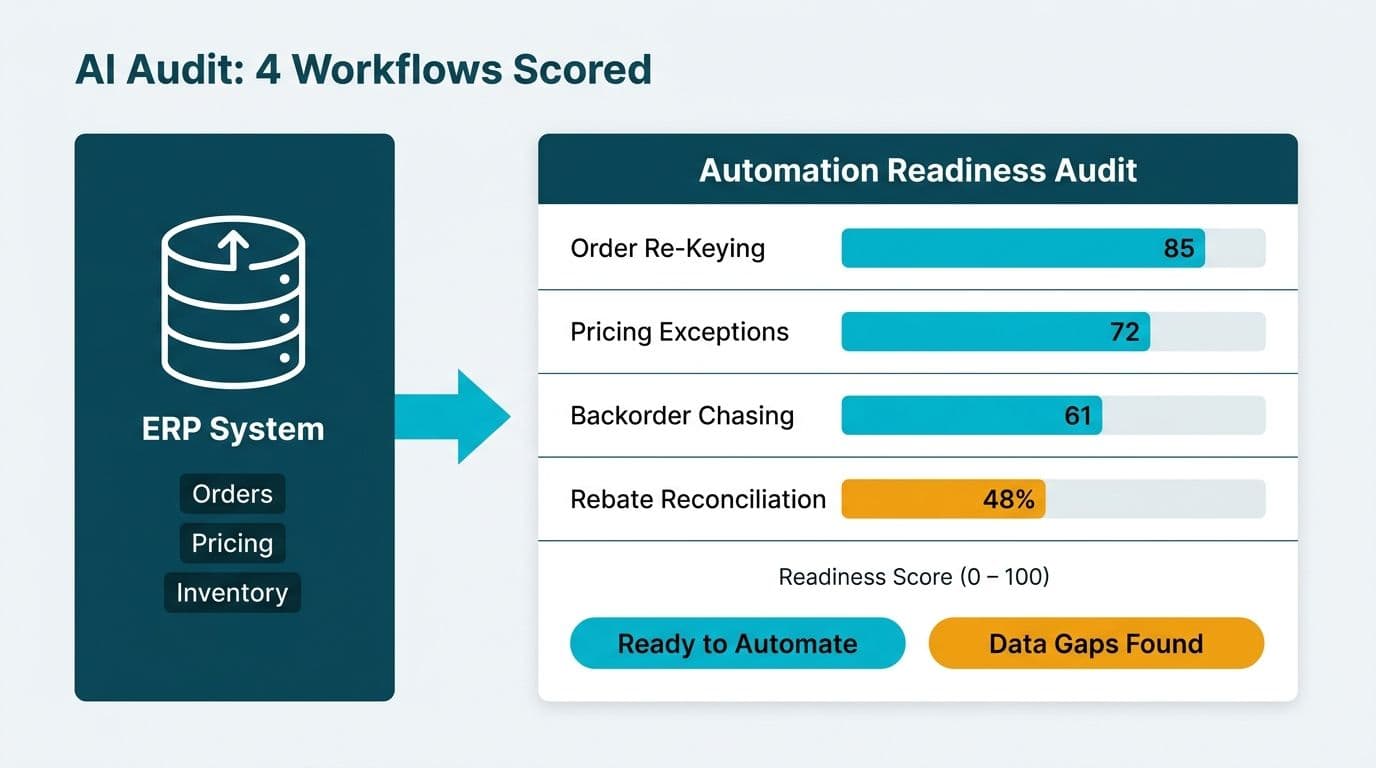
This ties directly into AI work. Anyone asking what is data readiness for AI should start here: duplicated, undocumented sources with unclear owners are the first thing that makes a copilot or an AI assistant give inconsistent answers. The same applies to an ERP data quality checklist before AI implementation, which begins with the same questions about owner, definition and lineage.
Step 6: Decide, notify and retire in stages
Never delete directly from the audit list. Use a staged process so you can reverse any decision.
1. Send each owner a list of their items with the proposed decision and a 14-day reply window. State plainly that silence means the item moves to the archive, not that it is deleted.
2. After 14 days, move the approved Retire items into Archive - Pending Deletion. Remove their schedules and subscriptions at the same time.
3. Wait one full reporting cycle (a month, or a quarter-end for finance content). If nobody asks for the item back, export it as a backup file and store it per your records policy.
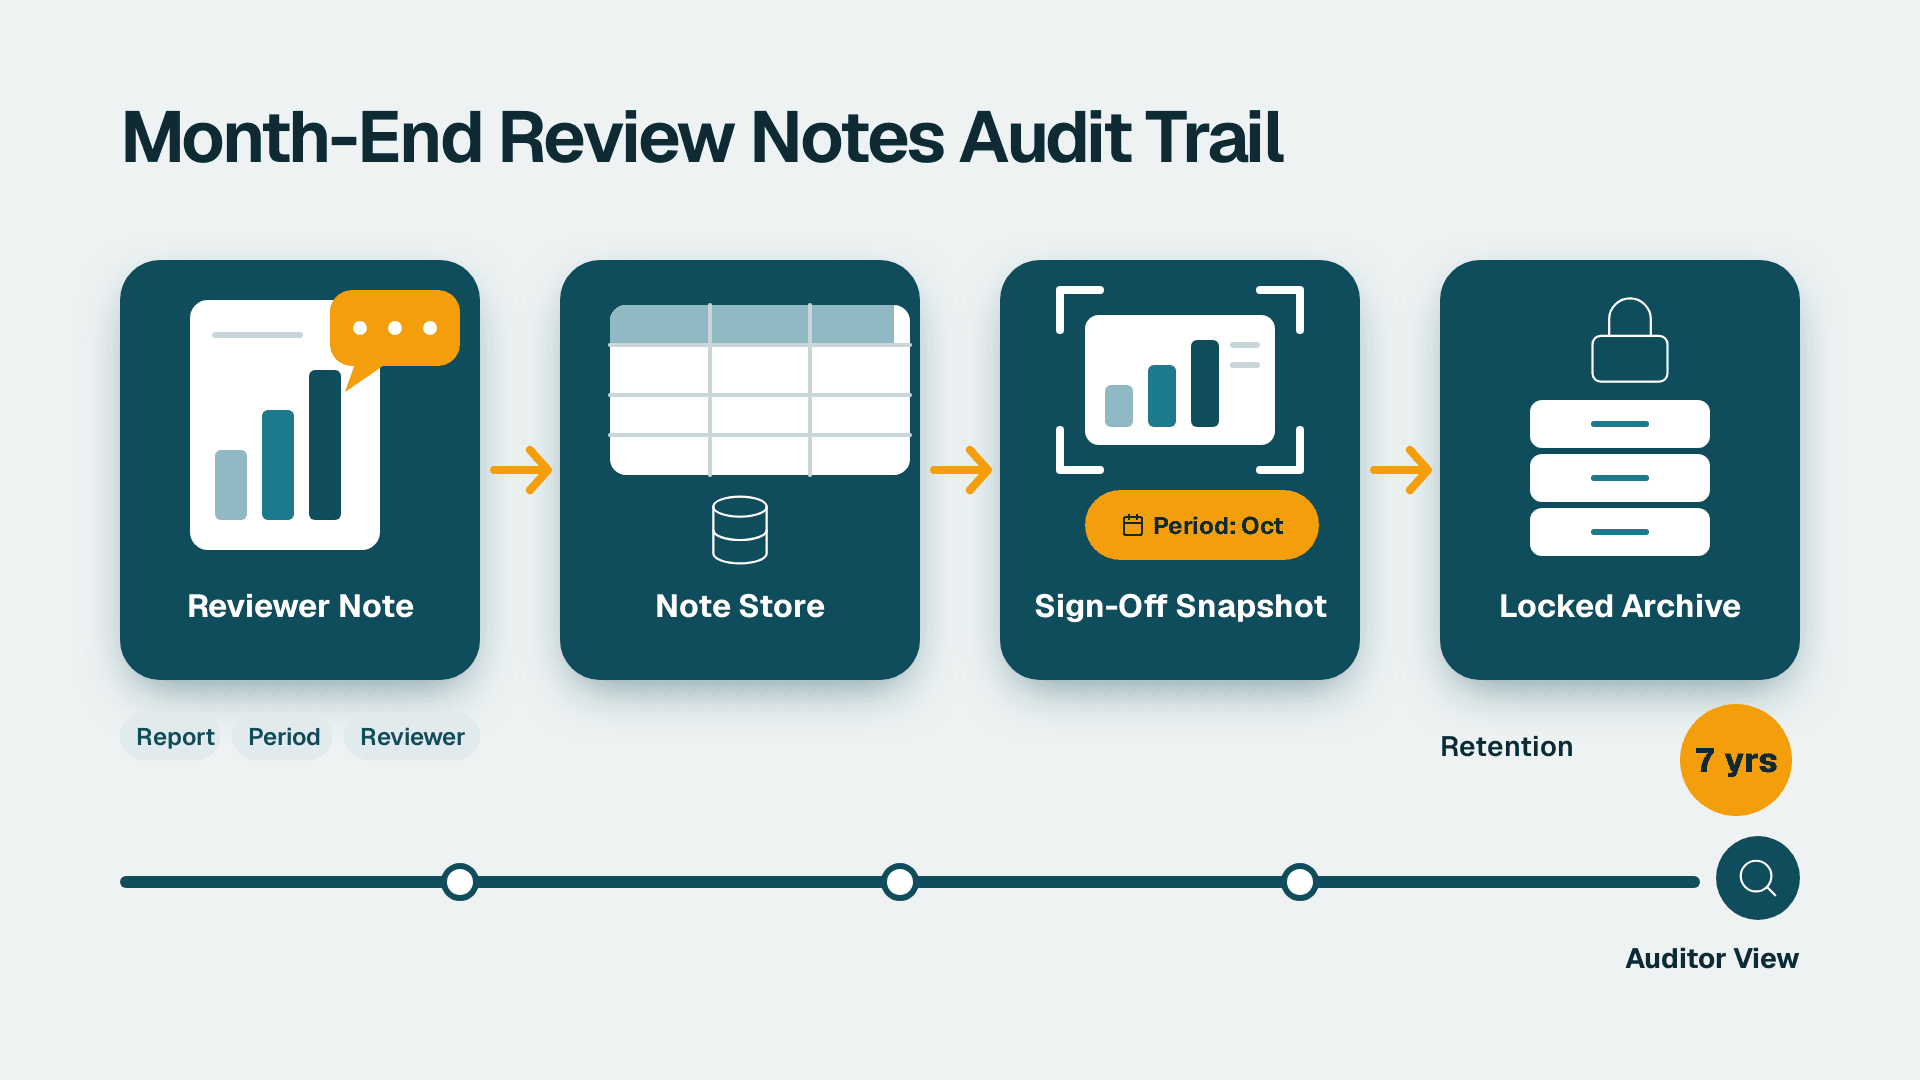
4. Delete from the archive and record the date, approver and item ID in your spreadsheet. That record is your audit evidence.
5. For Merge items, re-point dependent workbooks to the survivor data source, republish, and then retire the duplicate source.
What you should see: a smaller content list, a closed log and no urgent requests to restore items. If you receive restore requests, treat each as a finding about your usage data, not as a failure.
Step 7: Compare with Power BI workspace governance and lineage tools
Once the cleanup is done, decide whether your platform will stop the mess returning. Here is how the same audit looks in a Power BI environment.
1. Inventory. In the Admin portal, open Workspaces to list all workspaces with owner, capacity and state. For a full inventory of reports, semantic models and their metadata, use the admin scanner APIs, which return datasets, reports, data source connections and, optionally, lineage information in bulk.
2. Usage. Each workspace has Usage metrics for reports, and the activity events from the admin API show who opened what. If your compliance team has switched on Microsoft Purview Audit (Standard), those logs are kept for 180 days, so a longer "unused" threshold needs you to export the events on a schedule.
3. Lineage. Open a workspace and switch to Lineage view. It draws each data source, semantic model, report and dashboard as connected nodes, and Impact analysis shows which downstream items and workspaces would be hit if you change a model. This replaces much of the manual dependency checking in Step 3 and Step 4.
4. Duplicate control. Endorse one semantic model as Certified or Promoted and have report authors build thin reports on top of it. That structure prevents most of the duplicate-source problem rather than finding it later. Pair this with workspace roles, so that only a small group can publish to a production workspace.
5. Change tracking. For an audit trail of who changed which report, see our guide to an AI change log for Power BI reports.
What you should see after trying it: the same audit, but with the inventory and lineage coming from the platform instead of a spreadsheet you maintain by hand.
What to weigh in the comparison
- Lineage depth. Check whether the lineage view you are evaluating shows column-level dependencies or only item-level ones, and test it on your own estate, not a demo.
- Licensing. Power BI Pro is $14 per user per month and Premium Per User is $24 per user per month. Governance features such as the admin scanner APIs depend on your tenant settings and role, so confirm what you will have switched on before you commit to a plan.
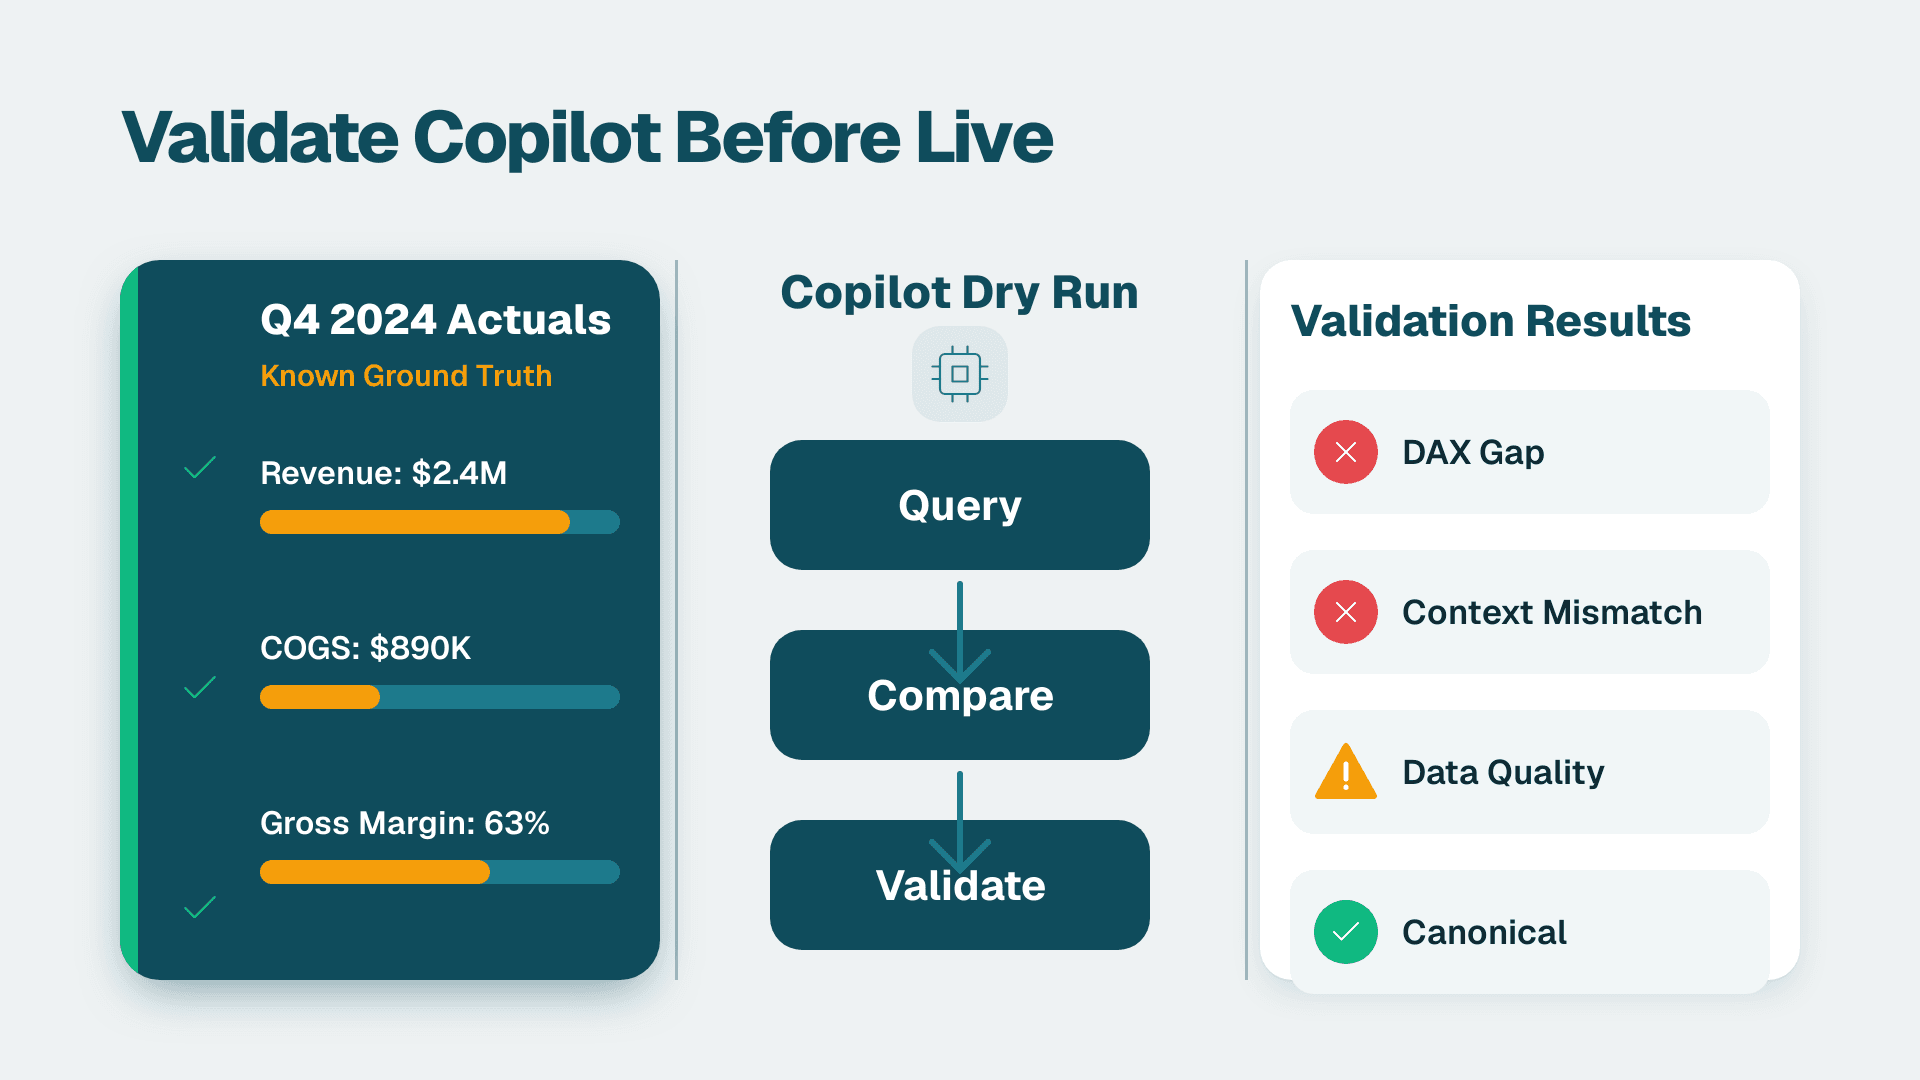
- Copilot. If AI assistance is part of your reason for consolidating, note that Copilot in Power BI needs a paid Fabric capacity F2 or higher, or Premium P1 or higher. A Pro or PPU licence alone is not enough. Our Power BI Copilot readiness checklist covers the conditions to meet first.
- Market context. Power BI has a 13.74% share of the business intelligence and analytics platforms space (Market.us Scoop), which matters mainly because it affects hiring and partner availability, not governance quality.
- Cost visibility. Gartner forecasts $2.59 trillion in AI spending in 2026, yet only 26% of organizations see AI costs in full and in real time (PointFive). The same lack of visibility shows up in BI estates, where nobody can say what the unused dashboards cost to run.
If you decide to move, the Power BI workspace migration guide for Microsoft Fabric walks through the move, and the Step 6 retirement log doubles as your migration scope: migrate only the survivors.
Common Mistakes
- Matching duplicates by name. Two items named "Sales Dashboard" may be unrelated, and two differently named items may be identical. Match on connection and field list, and record the item ID.
- Counting owner views as usage. An owner who opens their own report every Monday hides a dashboard that nobody else reads. Exclude owner and service-account views before applying the threshold.
- Deleting a data source before its workbooks. This breaks every dependent item at the next refresh. Re-point workbooks to the survivor first, then retire the duplicate source.
- Using one threshold for all content. Quarterly and annual regulatory reports look dead for months. Apply the longer threshold from Step 1 to protected categories.
- Skipping the audit record. If you cannot show who approved a deletion and when, the cleanup itself becomes an audit finding. Keep the log in Step 6.
Troubleshooting
- Every item shows zero views. The usage data was probably not being collected for the period you selected, or the date range is longer than the retention of the log. Shorten the range and check how long usage history is kept on your site.
- Content count in your export is lower than on the Content page. Your account does not have access to every project, or the API call stopped paging early. Confirm site administrator rights and compare the page count to the total.
- A "retired" workbook is restored by someone in a panic. It was probably consumed through an embedded link, a subscription email or a scheduled export that does not register as a normal view. Check subscriptions and embedded usage before the next round.
If the audit shows the real gap is the data underneath rather than the dashboards, our guides on how to build an AI data strategy and how to conduct an AI audit are the natural next reads. For an estimate of what a governance clean-up and platform decision would cost you, try the Instant project cost calculator.
---
About Lets Viz: Lets Viz has delivered analytics and BI consulting since 2020, serving healthcare, financial services, distribution, professional services and SaaS clients, including organisations in regulated industries. We hold a 5.0 rating on Clutch. Our team designs governance models, lineage and audit trails for Power BI and Microsoft Fabric, and runs the kind of content audits described in this guide.