What Is Power BI? A Plain-English Guide for Business Buyers
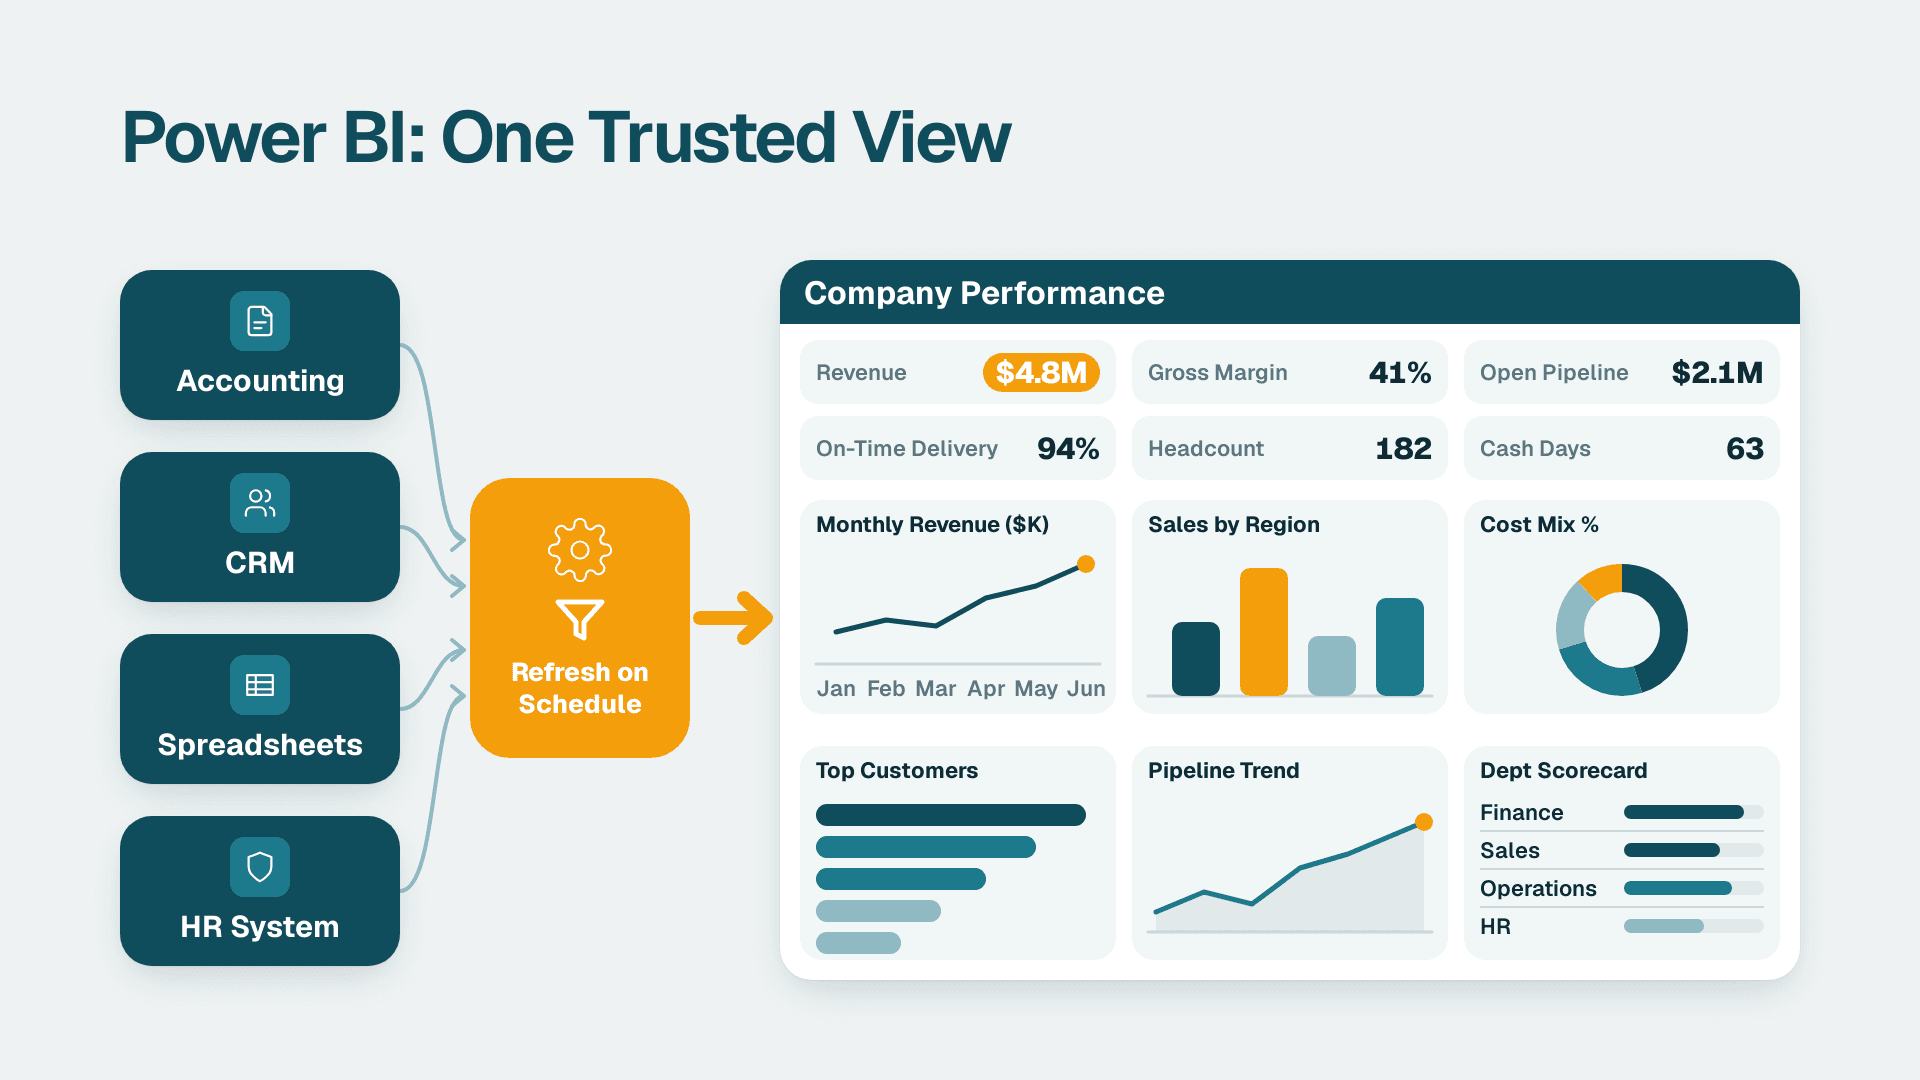
Power BI is Microsoft's business analytics platform. It connects to the systems where your company keeps its data, such as accounting, CRM and spreadsheets, and turns them into interactive reports that refresh on a schedule. In plain terms, it replaces hand-built spreadsheet packs with one shared, always-current view of the numbers.
Key Takeaways
- Power BI is a reporting and analysis platform, not a database, a spreadsheet or a data warehouse.
- Its value comes from one trusted set of numbers shared across finance, sales, operations and HR.
- Pro costs $14 per user per month and Premium Per User costs $24, but Copilot needs paid capacity on top.
- Power BI shows and analyses data well; it does not fix bad source data or write changes back on its own.
- Define the decisions first, then pick the licence and build the model.
What Is Power BI and Why Do Companies Use It?
Power BI is a tool that gathers data from many systems, organises it into a consistent model, and presents it as dashboards and reports people can filter and explore themselves. Companies use it because the alternative, a monthly cycle of exports and copy-paste, is slow, error-prone and hard to audit.
According to Microsoft's Power BI documentation, it is a business analytics platform that helps turn data into actionable insights. If you search for 'power bi what is' or 'what is power bi microsoft', that is the short official answer. The practical answer for a buyer is more useful: it does three jobs in sequence.
1. Connect. It pulls data from accounting systems, CRMs, ERPs, databases, files and cloud apps.
2. Model. It defines how the data fits together, so 'revenue', 'customer' and 'month' mean the same thing in every report.
3. Present. It publishes interactive visuals that managers can slice by region, product, team or period without asking an analyst.
The modelling step is where most of the value, and most of the risk, sits. A Power BI report is only as trustworthy as the definitions behind it. Teams that want outside help scoping those definitions and the rollout around them often look at Power BI consulting before they buy a single licence.
Power BI is also widely adopted. Recent TechnologyChecker data puts its share of the Data Visualization and BI category at 22.86%, which makes it the dominant platform in that category. For a mid-market company already running Microsoft 365, that matters in practical ways: hiring is easier, training material is plentiful, and users sign in with accounts they already have.
What Is Power BI Used For, Department by Department?
Power BI is used to answer recurring business questions with live data instead of static files. The same platform serves every department, but the questions differ, and so does the first dashboard worth building.
If you have seen searches like 'what is power bi used for' or 'what is power bi use for', the honest answer is that the tool is general and the use cases are specific. The table below maps common departments to the problem each one typically brings.
| Department | Typical problem before Power BI | What Power BI replaces it with |
|---|---|---|
| Finance | Month-end packs assembled by hand from several exports | A refreshable P&L, cash and variance view tied to the ledger |
| Sales | Pipeline numbers differ between the CRM and the weekly deck | One pipeline and quota view that every manager reads |
| Operations | Delays and stock issues found after the fact | Live views of throughput, backlog, inventory and service levels |
| HR | Headcount and attrition reported quarterly, late | Monthly workforce views with controlled access to sensitive fields |
| Marketing | Campaign results spread across several platforms | A combined view of spend, leads and pipeline contribution |
| Executive team | Different versions of the same KPI in different meetings | A single scorecard with agreed definitions |
Finance
Finance is usually the first and most valuable use case. Typical Power BI financial dashboard examples include a profit and loss view with drill-down to account level, a cash and receivables ageing view, and a budget versus actual comparison with variance commentary. The risk is trust. If the dashboard total does not match the general ledger, finance stops using it, so a reconciliation process between Power BI and the general ledger should be part of any finance rollout.
A US SaaS finance team subject to SOC 2 controls, for example, will care as much about who can see which numbers as about the charts themselves. A UK fintech firm will add GDPR considerations to the same question.
Sales and marketing
Sales leaders want pipeline by stage, win rates, and forecast against quota. Marketing wants cost per lead and which campaigns feed real pipeline. The common benefit is that both teams stop arguing about whose spreadsheet is right.
Operations and supply chain
Operations teams use Power BI to watch queues, orders, stock and service-level performance. Suppose a Canadian manufacturing company wants one daily view of orders, machine downtime and inventory across two plants. Power BI can combine those sources, and if the data includes personal information about employees or customers, PIPEDA shapes who may see what.
HR and people analytics
HR dashboards cover headcount, hiring funnel and attrition. These are also the reports where row-level security matters most, because a manager should see their own team and not the whole company's pay data. In US healthcare settings, anything touching patient data raises HIPAA questions that should be settled before data is loaded, not after.
What Are the Parts of Power BI?
Power BI is not one program. It is a small set of components, and knowing them helps you budget and assign roles. Microsoft describes two main components: Power BI Desktop, which is best for data modelling and report creation, and the Power BI service, which is ideal for sharing and collaboration. A Power BI Mobile app lets people view reports on phones and tablets.
Power BI Desktop
Desktop is a Windows application that analysts download from Microsoft. It connects to more than 100 data sources and uses the Power Query Editor to clean and reshape data. It also builds the data model, using relationships and a formula language called DAX (Data Analysis Expressions). Desktop provides access to more than 30 built-in and custom visuals, plus advanced tools such as performance analyzer, external tools and composite models.
One modelling choice you will hear analysts debate is when to use calculated columns vs measures in DAX. A rule of thumb that holds up in practice: a calculated column is worked out row by row when the data refreshes and stored in the model, which suits labels, groupings and flags. A measure is calculated on demand based on whatever the user has filtered, which suits totals, ratios and anything that must respond to slicers. Most business numbers, such as revenue, margin and days sales outstanding, belong in measures. As a Microsoft training path on data modelling notes, DAX is the formula language used to create calculations and add logic to reports and semantic models. That path has 6 modules, is rated Intermediate, and expects prior familiarity with Power BI Desktop and basic concepts such as tables, relationships and calculations.
For a buyer, the takeaway is simple: the person building your model needs real modelling skill, not just chart-making skill.
The Power BI service
The service is the cloud workspace where reports are published and shared. It offers workspaces, apps for distributing dashboards and reports, dataflows, shared datasets, scheduled refresh, email subscriptions, alerts and Q&A. Security features include row-level security (RLS), sensitivity labels, usage metrics and audit logs. For governance, Microsoft Purview Audit (Standard) keeps audit logs for 180 days, so if your compliance team needs a longer history you must plan for that separately.
Paginated reports and Report Server
Some outputs must look exactly the same every time, such as invoices or statements. Paginated reports are structured, printable reports created with Power BI Report Builder. Organisations that must keep reports on-premises can use Power BI Report Server, with the option to move to the cloud later.
How Does Power BI Relate to Microsoft Fabric?
Power BI is a core component, or workload, of Microsoft Fabric, Microsoft's broader data platform. Power BI reports, dashboards and the Power BI service are unique to Power BI, while features such as data integration, dataflows (legacy) and security are shared with other Fabric experiences.
For existing Power BI users, no migration to Fabric is needed. Power BI content and workspaces stay the same, and people sign in with their existing Power BI or Microsoft 365 account. Fabric matters when you want more than reporting, for example heavier data engineering, or when you need capacity for features such as Copilot. If you are weighing the two, this breakdown of what actually differs between Microsoft Fabric and Power BI is a sensible next read.
Is Power BI the Same as SQL?
No. SQL is a language for querying and managing data inside a database. Power BI is a tool for modelling and presenting data, often from a database that is queried with SQL.
A useful way to picture it: the database stores the facts, SQL retrieves them, and Power BI turns them into something a non-technical manager can read and explore. Analysts often use both. They write SQL to shape data at the source, then use Power BI for the semantic model, measures and visuals. You do not need SQL skills to build many reports, but they help a great deal when source data is messy.
Is Power BI Better Than Excel?
It is better at some jobs and worse at others. Excel remains excellent for ad hoc analysis, quick calculations and small, one-off models. Power BI is better when many people need the same numbers, the data is larger or comes from several systems, and the report must refresh without someone rebuilding it each month.
The two work together rather than compete. Many teams keep Excel for planning inputs and connect it to Power BI for distribution. If that is your setup, see how to connect Excel to Power BI with automatic refresh. For a fuller comparison, read how Power BI differs from Excel.
| Question | Excel | Power BI |
|---|---|---|
| Best for | Individual analysis and modelling | Shared, governed reporting |
| Data sources | Mostly files and some connections | Over 100 sources through Desktop |
| Refresh | Manual or workbook-based | Scheduled in the service |
| Access control | File-level sharing | Workspaces, RLS and sensitivity labels |
| Audience | The person who built it | Whole teams and leadership |
What Is Power BI Not?
Power BI is not a fix for bad data, not a database, and not a replacement for your accounting or planning systems. Buyers who expect otherwise are the ones who end up disappointed, so it is worth being direct about the limits.
- It is not a data cleaning miracle. Power Query can standardise formats and fix many issues, but if your CRM has duplicate customers or your chart of accounts is inconsistent, the dashboard will reflect that. Fix definitions at the source where you can.
- It is not a database or data warehouse. It holds a model for analysis. Your system of record stays where it is.
- It is not a write-back tool by default. Reports are designed for reading. If users need to enter budgets or approve items and have the change saved to a database, the power bi write-back to database options generally involve pairing a report with a companion app or a purpose-built component. Plan that as a separate design decision, not an assumption.
- It is not self-governing. Without ownership, workspaces fill with near-duplicate reports and conflicting numbers. Someone has to own definitions, access and clean-up.
- It is not automatic insight. A dashboard shows what happened. Deciding what to do about it still takes people who know the business.
- It is not a no-skills tool at scale. Anyone can build a first chart, but a reliable model with proper relationships, security and measures takes experience.
What Does Power BI Cost, and What Does Copilot Need?
Power BI licensing is per user for most mid-market teams. Since 1 April 2025, list prices are $14 per user per month for Power BI Pro and $24 per user per month for Premium Per User (PPU).
Copilot is where buyers get caught out. Copilot in Power BI and Fabric needs a paid Fabric capacity of F2 or higher, or Power BI Premium P1 or higher. A Pro or PPU licence alone is not enough, and trial capacities are excluded. There is no F64 minimum for Copilot; Fabric Copilot Capacity is a separate feature that does start at F64.
Here is how that looks for a typical team:
| Need | What it takes |
|---|---|
| Build and share reports with colleagues | Pro licences for creators and viewers |
| More advanced per-user features | PPU at $24 per user per month |
| Copilot | Paid Fabric capacity F2 or higher, or Premium P1 or higher |
| Longer audit history than 180 days | A separate compliance plan |
Because the right mix depends on how many people build versus only view, work through the comparison of Power BI Pro, PPU and Fabric licences before committing. Licence cost is usually smaller than the cost of building a model nobody trusts.
How Do You Start With Power BI Without Wasting Money?
Start with one decision-making problem, not with the tool. Microsoft's own getting-started flow has seven steps: get started, connect and prepare data, model and combine data, build reports and dashboards, explore and analyse, share and collaborate, and administer and secure. A buyer can translate that into five practical questions.
1. Which decision is hurting most? Pick one, such as late month-end reporting or an unreliable pipeline number.
2. Where does the data live? List the systems and who owns each one.
3. Who needs to see what? Decide access rules early, including any GDPR, PIPEDA, HIPAA or SOC 2 obligations that apply to your sector and region.
4. Who builds and who maintains? Decide between hiring, training an analyst, or bringing in outside support, and name an owner for definitions.
5. How will you know it worked? Agree one measurable outcome before the build, such as fewer hours spent assembling a monthly pack.
Keep the first release small. One well-built finance or sales model that people trust does more for adoption than ten half-finished dashboards. Once the model is stable, adding new reports on top of it is quick and cheap by comparison.
---
About Lets Viz: Lets Viz is a data analytics consulting firm that has built Power BI models, dashboards and governance setups since 2020 for clients including US healthcare organisations, UK fintech firms, Canadian manufacturers and global SaaS companies. We hold a 5.0 rating on Clutch and focus on reporting that finance and operations leaders can trust.
If you are deciding how to roll out Power BI in your business, see our Power BI consulting service.
Sources
- Power BI overview - Microsoft Learn
- Model data with Power BI - Microsoft Learn training path
- Download Power BI - Microsoft
Facts and prices checked October 2026.