SUMX Function in Power BI: Hospital Cost Analysis Guide
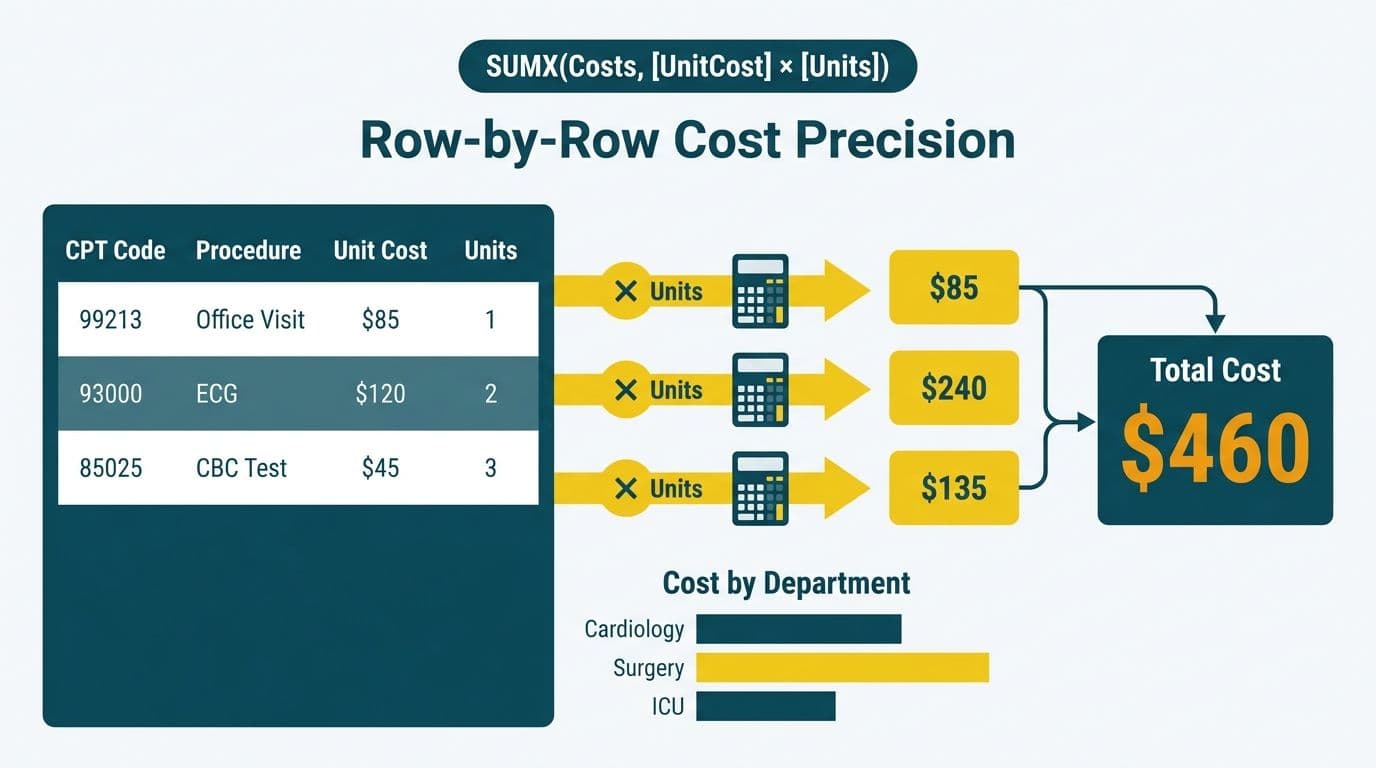
The SUMX function in Power BI is an iterator that evaluates a DAX expression on every row of a table before summing the results - making it the precise instrument for hospital cost analysis where procedure charges, supply costs, and labor rates vary at the line-item level. Combined with CALCULATE, SUMX enables healthcare finance teams to slice costs by patient, procedure, CPT code, and department without sacrificing the row-level accuracy that cost accounting and reimbursement audits demand.
Key Takeaways
- SUMX iterates row-by-row before aggregating, making it accurate for per-patient and per-procedure cost rollups where unit costs differ across encounters.
- CALCULATE modifies the filter context around a SUMX expression, enabling department-level cost slicing without a separate measure for each department.
- A star schema with separate fact tables for encounters, procedures, and supply costs is the structural prerequisite for correct SUMX results.
- HIPAA-compliant Power BI deployments must layer row-level security (RLS) over DAX cost measures to prevent cross-department data exposure.
- SUMX outperforms SUM for hospital data because real-world procedure charges are computed from units and unit rates - a row-level calculation the SUM function cannot perform on its own.
How Does the SUMX Function in Power BI Handle Hospital Cost Analysis?
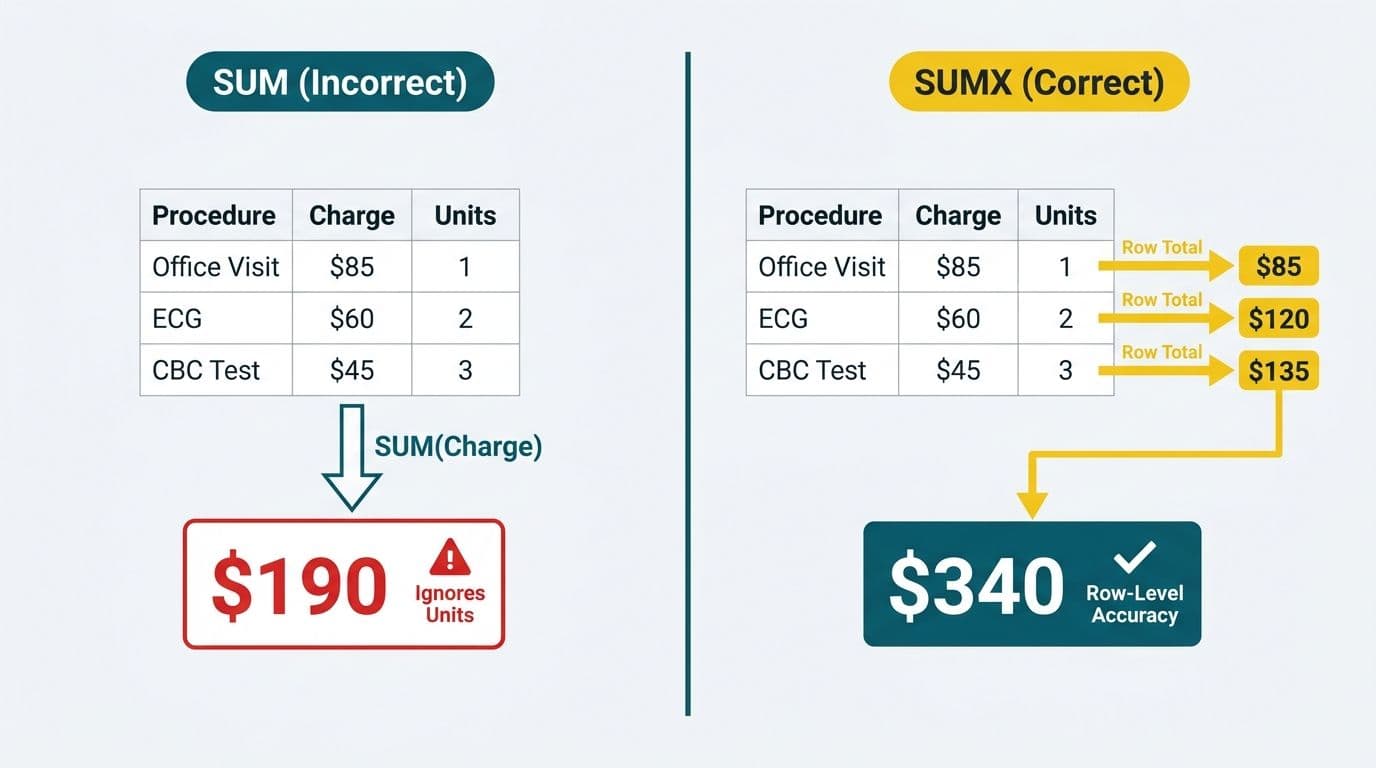
SUMX evaluates an expression for each row in a specified table, then sums every result. In a hospital cost model, this matters because no two encounters carry identical costs - anesthesia is billed per minute, medications per dose, and operating room time per quarter-hour interval.
The syntax is:
```dax
SUMX(<table>, <expression>)
```
A basic total procedure cost measure looks like this:
```dax
Total Procedure Cost =
SUMX(
ProcedureFact,
ProcedureFact[Units] * ProcedureFact[UnitCost]
)
```
Power BI's DAX reference (Microsoft, 2025) defines SUMX as an iterator that "changes the execution context to the row context of the specified table" before evaluating the expression - a property that preserves line-item accuracy regardless of which department filter or date slicer is active on the report page.
The iterator pattern becomes especially important in a hospital cost model because charge master data almost never stores a pre-computed extended cost. A single inpatient encounter might generate hundreds of ProcedureFact rows - one per medication administration, one per nursing assessment, one per lab order. Summing a hypothetical ExtendedCost column works only if every upstream ETL job reliably computed that column; SUMX computes it fresh at query time, row by row, so errors in pre-aggregation do not silently corrupt the total.
For teams beginning their analytics journey, Managed Power BI for healthcare teams covers the full DAX measure library and data model design needed to put cost measures like this into production.
What Data Model Does a Hospital Need Before Using SUMX?
Before writing any DAX, the schema must expose cost at the correct grain. A star schema with separate fact tables is the structural foundation, and SUMX results are only as accurate as the grain at which costs are stored.
| Table | Grain | Key Fields |
|---|---|---|
| EncounterFact | One row per patient encounter | EncounterID, PatientID, AdmitDate, DeptID |
| ProcedureFact | One row per procedure line item | ProcedureID, EncounterID, CPTCode, Units, UnitCost |
| SupplyCostFact | One row per supply item used | SupplyID, EncounterID, ItemCost |
| PatientDim | One row per patient | PatientID, DOB, InsuranceType |
| DepartmentDim | One row per department | DeptID, DeptName, CostCenter |
| ProcedureDim | One row per CPT code | CPTCode, ProcedureName, ClinicalCategory |
The relationships between these tables determine how filter context flows. DepartmentDim connects to EncounterFact on DeptID; EncounterFact connects to ProcedureFact on EncounterID. When a user selects a department in a slicer, Power BI propagates that filter through EncounterFact to ProcedureFact, and SUMX iterates only over the rows that survive the filter chain.
US health systems feeding Epic or Cerner data into this model typically land HL7 FHIR API payloads into Azure Data Lake or Microsoft Fabric before modelling. The practical steps for that ingestion layer are covered in the guide on how to connect EHR data to Power BI.
A Canadian regional health authority operating under PIPEDA would typically store encounter cost records at line-item grain for audit and reimbursement reconciliation - the natural fit for SUMX. A UK integrated care system following the NHS Data Security and Protection Toolkit would apply equivalent access controls at the dataset level before any DAX measure is authored.
How Do You Write SUMX Measures for Per-Patient, Per-Procedure, and Per-Department Costs?
Three SUMX patterns cover the most common hospital cost questions. Each builds on the star schema described above.
Per-patient total cost uses RELATEDTABLE to pull only the procedure and supply rows belonging to the patient in the current row context:
```dax
Patient Total Cost =
SUMX(
RELATEDTABLE(ProcedureFact),
ProcedureFact[Units] * ProcedureFact[UnitCost]
)
+
SUMX(
RELATEDTABLE(SupplyCostFact),
SupplyCostFact[ItemCost]
)
```
Place this measure in a matrix with PatientID on rows. RELATEDTABLE uses the active relationship between PatientDim and ProcedureFact (via EncounterFact) to return only the rows for each patient - no explicit FILTER() call required. Both relationships in the chain must be active; RELATEDTABLE does not traverse inactive relationships. If a schema uses role-playing date dimensions - for example, a separate AdmitDateKey and DischargeDateKey both pointing to the same DateDim - one of those relationships will need to be activated inside a USERELATIONSHIP wrapper.
Per-procedure cost across all encounters requires only the base SUMX measure. Placing CPTCode from ProcedureDim on the matrix rows causes SUMX to recalculate independently for each procedure code as the filter context changes:
```dax
Procedure Total Cost =
SUMX(
ProcedureFact,
ProcedureFact[Units] * ProcedureFact[UnitCost]
)
```
Average cost per encounter introduces DIVIDE, which Microsoft's DAX documentation (2025) recommends over the "/" operator because it returns BLANK rather than an error when the denominator is zero - critical for departments with no activity in the selected date range:
```dax
Avg Cost Per Encounter =
DIVIDE(
SUMX(ProcedureFact, ProcedureFact[Units] * ProcedureFact[UnitCost]),
DISTINCTCOUNT(ProcedureFact[EncounterID])
)
```
These three measures form the cost foundation for revenue cycle management dashboards, where they pair with net revenue and contractual adjustment figures to produce department-level margin analysis.
Emergency department cost tracking follows the same patterns, with EncounterFact filtered to ED triage events. Teams building emergency department wait time analytics dashboards often add a duration column in Power Query first - computing minutes from arrival to discharge - before bringing that field into the DAX model for cost-per-minute calculations.
How Does CALCULATE Extend SUMX for Department-Level Cost Aggregation?
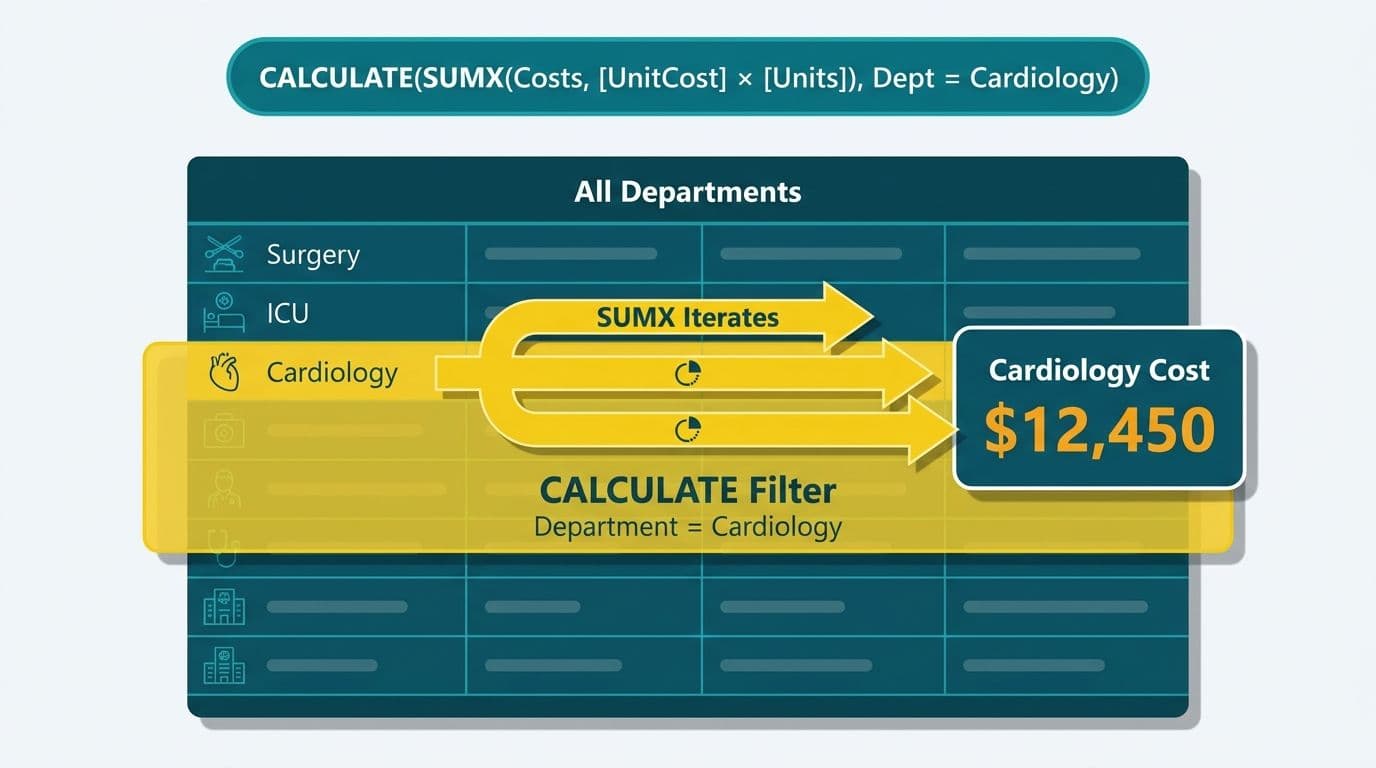
CALCULATE modifies the filter context around any DAX expression - including SUMX. It accepts the base measure as its first argument, followed by one or more filter arguments that override or add to the existing context. Without CALCULATE, SUMX can only aggregate within whatever filter context the report page provides; CALCULATE lets you hard-code filters, compose time-intelligence functions, and compare a department against an all-hospital baseline inside a single measure.
Fixed department filter:
```dax
Cardiology Cost =
CALCULATE(
SUMX(ProcedureFact, ProcedureFact[Units] * ProcedureFact[UnitCost]),
DepartmentDim[DeptName] = "Cardiology"
)
```
Year-to-date cost by department:
```dax
YTD Department Cost =
CALCULATE(
SUMX(ProcedureFact, ProcedureFact[Units] * ProcedureFact[UnitCost]),
DATESYTD(DateDim[Date])
)
```
DATESYTD returns all dates from the start of the year through the last date visible in the current filter context (Microsoft DAX reference, 2025). Wrapping SUMX inside CALCULATE with DATESYTD produces a running YTD cost that updates automatically as the report date slicer changes.
Budget variance:
```dax
Cost vs Budget Variance =
CALCULATE(
SUMX(ProcedureFact, ProcedureFact[Units] * ProcedureFact[UnitCost])
) -
SUMX(BudgetFact, BudgetFact[BudgetedCost])
```
A UK NHS trust using this pattern in its operating cost dashboard can surface departmental overspend against the annual plan - with GDPR-compliant access controls ensuring that patient-level identifiers never appear in the variance visual.
When DepartmentDim connects to multiple fact tables in a more complex hospital schema, filter propagation direction can become a constraint. The article on CROSSFILTER DAX covers how to override relationship direction so that CALCULATE can filter across tables that fall outside the standard star schema propagation path.
SUMX vs SUM in Hospital Data - Which Function Should You Choose?
The choice is determined by whether the extended cost already exists in the data or must be computed at query time.
| Scenario | Use SUM | Use SUMX |
|---|---|---|
| Source stores a validated extended cost column | Yes | No |
| Cost = units x unit rate, varies per line | No | Yes |
| Operating room utilization cost (time x rate) | No | Yes |
| Healthcare supply chain item cost (units x price) | No | Yes |
| Pre-aggregated encounter-level total from ETL | Yes | No |
| Weighted average cost per case mix group | No | Yes |
In practice, US hospital billing systems store charges at the charge master line level, where unit cost and quantity are separate fields. SUMX is the correct function. Healthcare supply chain analytics dashboards face the same situation - items ordered multiplied by purchase price per unit, computed row by row before aggregation.
Using SUM on a pre-aggregated cost column works only if every upstream ETL step calculated and stored the extended cost correctly. SUMX recalculates costs from first principles at query time, catching ETL errors that a SUM would silently accept.
How Do You Govern and Secure a DAX Cost Model Under HIPAA?
Cost data in healthcare is PHI-adjacent. A per-encounter cost record combined with a date and a department can narrow to an individual under HIPAA's minimum necessary standard, which applies to any covered entity or business associate using Power BI in their reporting layer. Governance controls must be built into the initial deployment - retrofitting them after a report reaches production users is significantly more expensive and leaves a gap in the audit record.
Three controls are non-negotiable for HIPAA-regulated cost reporting:
1. Row-level security (RLS) - Define Power BI RLS roles that filter EncounterFact by DeptID based on the authenticated user's department assignment. SUMX then iterates only over the rows that user is permitted to see. A cardiology finance administrator's cost totals will never include orthopedic or surgical encounter data.
2. Sensitivity labels - Tag datasets containing cost data as Confidential using Microsoft Purview. Microsoft's compliance documentation (2025) confirms that sensitivity labels block export to unprotected Excel or CSV formats - closing the most common route for accidental PHI exposure.
3. Audit logging - Enable Power BI activity logs in the Microsoft 365 compliance center. HIPAA requires covered entities to maintain audit trails of access to PHI-adjacent data, and Power BI's audit log captures every dataset query with user identity and timestamp.
Building these three controls into sprint zero of the analytics implementation roadmap is far more efficient than adding them post-launch. US HHS guidance on cloud service providers and HIPAA (HHS, 2025) confirms that covered entities remain responsible for security controls even when analytics run in a vendor-managed cloud environment.
Canadian health systems operating under PIPEDA and provincial health privacy legislation - PHIPA in Ontario and HIA in Alberta - apply equivalent access controls. UK NHS organisations align with the NHS Data Security and Protection Toolkit, which maps to comparable audit and access-control requirements.
The value of fine-grained cost analytics is substantial. When Lets Viz built a financial dashboard for a retreat center, a 600-record sample alone surfaced USD 33,000+ of uncollected balance-due across active bookings - the dashboard paid for itself before it was finished. In a hospital context, the same row-level granularity that uncovers uncollected revenue is precisely what governance controls must protect from unauthorised eyes.
For teams assessing where Power BI fits within a broader deployment, the healthcare analytics platform comparison covers how Power BI cost modelling sits relative to purpose-built clinical analytics tools.
Ready to deploy SUMX-based cost analytics in a HIPAA-compliant Power BI environment? Managed Power BI for healthcare teams covers data model design, DAX measure libraries, RLS configuration, and ongoing governance support for US, UK, and Canadian health systems.
---
About Lets Viz: Lets Viz has been delivering healthcare analytics solutions since 2020, working with US hospitals and health systems, UK fintech firms, Canadian manufacturing operations, and global SaaS companies. With a 5.0 Clutch rating and hands-on expertise in DAX, Power BI governance, and HIPAA-compliant data architecture, the team builds dashboards that are both analytically rigorous and audit-ready.