SUMX Function Power BI Examples: Fix Row-Level DAX Errors
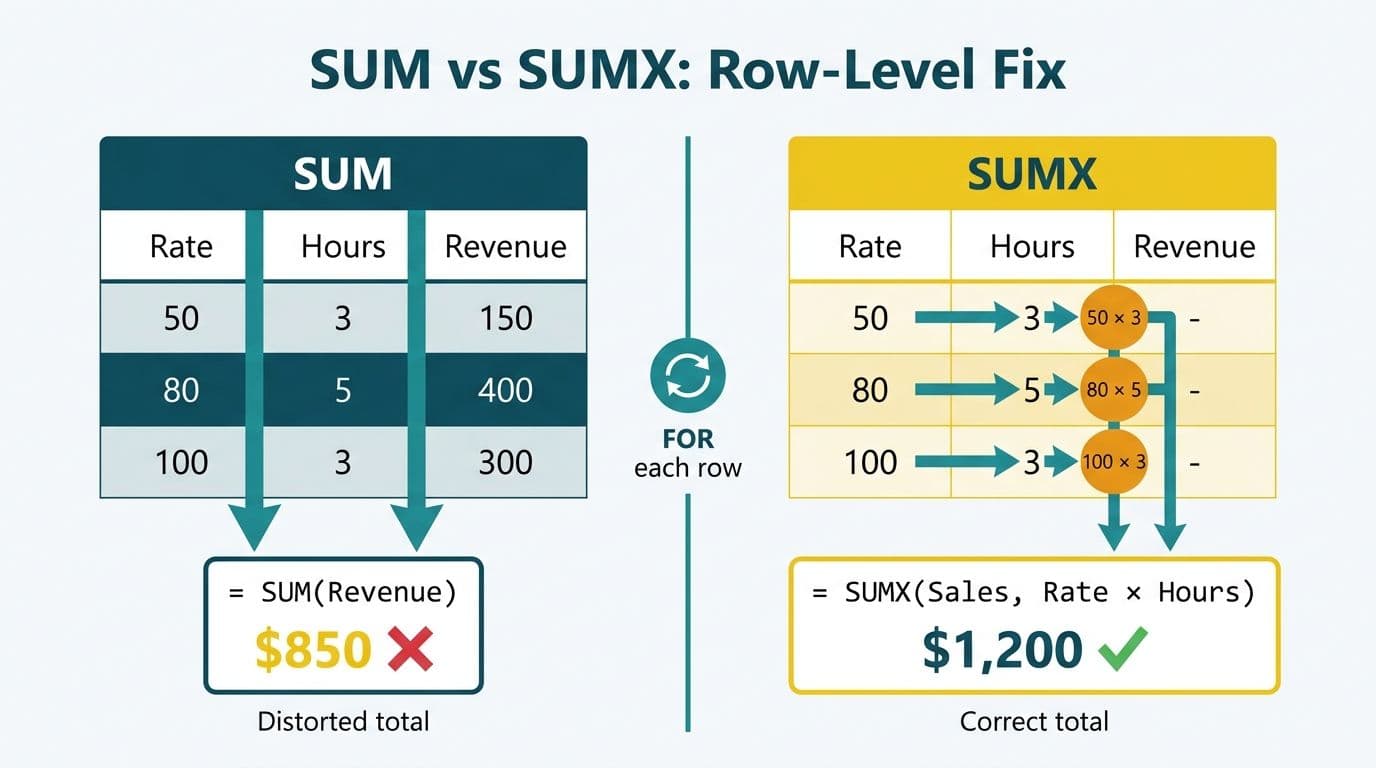
The SUMX function evaluates an expression row by row before summing the results - the key difference from SUM, which aggregates a single column and cannot apply per-row logic. When data requires multiplying two columns (cost x hours, rate x quantity), SUM returns a distorted total. SUMX, AVERAGEX, and MAXX are iterator functions that fix this by working like a FOR loop across your table before aggregating.
Key Takeaways
- SUM adds a column's existing values; SUMX calculates an expression per row first, then sums - these diverge whenever rows carry different rates, costs, or multipliers.
- The iterator pattern (SUMX, AVERAGEX, MAXX) is essential for cost-per-incident, weighted averages, and tiered commission calculations in Power BI.
- IT teams pulling ServiceNow incident data into Power BI routinely encounter the SUM trap when calculating cost-per-incident across ticket priority levels.
- AVERAGEX correctly weights an average by a denominator you control; MAXX returns the highest row-level computed value within the current filter context.
- All three functions share the same two-argument syntax: the table to iterate and the expression to evaluate per row.
Why Does SUM Return Incorrect Row-Level Results in Power BI?
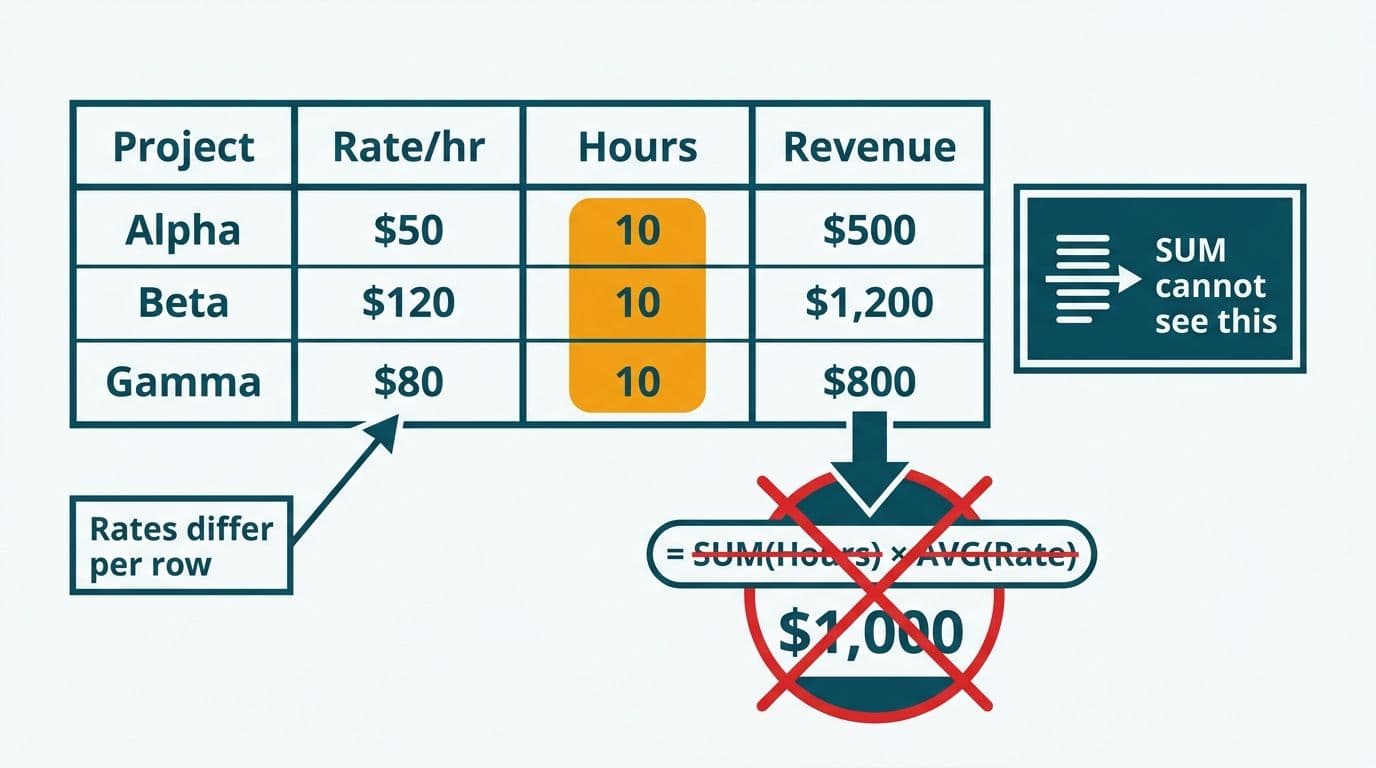
SUM operates on a pre-aggregated column value, not on a per-row calculation. The moment a measure requires multiplying two fields - say, `[TechnicianRate]` x `[ResolutionHours]` - SUM has no mechanism to perform that multiplication row by row. Instead, it either throws a syntax error or, more dangerously, returns a number that looks plausible but is mathematically wrong.
Consider a simplified labour cost table with three rows:
| Employee | HourlyRate | HoursLogged |
|---|---|---|
| Alice | $80 | 10 |
| Bob | $120 | 5 |
| Carol | $95 | 8 |
The correct total is (80x10) + (120x5) + (95x8) = 800 + 600 + 760 = $2,160.
A naive measure `Total Cost = SUM(Table[HourlyRate]) * SUM(Table[HoursLogged])` yields (80+120+95) x (10+5+8) = 295 x 23 = $6,785 - more than three times the correct figure. DAX evaluates both SUM calls across the entire column first, then multiplies the two resulting scalars against each other at the measure level rather than at the row level.
This distortion surfaces immediately in IT operations when ServiceNow incident records are exported to Power BI. If each ticket carries a `TechnicianCostPerHour` and a `ResolutionHours` field, a SUM-based cost measure produces an overstated total whose error grows with rate variance across technician seniority tiers. For US healthcare IT teams, an inflated figure can misrepresent incident costs in board presentations and fail reconciliation when finance auditors compare the Power BI total against ServiceNow's own operational reports.
For data teams exploring ServiceNow + Power BI / Tableau consulting, establishing the iterator function pattern early prevents a class of calculation errors that pass visual inspection but fail audit.
What Is the SUMX Function and How Does It Work?
SUMX takes two arguments - a table and a row-level expression - and evaluates the expression once for every row before summing all results. The syntax is:
```
SUMX(<table>, <expression>)
```
Applied to the labour cost example:
```dax
Total Labour Cost =
SUMX(
LabourTable,
LabourTable[HourlyRate] * LabourTable[HoursLogged]
)
```
Power BI iterates: Row 1 yields 80 x 10 = 800. Row 2 yields 120 x 5 = 600. Row 3 yields 95 x 8 = 760. Final sum: $2,160. Correct.
SUMX respects filter context automatically. When a report user slices by department or date range, SUMX re-evaluates only the visible rows - no CALCULATE wrapper is required for standard slicer interactions. This makes iterator functions well-suited to executive dashboards where finance directors and IT leads change filter selections without understanding the underlying DAX.
SUMX vs a calculated column: A calculated column stores the per-row result permanently in the data model, consuming memory proportional to row count. A SUMX measure computes on demand at query time, keeping the model lean. For large ServiceNow exports - enterprise IT shops routinely work with one to three million incident records per year - SUMX avoids the memory overhead of pre-computing every row's cost product, at the trade-off of slightly longer query times on fully unfiltered views.
When NOT to use SUMX: If your measure simply needs to total a single existing column, SUM is faster and more readable. SUMX adds query overhead because it iterates every row. The performance difference is negligible for small tables but measurable for millions of rows without a filter. Apply SUMX only when the per-row expression is genuinely required.
Using FILTER inside SUMX: When the iteration should exclude certain rows, FILTER acts as the table argument:
```dax
Cost Excl P4 Tickets =
SUMX(
FILTER(Incidents, Incidents[Priority] <> "P4"),
Incidents[TechnicianCostPerHour] * Incidents[ResolutionHours]
)
```
Microsoft Power BI has 30 million monthly active users (Microsoft, via Technology Checker, 2025), and SUMX consistently ranks among the most-searched DAX functions - evidence that the SUM-vs-iterator distinction is a real pain point for analysts migrating from spreadsheet-based reporting.
SUMX Function Power BI Examples: IT Ticket Cost-Per-Incident
This use case applies directly to IT operations teams that route ServiceNow incident data into Power BI - a common architecture for teams comparing ServiceNow ITSM reporting options for enterprise environments.
Scenario: A US healthcare system (HIPAA-governed) tracks 40,000 annual incidents in ServiceNow. Each record contains:
- `Priority` (P1 critical, P2 high, P3 moderate, P4 low)
- `ResolutionHours` (decimal, varies per incident)
- `TechnicianCostPerHour` (varies by seniority tier and on-call premium)
Incorrect measure using SUM:
```dax
Wrong Incident Cost =
SUM(Incidents[TechnicianCostPerHour]) * SUM(Incidents[ResolutionHours])
```
Correct measure using SUMX:
```dax
Total Incident Cost =
SUMX(
Incidents,
Incidents[TechnicianCostPerHour] * Incidents[ResolutionHours]
)
```
Cost-per-incident by priority tier:
```dax
Cost Per Incident =
DIVIDE(
SUMX(
Incidents,
Incidents[TechnicianCostPerHour] * Incidents[ResolutionHours]
),
COUNTROWS(Incidents)
)
```
| Priority | Avg Resolution Hrs | Avg Cost/Hr | SUMX Cost Per Incident |
|---|---|---|---|
| P1 Critical | 4.2 | $145 | $609 |
| P2 High | 6.8 | $110 | $748 |
| P3 Moderate | 12.1 | $85 | $1,029 |
| P4 Low | 18.5 | $70 | $1,295 |
*Figures are illustrative; actual costs depend on your technician tier structure.*
A UK fintech firm running the same ServiceNow-to-Power BI pipeline writes the identical SUMX measure. Under GDPR Article 25 data minimisation requirements, incident records should have employee PII stripped before reaching Power BI - but the DAX pattern itself is jurisdiction-agnostic. A Canadian financial institution subject to PIPEDA applies the same rate x hours structure to produce a cost-per-incident report that finance and IT directors can audit row by row against the source export, satisfying internal governance requirements for compensation and resource cost transparency.
How Do AVERAGEX and MAXX Complete the Iterator Toolkit?
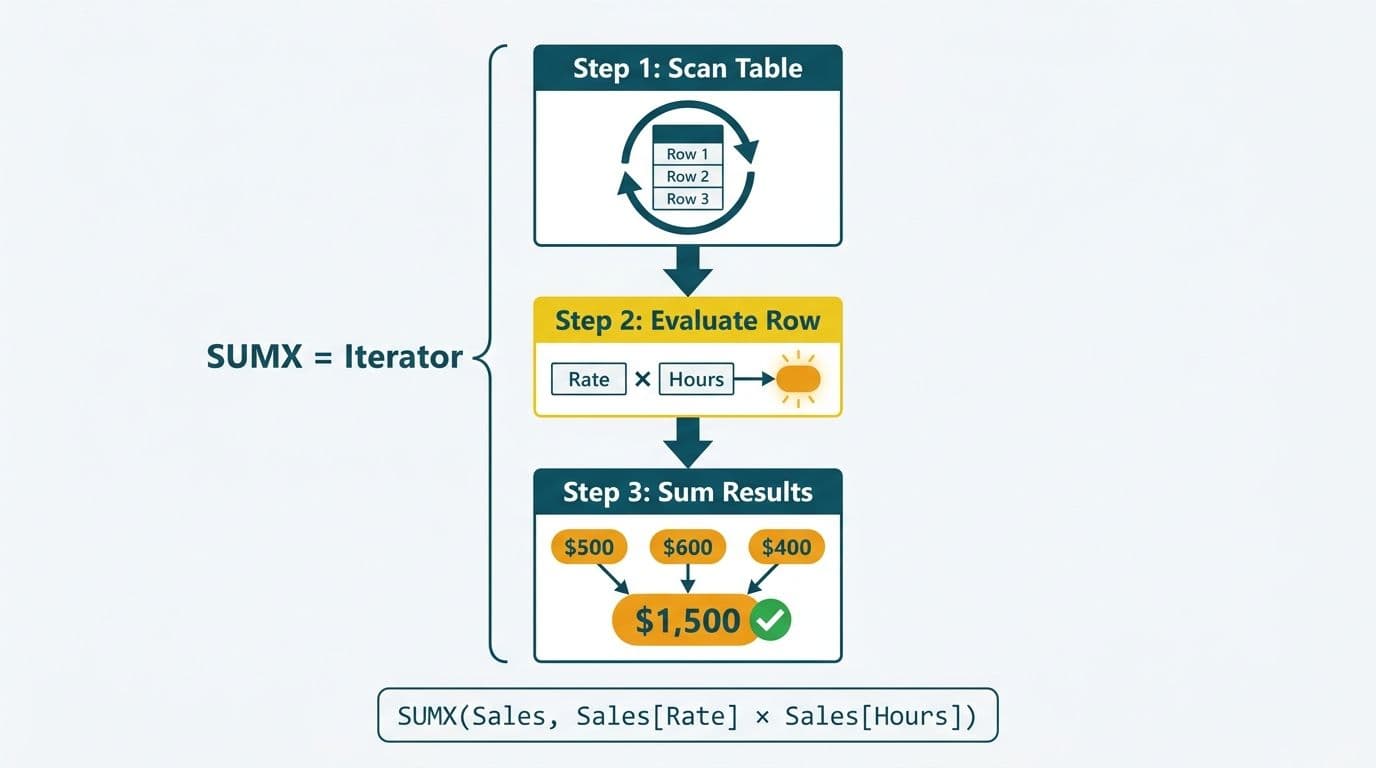
AVERAGEX and MAXX follow the same two-argument pattern as SUMX but return an average or maximum rather than a sum. Understanding all three as a family - iterator functions - makes each one easier to apply correctly.
AVERAGEX - correct weighted averaging:
```dax
Avg Incident Cost =
AVERAGEX(
Incidents,
Incidents[TechnicianCostPerHour] * Incidents[ResolutionHours]
)
```
A common error is using the native `AVERAGE` function on a cost column that is itself the product of two fields. `AVERAGE(Incidents[TechnicianCostPerHour])` averages the hourly rate across all rows, ignoring the fact that each technician worked a different number of hours. AVERAGEX computes actual cost per incident per row first, then averages those per-incident costs - which is what finance directors mean when they ask "what does the average incident cost us?"
MAXX - highest row-level computed value:
```dax
Most Expensive Incident =
MAXX(
Incidents,
Incidents[TechnicianCostPerHour] * Incidents[ResolutionHours]
)
```
`MAX(Incidents[TechnicianCostPerHour])` returns the highest hourly rate - not the highest total incident cost. MAXX surfaces the single most expensive incident in the current filter context, which is what an operations manager needs to identify for post-incident review.
A Canadian manufacturing company subject to PIPEDA applying the same iterator pattern on ERP work-order data can use MAXX to identify the single costliest maintenance event per quarter - essential for finance directors setting maintenance reserve budgets and justifying capital allocation to the board.
Summary comparison:
| Function | Iterates Rows? | Returns | Best Use Case |
|---|---|---|---|
| SUM | No | Column total | Simple additive columns |
| SUMX | Yes | Sum of row expressions | Rate x quantity, cost products |
| AVERAGEX | Yes | Average of row expressions | Weighted averages across unequal rows |
| MAXX | Yes | Max of row expressions | Highest computed value per filter context |
| MINX | Yes | Min of row expressions | Lowest computed value per filter context |
Our Power BI vs Tableau TCO breakdown examines where each platform's aggregation approach affects total cost of ownership for mid-market teams making a ServiceNow BI tool comparison.
Sales Commission Use Case: SUM vs SUMX in DAX
The tiered commission calculation is the clearest finance-side demonstration of why iterator functions are irreplaceable.
Scenario: A US SaaS finance team runs a tiered commission structure - 5% on the first $10,000 of each deal, 8% on any amount above $10,000. SUM cannot apply this threshold per deal because it works only on the aggregated value. SUMX evaluates the conditional logic per row before summing:
```dax
Total Commission =
SUMX(
SalesDeals,
IF(
SalesDeals[DealValue] <= 10000,
SalesDeals[DealValue] * 0.05,
(10000 * 0.05) + ((SalesDeals[DealValue] - 10000) * 0.08)
)
)
```
Three-deal side-by-side comparison:
| Rep | Deal Value | SUMX Commission (Correct) | Flat SUM x 8% (Wrong) |
|---|---|---|---|
| Davis | $8,000 | $400 | $640 |
| Patel | $15,000 | $900 | $1,200 |
| O'Brien | $22,000 | $1,460 | $1,760 |
| **Total** | **$45,000** | **$2,760** | **$3,600** |
*Commission rates and thresholds are illustrative.*
The $840 gap between correct and incorrect totals on a three-person sample becomes material at 50 or 500 sales reps. A UK fintech firm calculating FCA-compliant variable compensation reports needs this same SUMX approach because regulatory auditors may request line-by-line reconciliation. SUMX produces an auditable per-deal calculation that traces directly back to source records, unlike a flat-rate SUM that obscures the tier logic. Finance directors at mid-market organisations - whether operating under SOC 2 (US), GDPR (UK/EU), or PIPEDA (Canada) - should validate commission DAX against a controlled test dataset before connecting the model to payroll systems.
For broader compensation and finance model design, the Power BI for accounting and finance firms guide covers row-level security patterns that restrict commission visibility to the appropriate finance executive roles.
When Should You Use SUMX with ServiceNow Data in Power BI?
SUMX is the right choice whenever ServiceNow data exports contain two or more numeric fields that must be combined per row before aggregating. Common scenarios where SUMX is essential:
- Cost-per-incident: resolution hours x technician hourly rate
- SLA penalty exposure: breach duration x contractual penalty rate per SLA tier
- Change risk scoring: probability score x business impact score per change record
- Asset depreciation cost: asset value x depreciation rate x asset age in years
Teams running a ServiceNow BI tool comparison for enterprise IT should note that ServiceNow's native Performance Analytics module computes these products server-side before surfacing pre-calculated metrics. When data is exported to Power BI via OData feed, scheduled CSV, or a middleware connector - as is standard in ServiceNow + Power BI / Tableau consulting implementations - the raw numeric fields arrive unaggregated. The row-level calculation must be reconstructed in DAX using SUMX. This is why analysts who move from ServiceNow Performance Analytics to Power BI without DAX training often produce reports that look correct at the summary level but are wrong when filtered by department, priority, or date range.
For teams also evaluating a ServiceNow Tableau integration, the same principle applies: Tableau uses LOD expressions and table calculations where Power BI uses SUMX, but the row-level logic must be re-expressed in the destination tool's native language regardless of platform choice.
Performance at scale: When a ServiceNow dataset exceeds one million rows, applying SUMX to an unfiltered table slows query time noticeably. The recommended pattern wraps a date filter as the outer table argument:
```dax
YTD Incident Cost =
SUMX(
FILTER(
Incidents,
Incidents[ResolvedDate] >= DATE(YEAR(TODAY()), 1, 1)
),
Incidents[TechnicianCostPerHour] * Incidents[ResolutionHours]
)
```
This keeps the iterator's working set manageable without sacrificing the row-level accuracy that SUMX provides.
For healthcare IT teams where ServiceNow incident records may touch PHI-adjacent fields - such as EHR system outages or patient-care-affecting downtime events - the Power BI healthcare reporting implementation guide details the access controls that should govern which fields are exported and who can view row-level cost data in Power BI reports under HIPAA requirements.
---
About Lets Viz: Lets Viz has delivered Power BI, Tableau, and ServiceNow analytics implementations for US healthcare systems, UK fintech firms, Canadian manufacturing companies, and global SaaS businesses since 2020. The practice holds a 5.0 Clutch rating and specialises in mid-market data teams that need production-grade DAX, governed data models, and analyst-ready dashboards without enterprise-level overhead.
If your team needs row-level DAX that correctly mirrors ServiceNow's cost logic in Power BI - or a full implementation from data export to live executive dashboard - explore our ServiceNow + Power BI / Tableau consulting to see how we structure these engagements.