Healthcare Revenue Cycle Analytics Dashboard: A Practical Guide
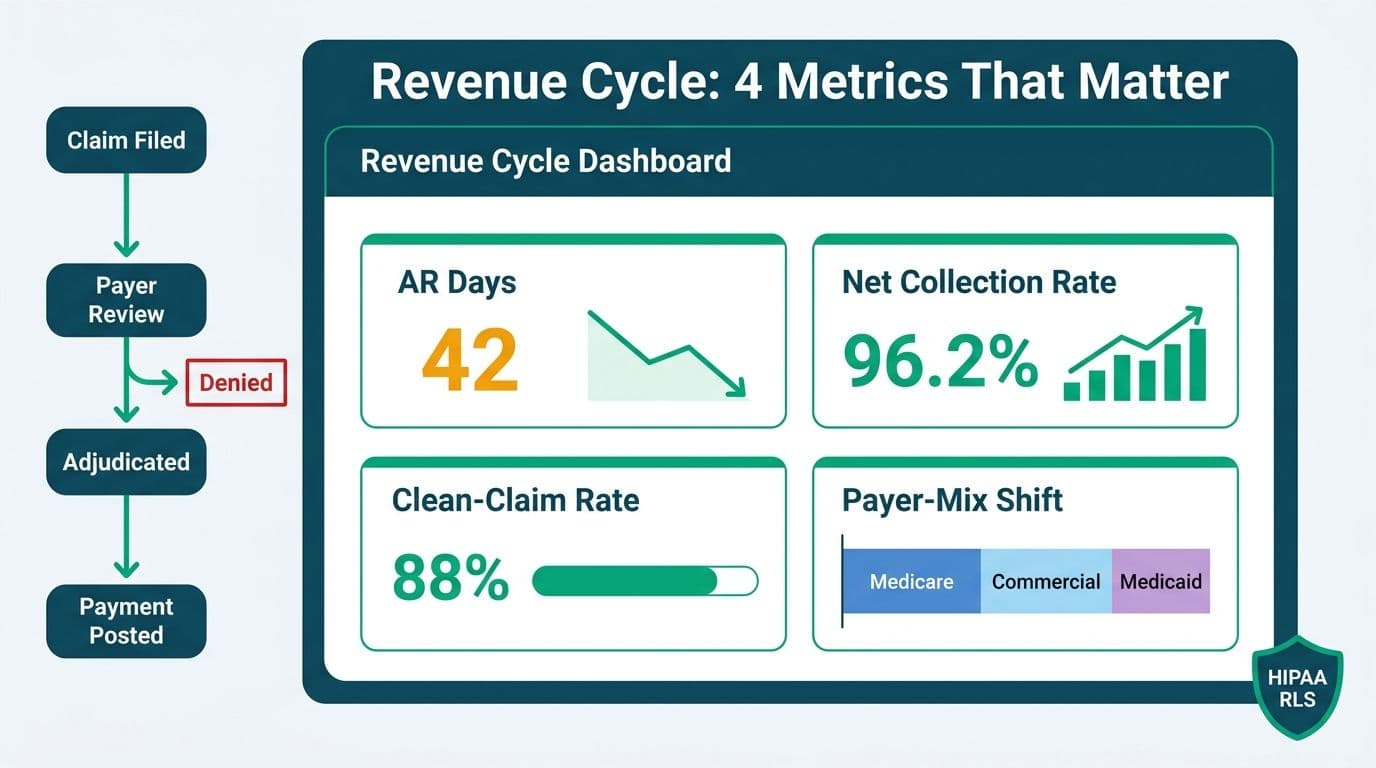
A healthcare revenue cycle analytics dashboard consolidates claim, payer, and patient financial data into a single operational view - so administrators can spot cash-flow bottlenecks before they become write-offs. Beyond denial rate, four metrics drive real performance: AR days, net collection rate, clean-claim rate, and payer-mix shift. A Power BI star schema ties them together; HIPAA-compliant row-level security makes the result audit-ready.
Key Takeaways
- AR days, net collection rate, clean-claim rate, and payer-mix shift reveal upstream revenue risks that denial rate alone misses.
- A star schema separates claim facts from payer, provider, date, and denial-reason dimensions - keeping DAX measures simple and queries fast.
- The DAX `SWITCH` function eliminates nested `IF` chains for payer-tier logic and reimbursement-target calculations.
- HIPAA (US), UK GDPR, and PIPEDA (Canada) each impose distinct access-control and retention obligations on health data stored in a BI platform.
- Managed analytics services for healthcare reduce EHR integration complexity and ongoing compliance overhead compared to solo in-house builds.
What RCM Metrics Should Your Healthcare Revenue Cycle Analytics Dashboard Track?
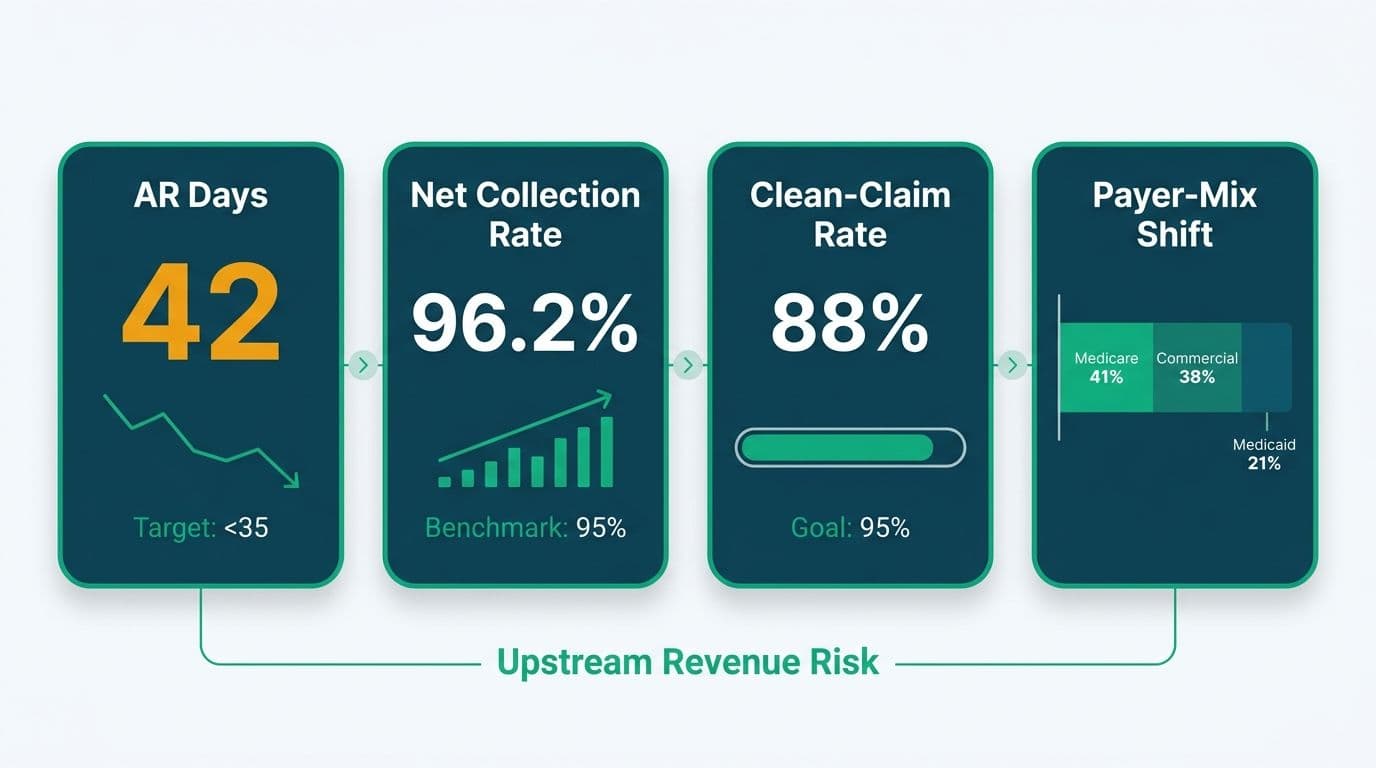
Denial rate is a lagging indicator - by the time a claim is denied, revenue has already been delayed 30 to 90 days. The metrics that surface upstream problems earlier are:
AR Days (Days in Accounts Receivable) measures the average time from service date to payment receipt. A hospital system typically targets fewer than 40 days; a specialty practice may aim for 25 or fewer. Rising AR days signal payer-side slowdowns or documentation gaps before denials appear in the data.
Net Collection Rate (NCR) is the percentage of collectible revenue - after contractual adjustments - that is actually collected. A rate below 95% points to write-off over-use or a leakage point in the collection workflow.
Clean-Claim Rate is the share of claims accepted by the payer on first submission without errors. Every rejected first-pass claim adds 15 to 30 days to the collection cycle and triggers manual rework costs.
Payer-Mix Shift tracks the changing proportion of charges by payer category (Medicare, Medicaid, commercial, self-pay). A shift toward lower-reimbursing payers compresses margins even when denial rate holds steady - a risk that surfaces only when payer mix is trended against reimbursement rates in the same dashboard view.
| Metric | Benchmark | Signal Type | Primary Risk |
|---|---|---|---|
| Denial Rate | < 5% | Lagging | Coding or eligibility errors |
| AR Days | < 40 (hospital), < 25 (specialty) | Leading | Payer delays, documentation gaps |
| Net Collection Rate | > 95% | Lagging | Write-off leakage |
| Clean-Claim Rate | > 95% | Leading | First-pass submission errors |
| Payer-Mix Shift | Track weekly | Leading | Margin compression |
For teams building this capability across multiple facilities, Managed Power BI for healthcare teams covers the full path from EHR connectors and payer file ingestion to published, governed dashboards.
ACO Shared Savings and Telehealth: Extending the RCM View
For organizations operating under Accountable Care Organization (ACO) contracts, an ACO shared savings performance analytics layer sits above standard fee-for-service RCM. The key additions are cost-per-member-per-month (PMPM), quality measure attainment rates, and total cost of care benchmarks against the attributed population - all requiring a bridge table linking claims to attribution rosters.
Telehealth analytics dashboard metrics need separate treatment in the data model. Telehealth visits carry distinct CPT codes (such as 99213 with modifier 95 or GT), different payer reimbursement policies, and place-of-service codes that affect allowed amounts. Tracking telehealth denial rate separately from in-person claims prevents blended metrics from masking reimbursement gaps unique to virtual care.
How Does a Star-Schema Power BI Data Model Organize RCM Data?
A star schema places a central fact table at the middle of the model, surrounded by dimension tables that describe who, what, when, and where. Each dimension connects to the fact table through a single foreign key, keeping DAX measure evaluation paths unambiguous and query performance predictable at multi-million-row scale.
FactClaim (central fact table):
| Column | Type | Description |
|---|---|---|
| ClaimID | Integer (PK) | Surrogate key |
| PatientKey | Integer (FK) | Links to DimPatient |
| ProviderKey | Integer (FK) | Links to DimProvider |
| PayerKey | Integer (FK) | Links to DimPayer |
| ServiceDateKey | Integer (FK) | Links to DimDate (YYYYMMDD) |
| BilledAmount | Decimal | Gross charge submitted |
| AllowedAmount | Decimal | Contract-allowed amount |
| PaidAmount | Decimal | Actual payment received |
| AdjustmentAmount | Decimal | Contractual write-off |
| DenialCode | Varchar | ANSI X12 adjustment reason code |
| ClaimStatus | Varchar | Paid / Denied / Pending |
Surrounding dimension tables:
- DimPayer: PayerName, PayerTier (Medicare / Medicaid / Commercial / Self-Pay), ContractType, ReimbursementRate
- DimProvider: ProviderName, Specialty, Department, FacilityID, NPI
- DimPatient: PatientID (de-identified), InsuranceClass, ZipCode3 (first three digits only per HIPAA Safe Harbor)
- DimDate: Date, Month, Quarter, FiscalYear, WeekNumber
- DimDenialReason: DenialCode, DenialCategory (Clinical / Administrative / Coding), AppealEligible flag
The five-dimension star covers the vast majority of standard RCM reporting without requiring a snowflake extension. For organizations exploring Power BI's Model Context Protocol (MCP) integrations - which allow AI agents to query the semantic model in natural language - a well-labeled star schema with clear measure descriptions produces significantly more accurate responses than a normalized relational layout would.
A US hospital system storing this model in Azure Synapse Analytics operates under a HIPAA Business Associate Agreement (BAA) with Microsoft. A UK NHS trust applying the same schema must satisfy UK GDPR Article 9 controls for special-category health data. A Canadian regional health authority adds PIPEDA consent-flag attributes in DimPatient and may additionally need to satisfy provincial health information acts - PHIPA in Ontario, HIA in Alberta.
Workspace governance and model versioning practices are covered in the Power BI Governance Best Practices: 12-Point Checklist.
How Do You Write DAX SWITCH Measures for Healthcare RCM Reporting?
The `SWITCH` function is the cleanest route to payer-tier logic without stacking nested `IF` statements. Two patterns cover most healthcare RCM scenarios.
Net Collection Rate - foundation measure for all variance analysis:
```dax
Net Collection Rate =
DIVIDE(
SUM(FactClaim[PaidAmount]),
SUM(FactClaim[BilledAmount]) - SUM(FactClaim[AdjustmentAmount])
)
```
AR Days - outstanding pending balance divided by average daily charges:
```dax
AR Days =
VAR OutstandingAR =
CALCULATE(
SUM(FactClaim[BilledAmount])
- SUM(FactClaim[PaidAmount])
- SUM(FactClaim[AdjustmentAmount]),
FactClaim[ClaimStatus] = "Pending"
)
VAR DaysInPeriod =
DATEDIFF(MIN(DimDate[Date]), MAX(DimDate[Date]), DAY)
RETURN
DIVIDE(OutstandingAR, DIVIDE(SUM(FactClaim[BilledAmount]), DaysInPeriod))
```
Reimbursement Target % using SWITCH - matches each payer tier to its contract target, making variance against actuals a single calculated column:
```dax
Reimbursement Target % =
SWITCH(
SELECTEDVALUE(DimPayer[PayerTier]),
"Medicare", 0.80,
"Medicaid", 0.65,
"Commercial", 1.00,
"Self-Pay", 0.40,
0.80
)
```
For rate-banding logic where reimbursement thresholds overlap across commercial contracts, `SWITCH(TRUE(), DimPayer[ReimbursementRate] >= 0.95, "Commercial - High", ...)` evaluates each condition as a Boolean in order - cleaner than an equivalent nested `IF` beyond two conditions.
For teams connecting AI workflow tools to their Power BI semantic layer, How to Connect AI Workflow Automation to Power BI covers the integration steps in detail.
What Compliance Guardrails Must an RCM Dashboard Follow Under HIPAA?
Under HIPAA, a US healthcare revenue cycle analytics dashboard requires five technical controls: a Business Associate Agreement with the cloud provider, row-level security, Safe Harbor de-identification, six-year audit log retention, and encryption at rest and in transit. UK and Canadian organizations operate under parallel but distinct frameworks.
Business Associate Agreement (BAA): Microsoft provides a HIPAA BAA covering Azure, Power BI Premium, and Microsoft Fabric. Standard Power BI Pro workspaces without Premium licensing fall outside BAA scope - verify coverage before storing any PHI.
Row-Level Security (RLS): Define RLS roles in the Power BI data model mapped to Azure Active Directory (Entra ID) groups. Billing staff see only their assigned department; auditors and CFOs see cross-facility aggregates. RLS defined in the dataset applies regardless of which report surface the user accesses.
Safe Harbor De-identification: ZIP codes must be truncated to the first three digits where that prefix covers fewer than 20,000 residents. Exact dates of birth for patients over 89 must be replaced with an age-band attribute. Store these values in DimPatient - never the originals - so de-identification is enforced at the model layer.
Audit Logging: Power BI audit events via Microsoft Purview capture every report view, export, and model refresh. Export these to Azure Log Analytics and retain for at least six years to satisfy HIPAA's minimum record-retention requirement.
Encryption: Azure SQL Database and Synapse Analytics apply Transparent Data Encryption (TDE) at rest by default. Use encrypted gateway connections for on-premises EHR sources.
UK NHS trusts must additionally satisfy UK GDPR Article 9, which classifies health data as a special category. The typical lawful basis is Article 9(2)(h) - health or social care purposes - supported by Schedule 1 conditions under the UK Data Protection Act 2018. Canadian health authorities face dual obligations: PIPEDA federally and provincial acts (PHIPA in Ontario, HIA in Alberta) that impose patient consent rights absent from HIPAA's administrative-notice model.
The ServiceNow ITSM for Healthcare IT Teams: HIPAA, GDPR & PIPEDA article maps each regulation's audit, access control, and breach notification requirements side by side.
Healthcare Analytics Outsourcing vs In-House: Where the Real Costs Hide
The build-versus-buy decision for a healthcare revenue cycle analytics dashboard is rarely about licensing. Internal builds consistently underestimate three cost centers.
EHR Integration Complexity: Epic, Oracle Health, and Meditech export claims data in proprietary formats that change with each version upgrade. Building ETL pipelines across eligibility, billing, EHR, and payer portal sources adds significant overhead to initial estimates once schema drift and payer file-format changes are included.
Compliance Configuration: Correctly configuring BAAs, RLS roles, Safe Harbor de-identification logic, and audit-log retention requires expertise at the intersection of Power BI engineering and healthcare compliance - a combination expensive to hire for and rarely co-located in a single in-house resource.
Ongoing Maintenance Drag: CPT code sets update annually. ICD-10 codes change periodically. Payer contracts renegotiate on their own schedules. A dashboard built in Q1 can develop silent metric drift by Q3. The risk is not theoretical: during a revenue reconciliation project in field services, a date-filter bug had quietly excluded 175 invoices from reporting joins across 9,500 total records. The error was invisible until a full-scan audit surfaced it. In RCM terms, an equivalent claim-drop bug would mean systematically understating AR days and overstating net collection rate until a payer audit forced a correction.
A managed analytics service for healthcare providers shifts that maintenance burden to a team that tracks payer-format changes, annual code-set updates, and Power BI platform releases as part of a standing engagement - converting unpredictable internal overhead into a predictable monthly cost.
For a granular breakdown of implementation line items by project phase, the Power BI Healthcare Reporting: Implementation Cost Guide provides detailed estimates.
---
About Lets Viz: Lets Viz has delivered data analytics and Power BI solutions for US healthcare providers, UK fintech firms, Canadian manufacturing companies, and global SaaS businesses since 2020. The team holds a 5.0 Clutch rating and specializes in governed, HIPAA-aligned dashboards that connect directly to EHR, billing, and payer data sources.
Ready to build a healthcare revenue cycle analytics dashboard that is compliant, maintainable, and connected to your real claim data? Managed Power BI for healthcare teams covers EHR integration, HIPAA row-level security configuration, and ongoing metric maintenance in a single engagement.