Hospital Supply Chain Analytics Dashboard: Visual Guide
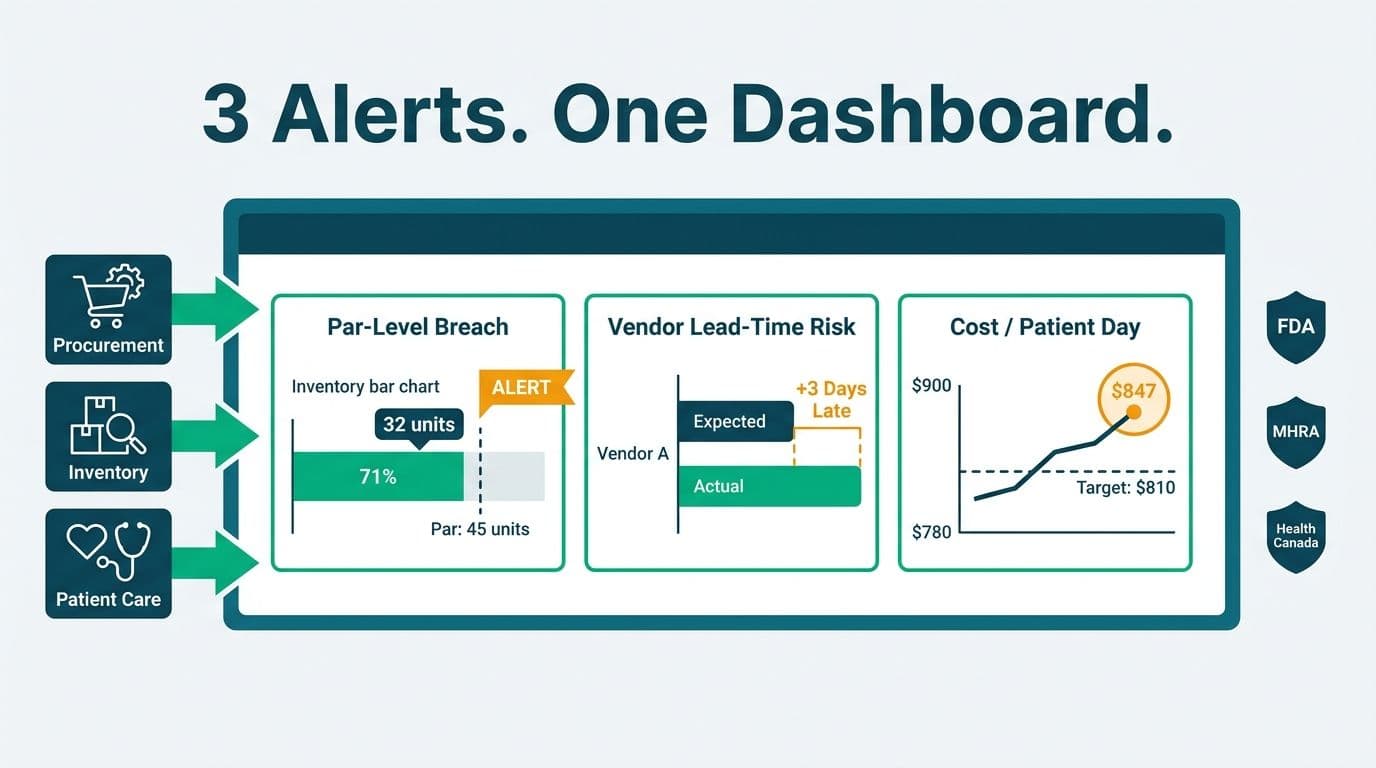
A hospital supply chain analytics dashboard consolidates procurement data, inventory levels, and vendor performance into a single real-time view, enabling supply chain managers to act before a critical item runs out or a vendor misses a delivery window. Built correctly, it automates three high-stakes alerts - par-level breaches, vendor lead-time risk, and cost-per-patient-day drift - with the compliance controls required by FDA, MHRA, and Health Canada.
Key Takeaways
- A hospital supply chain analytics dashboard should surface three core alert types: par-level breaches, vendor lead-time risk, and cost-per-patient-day.
- Power BI's DirectQuery mode supports near-real-time inventory visibility without duplicating sensitive patient data outside the source system.
- FDA 21 CFR Part 11, MHRA MDR 2002, and Health Canada Medical Device Regulations each require audit trails and device traceability that the dashboard architecture must support.
- A phased healthcare analytics implementation roadmap - inventory first, then vendor performance, then financial integration - surfaces data quality issues before they compound.
- HIPAA's minimum necessary standard (45 CFR §164.502) applies wherever ADT census data feeds into cost-per-patient-day calculations.
What Is a Hospital Supply Chain Analytics Dashboard?
A hospital supply chain analytics dashboard is a visual intelligence layer over a hospital's procurement, inventory, and vendor management systems. It translates raw purchase orders, stock counts, and delivery records into actionable signals for supply chain coordinators, CFOs, and clinical operations leads.
For teams that want this built and maintained without adding internal BI headcount, Managed Power BI for healthcare teams covers the end-to-end engagement - from ERP data modelling and DAX development to compliance controls and ongoing dashboard maintenance.
The three signals that drive the most value are:
- Par-level breach alerts - flags when on-hand stock drops below the reorder threshold for a given item, triggering a purchase order before the item runs out.
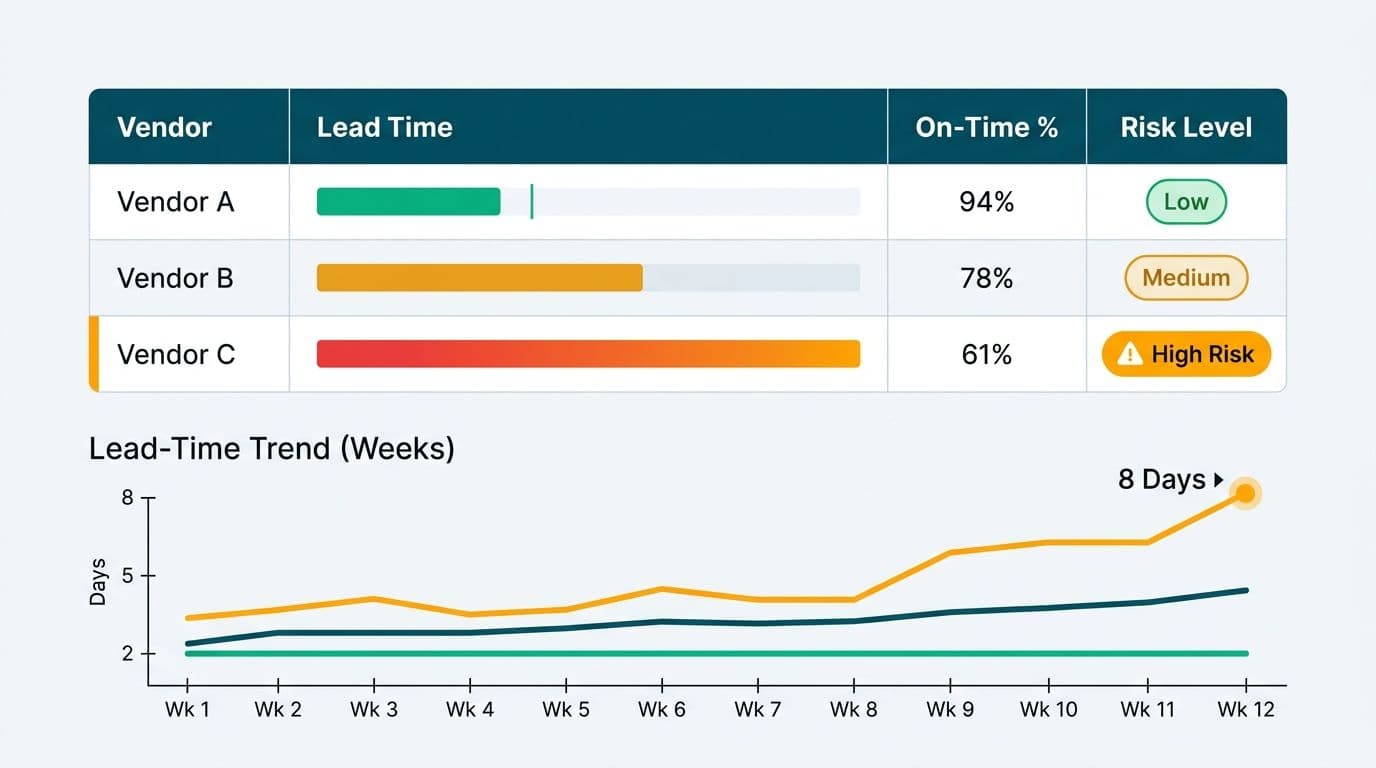
- Vendor lead-time risk scores - compare a supplier's historical delivery window against open orders to predict a late delivery before it disrupts clinical operations.
- Cost-per-patient-day - tracks total supply cost allocated to each patient day, the core efficiency metric in hospital benchmarking and value-based care reporting.
Teams building this in Power BI typically connect it to their ERP system (Oracle Health Supply Chain, Infor, SAP, or Meditech) and, where usage is clinically linked, to their EHR via HL7 FHIR API. The Connect EHR Data to Power BI: Epic, Cerner & FHIR Guide covers the authentication and resource-mapping steps for that FHIR connection in practical detail.
What Metrics Should a Healthcare Supply Chain Analytics Dashboard Track?
The dashboard should span three layers: inventory status, vendor performance, and financial efficiency. The table below is a reference set for a well-designed hospital supply chain analytics dashboard.
| Layer | Metric | Alert Condition | Typical Data Source |
|---|---|---|---|
| Inventory | On-hand quantity vs. par level | On-hand quantity below par level | ERP / WMS |
| Inventory | Days of inventory on hand | Below 3 days for critical items | ERP |
| Inventory | Expiry risk | Expiry date within 30 days | ERP |
| Vendor | Lead time actual vs. contracted | Actual exceeds contracted by more than 2 days | Purchase order / EDI |
| Vendor | On-time delivery rate (rolling 90-day) | Below 90% for primary vendors | ERP / EDI |
| Vendor | Single-source dependency flag | 100% of an item sourced from one vendor | ERP |
| Financial | Cost-per-patient-day by department | More than 5% above 90-day rolling average | ERP + ADT feed |
| Financial | Purchase price variance | Actual unit price exceeds contracted price | ERP + contract management |
| Financial | Emergency purchase premium | Percentage of orders placed at spot price | ERP |
Operating room supply layer: Many hospitals extend the dashboard with a procedure-level view that links supply consumption to case types. This pairs naturally with Revenue Cycle Management Dashboard Metrics, because over-stocked instrument trays become visible only when supply data aligns with actual surgical case mix.
How Do You Build a Hospital Supply Chain Analytics Dashboard in Power BI?
Building the dashboard follows four phases: connect, model, visualise, and govern.
Phase 1: Connect Your Data Sources
The core connections are:
- ERP system - purchase orders, inventory counts, and vendor master. Most healthcare ERPs support ODBC, OData, or REST export. Use DirectQuery for real-time inventory visibility; use Import mode for historical financial analysis where query performance matters more than latency.
- EDI (Electronic Data Interchange) feed - for vendor advance ship notices (ASNs). ASN data is the earliest reliable signal for lead-time risk, arriving before the item ships and before any delay becomes operational.
- ADT (Admission-Discharge-Transfer) feed - for patient census counts needed in cost-per-patient-day. US hospitals typically expose ADT data as HL7 v2 or FHIR R4 feeds; UK NHS Trusts source the same data from their Patient Administration System (PAS).
- Contract management system - for contracted unit prices, needed to compute purchase price variance and identify maverick spend against negotiated rates.
Phase 2: Build the Star Schema
The central fact table is FactPurchaseOrder with columns for item key, vendor key, order date, expected delivery date, actual delivery date, quantity ordered, quantity received, and unit cost. Dimension tables include DimItem (par level, criticality tier, expiry tracking), DimVendor (contracted lead time, primary vs. backup flag), DimDepartment, and DimDate.
The par level for each item should live in DimItem, not hard-coded in a DAX measure. When supply coordinators update par levels in the source ERP, the dashboard reflects the change on the next scheduled refresh - no BI team involvement required.
Phase 3: Write the Alert Measures in DAX
Two core measures drive the alert logic:
```dax
Par Breach Flag =
VAR OnHand = SUM(FactInventory[OnHandQty])
VAR ParLevel = MAX(DimItem[ParLevel])
RETURN IF(OnHand < ParLevel, "BREACH", "OK")
```
```dax
Lead Time Risk Score =
DIVIDE(
AVERAGE(FactPurchaseOrder[ActualLeadDays]),
MAX(DimVendor[ContractedLeadDays])
)
```
A score above 1.10 triggers an amber alert (actual lead time running 10% above contracted). Above 1.30 triggers red. Store both thresholds in a parameter table so procurement managers can adjust sensitivity without involving the BI team.
Phase 4: Visualise and Alert
Use a matrix visual for the item-level inventory status table, with conditional formatting driven by Par Breach Flag - red rows for breaches, amber for items within 20% of par. Use a scatter chart with lead-time risk score on the x-axis against order value on the y-axis: this immediately identifies which high-value vendors are also highest risk. Use a waterfall chart for cost-per-patient-day variance by department against the 90-day rolling average.
How Should the Dashboard Flag Par-Level Breaches and Vendor Lead-Time Risk?
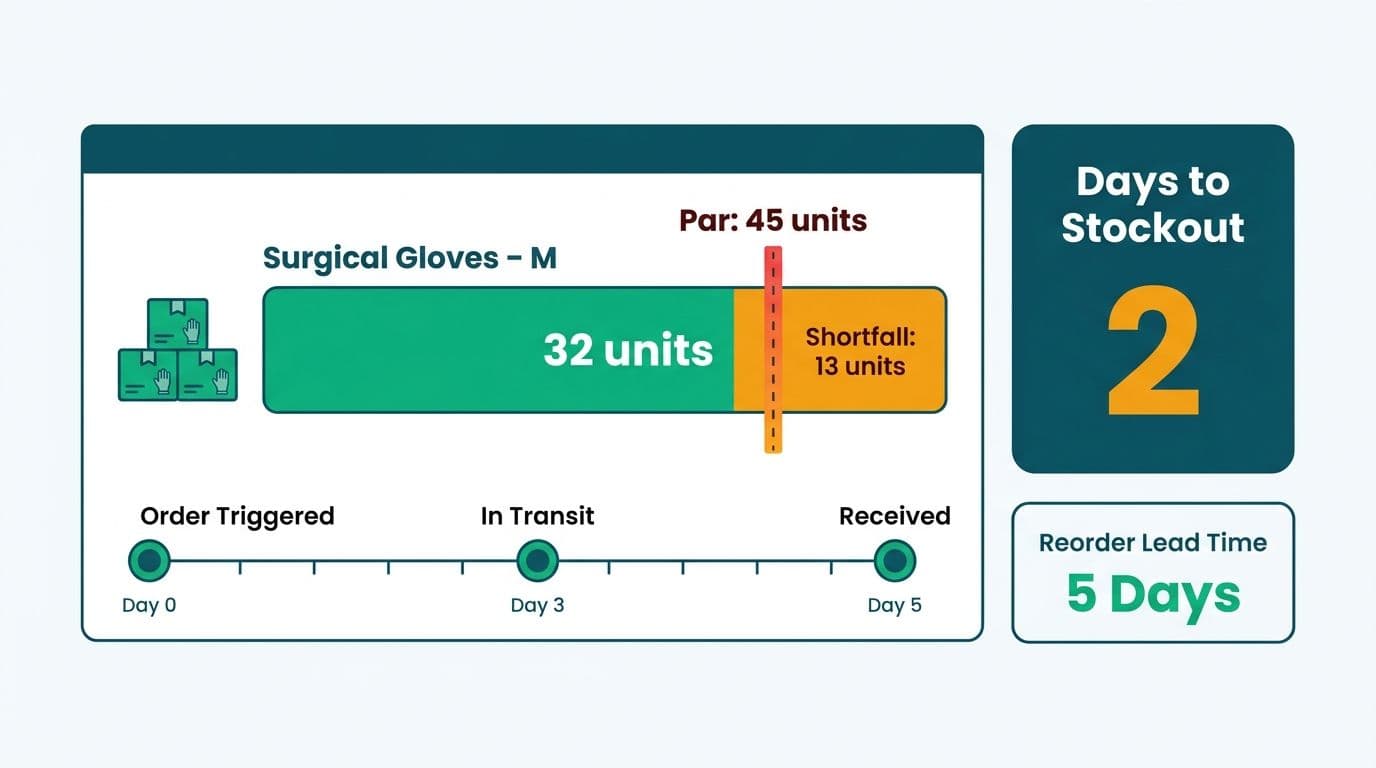
Par-level breach alerts belong on a dedicated Inventory Alert page, sorted by a three-tier criticality classification:
- Critical tier - items on the FDA drug shortage list, blood products, surgical implants, and any item where a stockout carries direct patient safety risk. These always appear at the top of the matrix, regardless of days-of-supply remaining.
- High tier - items with a single vendor and a contracted lead time exceeding seven days, representing concentrated supply risk with limited recovery options.
- Standard tier - all other below-par items, sorted by days-of-supply remaining.
Vendor lead-time risk belongs on a separate Vendor Performance page. The most effective layout is a risk matrix: rolling 90-day on-time delivery rate on the x-axis, share of total supply spend on the y-axis. Vendors in the bottom-left quadrant (low reliability, high spend) require immediate procurement escalation.
A Canadian hospital network, for instance, might set the vendor escalation threshold at a 92% on-time rate - consistent with Health Canada's Medical Devices Regulations (SOR/98-282) expectation for uninterrupted access to Class II through IV devices. Because PIPEDA governs any personal information in the data layer, including patient identifiers in ADT feeds, a Canadian build should enforce row-level security at the department level so staff access only supply data relevant to their unit.
A UK NHS Trust running the same model would map vendor records against MHRA-registered suppliers. Under the MHRA's Medical Devices Regulations 2002 (SI 2002/618, as retained and amended post-Brexit), Trusts must maintain traceability records for Class IIa and above devices. The dashboard's ASN-to-receipt tracking layer can serve directly as that audit record, provided the underlying data is exportable in a tamper-evident format.
What Compliance Rules Apply to a Hospital Supply Chain Analytics Dashboard?
Compliance requirements differ by jurisdiction but converge on two principles: maintain a defensible audit trail for regulated items, and do not expose more patient-linked data than the defined purpose requires.
| Regulation | Jurisdiction | Applies When | Key Dashboard Requirement |
|---|---|---|---|
| FDA 21 CFR Part 11 | US | Dashboard used as electronic record in regulated process | Audit trail, role-based access, system validation documentation |
| FDA UDI (21 CFR Part 830) | US | Dashboard tracks medical device receipts | Capture and store UDI at the line-item level |
| HIPAA Minimum Necessary (45 CFR §164.502) | US | ADT or patient-linked data feeds cost calculations | Aggregate to encounter or department level before entering Power BI |
| MHRA MDR 2002 (SI 2002/618) | UK | Dashboard tracks Class IIa+ medical device supply | Distribution records with lot numbers, tamper-evident export |
| UK GDPR / DPA 2018 | UK | Patient identifiers present in any data layer | Data minimisation (Art. 5(1)(c)); purpose limitation |
| Health Canada SOR/98-282 | Canada | Class II-IV medical device supply tracking | Distribution records: lot number, quantity, and dates |
| PIPEDA | Canada | ADT or patient-identifiable data in cost calculations | Collect only for a purpose a reasonable person considers appropriate |
US teams should confirm that Power BI's data residency configuration aligns with their HIPAA Business Associate Agreement before connecting ADT feeds. The Power BI vs Healthcare Analytics Software Decision Framework provides a structured comparison of how Power BI handles these requirements relative to purpose-built healthcare analytics platforms.
UK teams operating under the NHS Data Security and Protection Toolkit should note that Toolkit requirement 9.4 (data minimisation for business intelligence) aligns directly with UK GDPR Article 5(1)(c). Patient census data should be aggregated at the ADT source system, not post-query in the BI layer.
Canadian teams under PIPEDA should complete a Privacy Impact Assessment before connecting ADT feeds to supply analytics, particularly for cost-per-patient-day metrics where financial data and patient census records intersect.
What Does a Healthcare Analytics Implementation Roadmap Look Like for Supply Chain?
A healthcare analytics implementation roadmap for a hospital supply chain dashboard typically runs across three phases, each building on verified data quality from the previous one.
Phase 1 - Inventory foundation (weeks 1-4): Connect the ERP to Power BI. Build DimItem with par levels, criticality tier, and expiry fields. Deliver the Inventory Alert page with par-level breach flags and days-of-supply remaining. This phase requires no patient data and carries the lowest compliance overhead. It is also where most ERP data quality issues surface first - duplicate item records, missing par level values, and inconsistent unit-of-measure codes are the most common.
Phase 2 - Vendor intelligence (weeks 5-8): Connect the EDI feed and vendor master. Build the Vendor Performance page with lead-time risk scores and rolling on-time delivery rates. Enable the single-source dependency flag. The most common blocker at this phase is incomplete ASN data: many healthcare vendors submit partial advance ship notices, which causes lead-time calculations to undercount actual delays. Validate every vendor record before progressing.
Phase 3 - Financial integration (weeks 9-12): Connect the ADT census feed and contract pricing system. Build cost-per-patient-day measures. Apply row-level security by department. Complete compliance documentation for the relevant jurisdiction - HIPAA BAA confirmation for US builds, MHRA traceability log for UK builds, PIPEDA Privacy Impact Assessment for Canadian builds. Run user acceptance testing with supply chain coordinators and the CFO's office before production go-live.
This approach surfaces data quality problems at each layer before the next is added. It applies to any healthcare analytics platform implementation, not just Power BI: joining unvalidated ERP and ADT records in the financial phase without prior quality checks is the single most common cause of dashboard rework and delayed go-lives.
---
About Lets Viz: Lets Viz has delivered analytics and BI solutions for US healthcare providers, UK fintech firms, Canadian manufacturing companies, and global SaaS businesses since 2020. The team holds a 5.0 Clutch rating and specialises in compliant Power BI implementations built to HIPAA, UK GDPR, and PIPEDA requirements. Healthcare engagements span supply chain, revenue cycle, and population health - always with audit-trail controls and row-level security built in from day one.
If your supply chain team is still chasing par-level breaches across spreadsheets or manually tracking vendor lead times, Managed Power BI for healthcare teams delivers the complete dashboard build - from ERP connection and DAX modelling to compliance documentation and staff enablement.