Looker Studio vs Power BI 2026: Decision-Maker's Guide
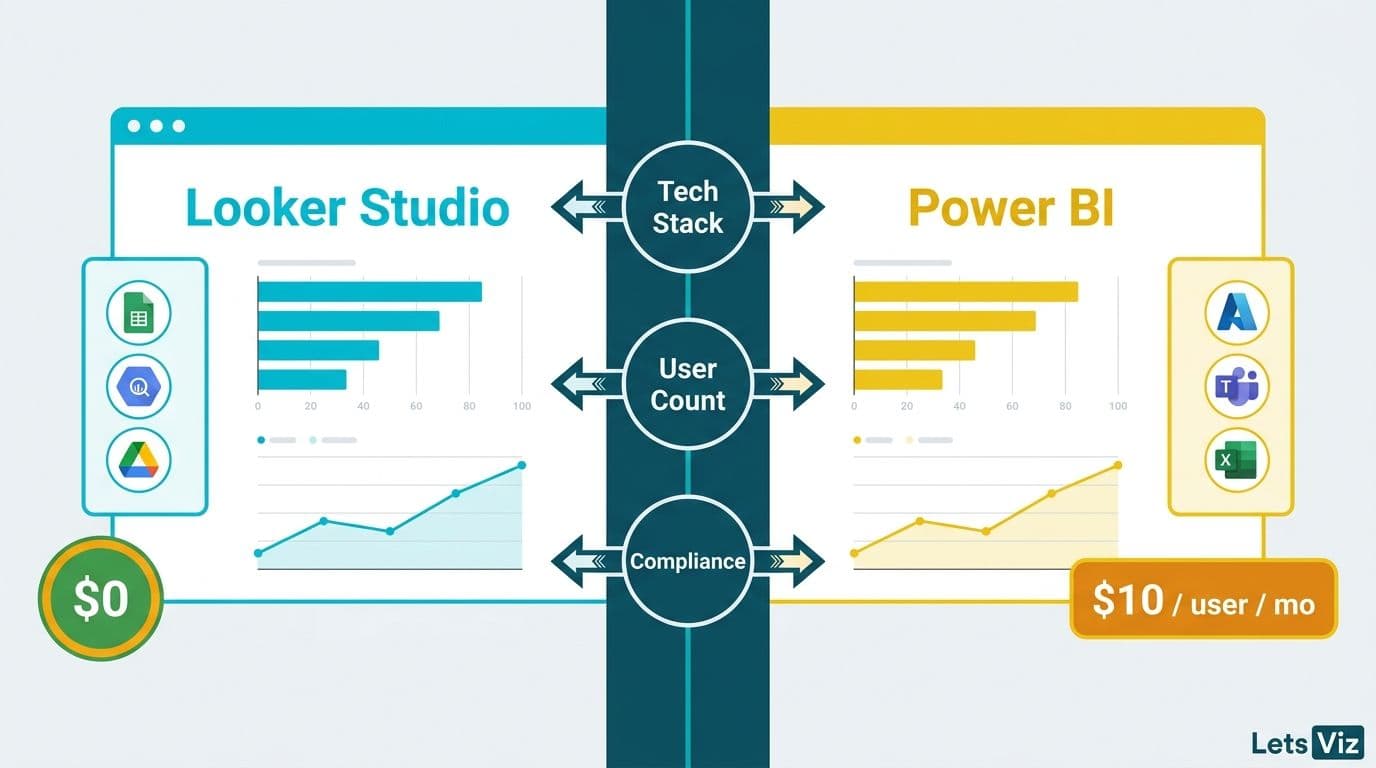
For most mid-market organizations in 2026, Looker Studio wins on cost and Google ecosystem integration, while Power BI wins on enterprise data modeling and Microsoft 365 depth. The right choice turns on three factors: your existing tech stack, the number of licensed users you need, and whether your compliance requirements favor Google Cloud or the Microsoft Azure ecosystem. Neither platform is universally superior - the decision is a matching exercise.
Key Takeaways
Looker Studio is free for unlimited report viewers; Power BI Pro costs $10 per user per month (billed annually)
Power BI connects natively to 100+ enterprise data sources; Looker Studio's native connectors are strongest in the Google ecosystem (GA4, Google Ads, BigQuery, Search Console)
For HIPAA-covered US healthcare organizations, Power BI on Azure has more established BAA documentation, though Looker Studio on Google Cloud also qualifies with proper configuration
For hospital analytics and health-tech teams, Power BI's unified audit logging and built-in Row-Level Security reduce compliance configuration overhead compared to Looker Studio's upstream BigQuery IAM approach
Canadian organizations under PIPEDA and UK teams under GDPR can deploy either platform with correct data residency region selection
Mid-market teams already on Microsoft 365 typically achieve faster ROI with Power BI; Google Workspace organizations get more value from Looker Studio
How Do Looker Studio and Power BI Compare on Cost in 2026?
Cost is where most organizations make their first cut, and the gap is significant.
Looker Studio is free for both report builders and viewers. No per-seat licensing is required for viewers at any scale. Looker Studio Pro, priced at approximately $9 per user per month, adds enhanced team management and SLA-backed support, but most mid-market teams operate entirely on the free tier.
Power BI is licensed per user at $10 per month for Pro - required for colleagues to view reports published to the Power BI Service - and $20 per month for Power BI Premium Per User, which unlocks larger dataset limits, higher data refresh frequencies, and paginated reports. At 50 to 500 seats, the total cost of ownership gap becomes a material budget line. Our Certified Looker Studio consulting team regularly models this comparison for clients and finds that Google Workspace organizations typically save 30-40% on BI licensing compared to equivalent Power BI Pro deployments. For a detailed seat-by-seat breakdown, see our Looker vs Power BI Cost Comparison: TCO at 50-500 Seats.
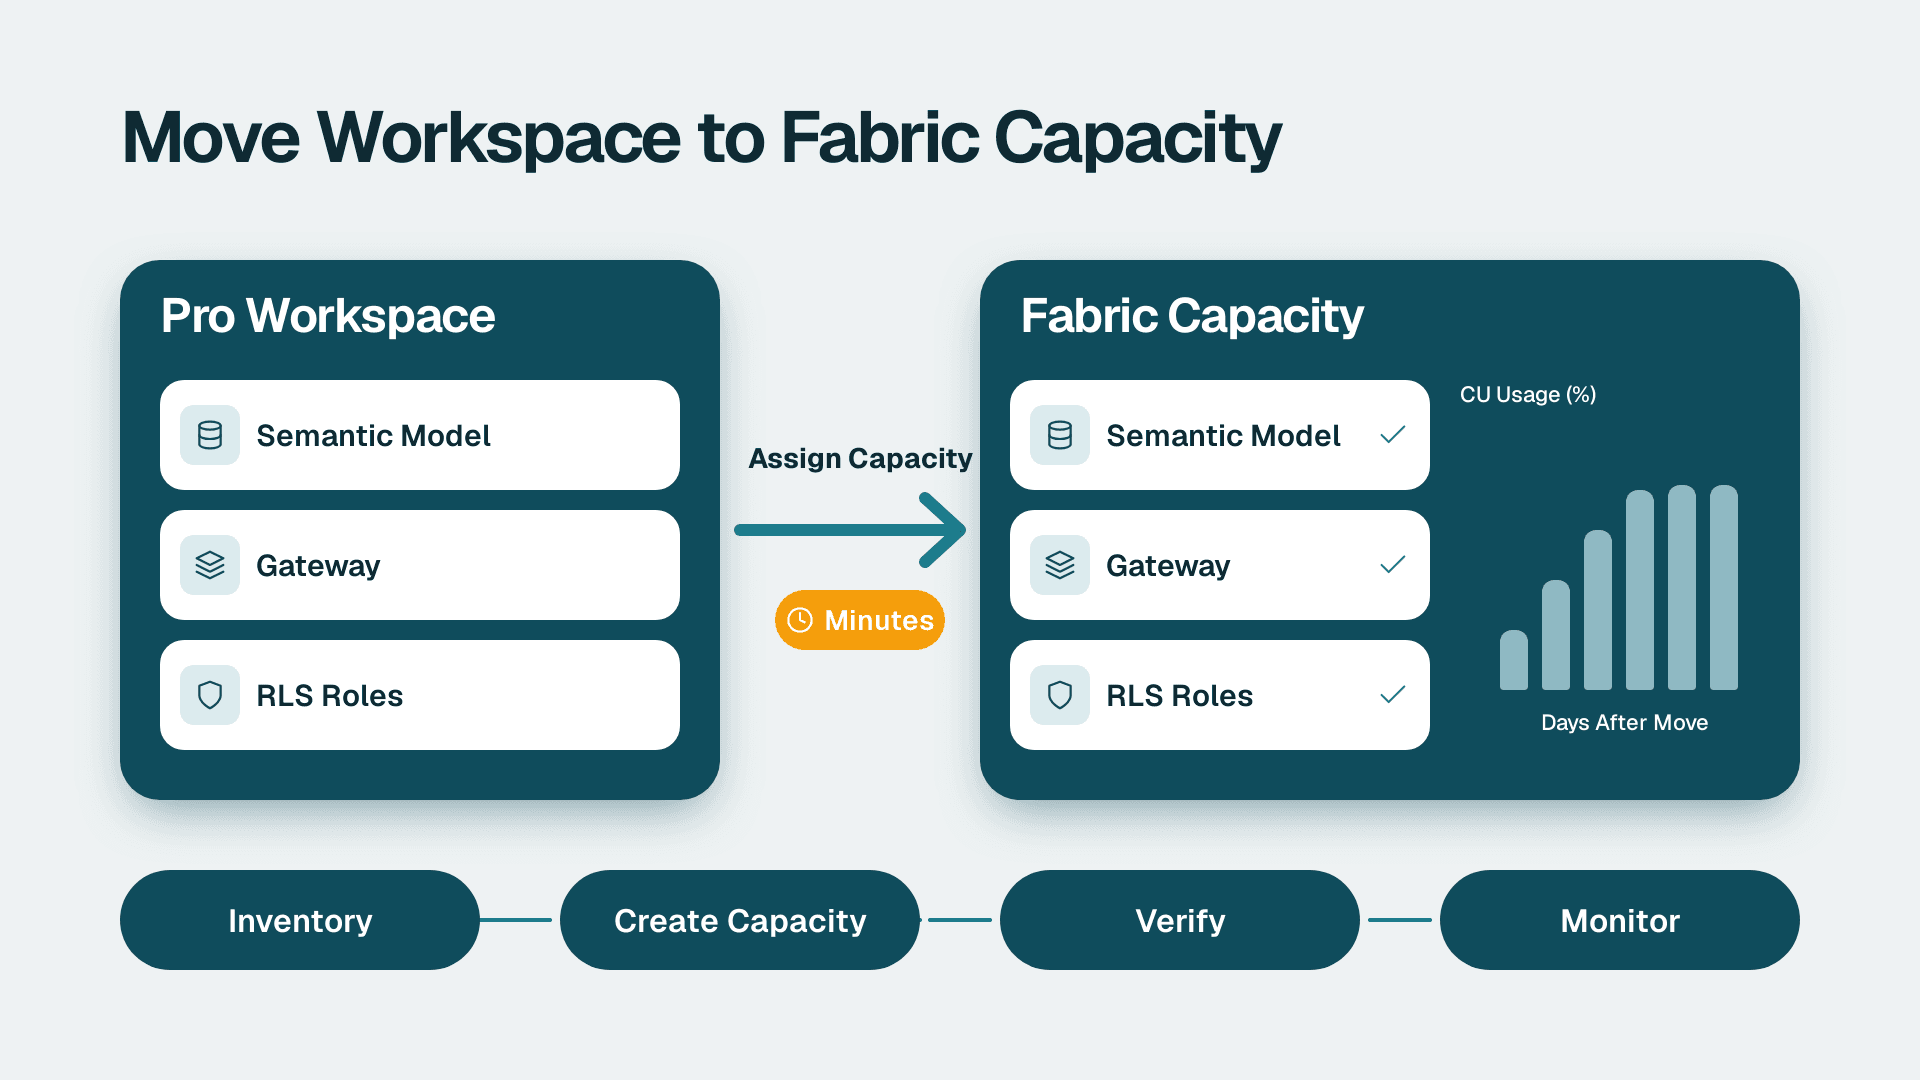
A US SaaS finance team with 80 analysts choosing Power BI Pro would pay roughly $9,600 per year in licensing before accounting for Azure storage or on-premises gateway costs. In 2026, Microsoft's push to migrate Power BI customers toward the broader Microsoft Fabric platform has introduced a Fabric Capacity licensing tier worth evaluating separately - it can be cost-effective for organizations exceeding 500 GB of data or running more than ten premium workspaces, but it adds infrastructure management overhead that narrows the cost advantage over Google Cloud for most mid-market teams. The equivalent Looker Studio deployment - connected to BigQuery - carries only consumption-based compute and storage costs on the Google Cloud side, which are typically lower at moderate query volumes.
The AI consulting services market is forecast to grow from USD 11.07 billion in 2025 to USD 90.99 billion by 2035 at a 26.2% CAGR (Future Market Insights, 2025 - the most recent published projection as of 2026). As analytics investment scales across organizations, platform licensing costs compound - making cost architecture a strategic decision, not just a procurement line item.
Looker Studio vs Power BI Pricing for CFO Dashboards: USD, GBP, EUR, and CAD Breakdown
For finance leaders evaluating looker studio vs power bi pricing for cfo dashboards, vendor-listed USD figures rarely capture the full picture. Microsoft and Google set regional prices independently of spot exchange rates, which means the cost delta shifts meaningfully depending on where a team is headquartered and which currency drives the IT budget.
The table below shows approximate published regional pricing as of August 2026. Verify current figures directly with vendors before finalizing budget models, as regional prices are updated periodically and Microsoft Fabric bundling can alter effective per-seat costs for larger organizations.
| License Tier | USD (per user/month) | GBP (per user/month) | EUR (per user/month) | CAD (per user/month) |
|---|---|---|---|---|
| Looker Studio (free tier) | $0 | £0 | €0 | CA$0 |
| Looker Studio Pro | ~$9 | ~£7 | ~€8.40 | ~CA$12.50 |
| Power BI Pro | $10 | ~£7.50 | ~€9.40 | ~CA$14 |
| Power BI Premium Per User (PPU) | $20 | ~£15.50 | ~€18.80 | ~CA$27.50 |
For a 100-seat finance team, the annual licensing delta between Looker Studio's free tier and Power BI Pro is approximately $12,000 USD / £9,000 GBP / €11,280 EUR / CA$16,800 CAD - before Azure infrastructure or on-premises data gateway costs are factored in. UK and Canadian CFOs working with procurement in local currency often find this gap registers more sharply in budget conversations than the USD figure alone suggests.
Beyond headline licensing, CFOs evaluating these platforms for financial dashboards should stress-test four operational capabilities that directly affect reporting reliability and governance:
| Capability | Looker Studio | Power BI |
|---|---|---|
| Data connectors | 800+ via marketplace; native coverage strongest in the Google ecosystem (GA4, BigQuery, Google Ads, Search Console) | 100+ native enterprise connectors (SQL Server, Azure Synapse, Salesforce, Dynamics 365, SAP HANA) |
| Scheduled data refresh | Up to 12x per day (free and Pro tiers) | Up to 8x per day (Pro); up to 48x per day (PPU) |
| Row-level security | Enforced upstream in BigQuery via IAM and authorized views; no native report-layer RLS | Native RLS enforced at the data model layer; object-level security for column-level control |
| AI features | Gemini integration for Google Cloud customers; no additional AI license required for eligible tiers | Copilot integration available; requires a Microsoft 365 Copilot license at additional cost |
For CFOs in regulated industries - particularly UK financial services firms under FCA oversight or Canadian institutions operating under OSFI guidelines - the row-level security row warrants close attention. Power BI's native RLS delivers audit-ready permission controls enforced at the BI layer, without requiring BigQuery IAM expertise from the finance team. Looker Studio's upstream enforcement model achieves the same governance outcome but adds design complexity that increases implementation cost and ongoing compliance maintenance overhead. Teams that need granular role-based access across multiple budget holders or business units should factor this configuration cost into the total cost of ownership comparison, not just the per-seat licensing figure.
What Data Connectors Does Each Platform Support?
Connector coverage is where the two platforms diverge most visibly for day-to-day analysts.
Looker Studio offers over 800 connectors through its partner marketplace, but its native built-in connectors are oriented firmly toward the Google ecosystem: Google Analytics 4, Google Ads, Search Console, YouTube Analytics, BigQuery, Google Sheets, Campaign Manager, and Display and Video 360. Teams asking how to connect GA4 to Looker Studio will find the process entirely native - authenticate with a Google account, select the GA4 property and data stream, and data is available within minutes. No third-party tools or separate API credentials are required.
For eCommerce use cases, a Looker Studio WooCommerce dashboard is achievable by routing WooCommerce order data through Google Sheets via a plugin export, or by using a paid partner connector available in the Looker Studio marketplace. This approach is workable but adds a connector cost and a dependency worth accounting for in your implementation plan.
Power BI natively connects to over 100 data sources directly in Power BI Desktop: SQL Server, Azure Synapse, Azure SQL Database, Salesforce, Dynamics 365, SharePoint, SAP HANA, Oracle, and dozens of additional enterprise platforms. For organizations with heterogeneous stacks - mixing CRMs, ERPs, on-premises databases, and cloud services - Power BI's native connector library covers more enterprise sources without requiring marketplace plugins or additional spend.
Medinsight's 2025 healthcare analytics review highlighted that three dominant themes shaped analytics investment across the sector: value-based care analytics, AI-driven insights, and payer analytics innovation. Each of these requires pulling data from multiple, often disparate source systems - precisely where Power BI's broader native connector coverage delivers a practical advantage for healthcare data teams.
| Connector Category | Looker Studio | Power BI |
|---|---|---|
| Google Ecosystem (GA4, Ads, Search Console) | Native, free | Third-party or premium connectors |
| Microsoft Ecosystem (Dynamics, SharePoint, Teams) | Third-party connectors | Native, free |
| SQL Databases | Native BigQuery; others via partner connectors | Native for SQL Server, Azure SQL, and many others |
| Salesforce | Partner connector (paid) | Native connector |
| REST APIs and Custom Sources | Community connectors | Power Query (no-code to M code) |
| eCommerce (WooCommerce, Shopify) | Partner connectors | Partner connectors |
| SAP | Limited | Native SAP HANA connector |
A UK fintech firm running Google Workspace alongside Stripe and BigQuery would find Looker Studio's native connectors sufficient for 90% of their reporting needs. A Canadian manufacturing company using Dynamics 365 and an on-premises SQL Server would be better served by Power BI's native enterprise connector suite and the on-premises data gateway.
How Do Looker Studio and Power BI Handle Team Collaboration?
Collaboration architecture is one of the sharpest differentiators CIOs encounter during platform evaluation.
Looker Studio stores reports in Google Drive, meaning sharing works identically to sharing a Google Doc - view, comment, or edit permissions assigned to individuals, Google groups, or organization domains. Reports are URL-accessible and embeddable in websites and intranet pages via iFrame. Critically, the free tier imposes no viewer seat limits. A finance director sharing a dashboard with 500 stakeholders pays no more than one sharing with five.
Power BI organizes work into Workspaces with role-based access controls (Admin, Member, Contributor, Viewer). Reports published to the Power BI Service are distributed via Apps - curated collections of dashboards pushed to defined user groups. Power BI's deepest collaboration advantage is its native Microsoft Teams integration: reports can be pinned directly into Teams channels, reducing the context-switching that drives dashboard abandonment in enterprise environments.
The World Economic Forum's 2025 AI in Financial Services report - drawing on over 100 experts representing more than 50 financial services organizations - found that analytics tooling embedded in existing workflows, rather than isolated BI portals, consistently drove higher end-user adoption rates. This finding validates Power BI's Teams integration as a material advantage for Microsoft-centric finance and operations teams.
For US healthcare teams, collaboration requirements intersect directly with HIPAA. Both platforms can be configured for HIPAA-compliant reporting, but Power BI on Azure offers more turnkey Business Associate Agreement (BAA) documentation that satisfies procurement and legal review with fewer configuration steps. Our HIPAA-Compliant Analytics Dashboard: Best Practices Checklist covers the specific controls to verify on either platform before sharing data adjacent to protected health information.
Which Platform Suits Healthcare and Finance Teams in the US, UK, and Canada?
Compliance requirements and data residency obligations often settle the platform question for regulated organizations before the feature comparison begins.
US Healthcare: Power BI on Azure is the lower-risk choice for most covered entities. Microsoft provides a signed BAA, and Azure's US-only data center options satisfy most HIPAA data residency expectations. Looker Studio on Google Cloud is also HIPAA-eligible when Google Cloud is configured as HIPAA-covered infrastructure, but this requires more deliberate setup and internal documentation. Our AI Analytics Use Cases in Healthcare Finance: 2026 Guide details the configuration checklist our team uses with US healthcare clients.
UK and EU Finance (GDPR): Both platforms support EU data residency. Power BI publishes explicit EU Data Boundary commitments under Microsoft's contractual framework. Looker Studio stores data in BigQuery, where organizations select the EU region at dataset creation. GDPR's most demanding requirements - data minimization, right to erasure, and lawful basis documentation - apply primarily to upstream data pipelines rather than the BI layer, so platform choice matters less than data architecture choices made upstream.
Canadian Organizations (PIPEDA): Under PIPEDA, Canadian financial services and healthcare organizations must ensure personal data is protected with standards comparable to those enforced within Canada. Both Azure (Canada Central region) and Google Cloud (northamerica-northeast1 in Montreal) offer Canadian data residency options. A Canadian financial services firm should explicitly verify that no data is processed in US data centers if cross-border transfer is a regulatory concern - a configuration step both platforms support but neither enforces by default.
The Healthcare Financial Analytics Market is projected to grow at an 8.58% CAGR from 2025 to 2035, driven by regulatory requirements, value-based care mandates, and the shift to predictive analytics (MarketResearchFuture, 2025). For organizations operating in this growth wave, platform selection is a compliance and scalability decision that compounds over years.
How Do Looker Studio and Power BI Compare for Healthcare Compliance: BAA, Audit Logs, Data Residency, and RBAC?
Teams evaluating looker studio vs power bi for healthcare compliance quickly discover that the platforms diverge not just on which certifications they hold, but on how much configuration is required to operationalize those certifications. The four capability areas that hospital IT security reviews and health-tech procurement teams probe most consistently are BAA scope, audit logging, data residency enforcement, and role-based access control.
BAA Availability
Microsoft Azure's BAA is included in the Online Services Terms and covers Power BI as part of Azure's published list of HIPAA-eligible services - procurement teams obtain it through a single agreement that spans the full Microsoft stack. Google Cloud's BAA covers BigQuery and the underlying GCP infrastructure that Looker Studio queries, but organizations must explicitly verify that Looker Studio reports route all data exclusively through HIPAA-covered GCP services. Partner and community connectors are not covered by the Google BAA; any report that touches a non-GCP connector falls outside the agreement's scope. Hospital IT teams should audit every data source in a Looker Studio report against the Google Cloud HIPAA implementation guide before relying on BAA coverage.
Audit Logs
Power BI audit events - report views, data exports, permission changes, workspace modifications, dataset refreshes - feed into the Microsoft 365 Unified Audit Log, queryable through the Microsoft Purview compliance portal or exportable to Azure Sentinel for SIEM integration. Retention extends to 12 months or longer depending on the Microsoft 365 license tier, giving compliance officers a single log stream to satisfy HIPAA's administrative safeguard requirements.
Looker Studio activity logging is distributed across two separate systems. Data-layer query activity is captured in Google Cloud Audit Logs (specifically BigQuery Data Access logs). Report-level activity - who viewed which dashboard page, at what time, from which account - is captured through Google Workspace Admin Reports. Correlating these two sources to produce a complete audit trail is achievable but requires additional tooling or manual export workflows that Power BI delivers natively. For NHS trusts and US hospital networks where audit trail completeness is a recurring auditor focus, this gap adds meaningful compliance operations overhead.
Data Residency
Power BI data residency is controlled at the Microsoft 365 tenant level, with explicit region pinning to Azure geographies including US East, US West, UK South, and EU West. Microsoft's EU Data Boundary commitment - published in 2023 and extended through 2027 - provides contractual guarantees that EU customer data is stored and processed within the EU, a meaningful assurance for UK NHS organizations and EU health-tech companies navigating GDPR Article 44 cross-border transfer restrictions post-Schrems II.
Looker Studio enforces data residency through BigQuery dataset location selection at dataset creation time. US healthcare organizations create BigQuery datasets in US-only multi-regions; EU and UK organizations use the EU multi-region or europe-west2 (London) region. The residency gap to manage: Looker Studio reports connected to partner connectors rather than BigQuery may route data through connector vendor infrastructure outside the selected residency zone. Hospital IT security reviews frequently flag this as an unverified assumption that requires connector-by-connector vetting before residency claims can be asserted.
Role-Based Access Control (RBAC)
This is the dimension where the two platforms diverge most sharply for hospital analytics deployments. Power BI's workspace model provides four role tiers (Admin, Member, Contributor, Viewer) and supports Row-Level Security (RLS), which restricts which rows of data a user can see within a shared report enforced at the data model layer. For a hospital network, RLS means a department head for cardiology views only cardiology cost and utilization data in the same report the CFO sees in aggregate - no duplicate reports required, and no risk of a misconfigured share exposing cross-department data. Power BI also supports object-level security for hiding specific columns from defined user groups, giving clinical informatics and compliance teams granular control over sensitive fields such as patient identifiers or payer rates.
Looker Studio's sharing model inherits from Google Drive: users receive view, comment, or edit access to an entire report. There is no native row-level or column-level security at the report layer. Granular data access must be enforced upstream in BigQuery using authorized views or dataset-level IAM policies, and every data source connected to the report must independently respect those boundaries. For health-tech teams with multi-role reporting requirements - clinicians, billing, compliance officers, and executives accessing the same underlying dataset with different permission scopes - this upstream enforcement model is architecturally sound but adds design complexity that Power BI's built-in RLS avoids. Teams should treat RBAC architecture as an early design decision rather than a post-launch configuration task; retrofitting row-level access controls into a live Looker Studio reporting environment is costly on either platform, but the baseline effort is higher when access logic lives in the data layer rather than the BI layer.
Looker Studio vs Power BI 2026 Comparison: Feature Snapshot
| Feature | Looker Studio | Power BI |
|---|---|---|
| Base cost | Free (Pro: ~$9/user/month) | $10/user/month Pro; $20/user/month PPU |
| Data modeling depth | Calculated fields; limited source blending | Full DAX engine; Power Query M code |
| Native ecosystem strength | Google (GA4, Ads, BigQuery, Search Console) | Microsoft (Azure, Dynamics 365, Teams, SharePoint) |
| Viewer licensing | Unlimited viewers at no cost | Per-user Pro license required to view shared reports |
| Report sharing | Google Drive link sharing | Power BI Apps; Microsoft Teams integration |
| Scheduled data refresh | Up to 12x per day (free tier) | Up to 8x per day (Pro); up to 48x per day (PPU) |
| Mobile experience | Browser-first; no dedicated app | Dedicated iOS and Android Power BI app |
| AI features | Gemini integration (Google Cloud customers) | Copilot (requires Microsoft 365 Copilot license) |
| HIPAA BAA | Available via Google Cloud agreement (GCP services only; partner connectors excluded) | Available via Azure agreement (covers Power BI service end-to-end) |
| Audit logging | BigQuery Data Access logs + Google Workspace Admin Reports (two separate sources) | Microsoft 365 Unified Audit Log (single stream; Purview/Sentinel integration) |
| Row-level security (RBAC) | Enforced upstream in BigQuery via IAM/authorized views; no native report-layer RLS | Native RLS and object-level security enforced at the data model layer |
| GDPR and PIPEDA data residency | Configurable BigQuery region selection; partner connectors require separate vetting | Configurable Azure region selection; EU Data Boundary commitment extended through 2027 |
| Custom visuals and plugins | 800+ partner connectors | AppSource marketplace (200+ certified visuals) |
| Desktop report builder | Browser-based (cross-platform) | Power BI Desktop is Windows-only |
When Should You Choose Looker Studio Over Power BI in 2026?
The decision framework for most mid-market teams follows from stack alignment, not feature lists.
Choose Looker Studio when:
Your organization is Google Workspace-first and your primary data sources are GA4, Google Ads, BigQuery, or Search Console
You need to share dashboards with large or external audiences without paying per-viewer licensing fees
Your use case is marketing analytics, web analytics, or eCommerce reporting - including building a Looker Studio WooCommerce dashboard via connector plugins
You want zero-licensing-cost reporting for a lean analytics team at a startup or scale-up
Connecting GA4 to Looker Studio in minutes matters more to your team than deep enterprise data modeling
Choose Power BI when:
Your organization runs Microsoft 365 and depends on Teams, SharePoint, Dynamics 365, or Azure data services
You need complex multi-table data modeling, row-level security, and sophisticated DAX calculations across large datasets
Your data team requires incremental refresh, composite models, and enterprise-grade deployment pipelines
You are a regulated US healthcare or Canadian financial organization where Azure's BAA coverage, unified audit logging, and native RLS simplify compliance procurement and ongoing audits
Field teams or executives require a polished mobile app experience rather than browser-only access
For organizations sitting on the fence, a hybrid approach - Looker Studio for marketing and external-facing dashboards, Power BI for internal financial and operational reporting - is increasingly common among mid-market companies. The two platforms can coexist within a single organization with well-defined data ownership boundaries and a shared underlying data layer such as BigQuery or Azure Synapse.
When Should Finance and Ops Teams Replace Excel Reporting with Looker Studio?
For many finance and ops managers, the Looker Studio versus Power BI question is secondary to a more immediate one: knowing when to replace Excel reporting with Looker Studio altogether. The decision framework below is built specifically for FP&A leads, ops directors, and controllers evaluating that migration in 2026.
Data source readiness checklist
Before committing to a migration, verify that your environment meets the following conditions:
Your primary source data already lives in Google Sheets, BigQuery, Google Analytics 4, or Google Ads - native connectors eliminate any ETL step
At least three manual copy-paste steps currently sit between a raw data export and the final spreadsheet that gets distributed to stakeholders
Multiple team members maintain separate versions of the same report, creating reconciliation overhead at each reporting cycle
Month-end close or weekly ops reviews depend on someone manually refreshing a file before the meeting starts
If three or more of these apply, the ongoing cost of maintaining Excel-based reporting - in analyst hours and error risk - typically exceeds the one-time setup cost of a Looker Studio migration for most mid-market teams.
Refresh-latency tradeoffs
The most common operational friction when replacing Excel with Looker Studio is data freshness. Looker Studio's free tier refreshes native Google connectors up to 12 times per day - sufficient for daily P&L snapshots, weekly KPI decks, and monthly board reporting. Teams that need sub-hourly refresh on transactional data (intraday cash positions, real-time inventory) should pair Looker Studio with BigQuery streaming inserts, which adds Google Cloud consumption cost but gives finance full control over refresh cadence independent of connector defaults.
Partner and community connectors pointing at Salesforce, HubSpot, or custom REST APIs cache data for up to 12 hours by default. Finance teams pulling live CRM pipeline data should verify connector refresh behavior before going live, or route source data through BigQuery to control freshness centrally.
ROI signals that justify the migration
The business case for replacing Excel with Looker Studio becomes material when any of the following are true:
More than two hours per week are spent manually updating, formatting, and distributing spreadsheet reports
Reporting errors from stale data or broken formulas have surfaced to a senior stakeholder in the past quarter
The team has grown beyond ten people who need consistent access to the same operational metrics
A new executive or board member has requested live dashboard access rather than periodic PDF exports
For ops teams already standardized on Google Workspace, this migration typically takes two to four weeks - covering data source connections, calculated fields, and sharing permissions. That compares favorably to a Power BI deployment, which requires licensing procurement and on-premises gateway configuration before the first report is live.
What Hidden Limitations Should Decision-Makers Know About?
Looker Studio limitations: Data freshness is a genuine operational constraint. Community and partner connectors often cache data for 12 hours, which frustrates operations or finance teams needing near-real-time visibility. The data modeling layer is comparatively thin: calculated fields and source blending cover most reporting needs, but there is no DAX equivalent for complex multi-table business logic. Reports with many blended data sources can render slowly without BigQuery as a performant, scalable backend. For healthcare teams specifically, the absence of native row-level security and the split audit log architecture add compliance configuration work that Power BI handles at the platform layer.
Power BI limitations: Per-user licensing costs escalate quickly at enterprise scale. Power BI Desktop - the primary report-building tool - is Windows-only, creating friction for Mac-using analysts who must rely on the browser-based report builder, which has fewer capabilities. The learning curve for DAX, Power Query M code, and the workspace-gateway architecture is steeper than Looker Studio's drag-and-drop interface. And as Power BI evolves into the broader Microsoft Fabric platform, understanding where Power BI ends and Fabric begins requires meaningful onboarding investment. Our guide on Microsoft Fabric vs Power BI: What's Actually Different untangles the distinction for teams evaluating the full Microsoft analytics ecosystem.
If your team is at the early stages of platform selection and wants a structured way to assess readiness before committing, our Free BI Readiness Assessment surfaces the infrastructure, skills, and compliance gaps that most often derail implementation.
Ready to evaluate Looker Studio with expert guidance on connector setup, compliance configuration, and dashboard architecture? Explore our Certified Looker Studio consulting services to see how we help teams across healthcare, finance, and SaaS configure and scale Looker Studio to production.
---
About Lets Viz: Lets Viz has delivered data analytics and business intelligence consulting to clients in US healthcare, UK fintech, Canadian manufacturing, and global SaaS since 2020. With a 5.0 rating on Clutch, our certified consultants help mid-market CIOs, data leads, and finance directors select, implement, and scale the right BI platform - whether Looker Studio, Power BI, or a hybrid stack built around your compliance and cost requirements.
---