Looker vs Power BI Cost Comparison: TCO at 50-500 Seats
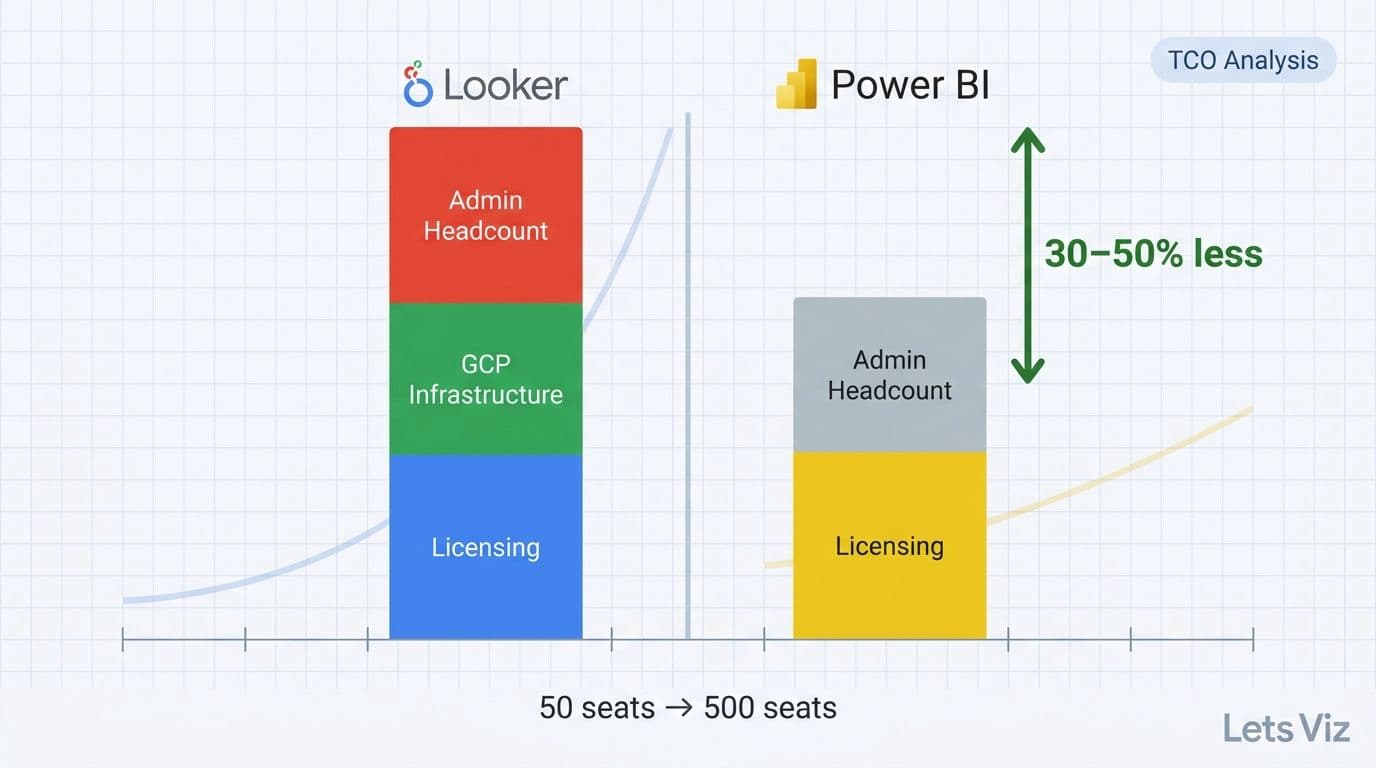
At 50-500 seats, Power BI typically costs 30-50% less than Looker on a total-cost-of-ownership basis, primarily because Looker's per-user pricing and mandatory Google Cloud infrastructure compound quickly at scale. For mid-market organizations in regulated industries, managed Power BI narrows that gap further by eliminating dedicated BI admin headcount - the single largest hidden cost in any enterprise BI deployment. Organizations evaluating power bi premium vs managed service cost as a standalone decision - separate from the Looker comparison - will find a similar structural argument: self-managed Premium capacity requires a dedicated admin role that a managed engagement replaces.
Key Takeaways
Choosing the right BI platform affects not just licensing spend but hiring capacity, compliance posture, and migration complexity - all factors covered in depth in the managed Power BI vs in-house BI team cost guide.
Licensing gap: Power BI Pro costs $10/user/month; Looker Standard runs $30-$65/user/month, a 3-6x premium before infrastructure.
Infrastructure: Looker requires Google Cloud (BigQuery), adding $500-$3,000+/month above licensing; Power BI is Azure-hosted with no separate infrastructure bill.
Admin overhead: Looker requires LookML specialists at $120,000-$160,000/year; Power BI draws from a much larger and lower-cost talent pool.
Hidden migration costs: Moving from legacy platforms such as IBM Cognos or SAP BusinessObjects typically costs $50,000-$300,000 depending on data model complexity.
Decision trigger: Organizations below 300 seats in regulated industries almost always achieve lower TCO with managed Power BI over a three-year horizon.
How Do Licensing Costs Break Down in the Looker vs Power BI Cost Comparison?
Power BI offers two primary licensing paths: Power BI Pro at $10/user/month and Power BI Premium Per User (PPU) at $20/user/month. For organizations above 300 seats requiring premium features - paginated reports, AI visuals, and larger dataset capacities - the Power BI Premium P1 capacity SKU at approximately $4,995/month unlocks unlimited read-only access across the tenant, reducing effective per-user cost below $10 at scale. Organizations evaluating the newer Microsoft Fabric F64 SKU (the consumption-model equivalent of P1 at approximately $6,272/month) should factor in that Fabric capacity includes OneLake storage and Spark compute alongside Power BI, which can consolidate platform costs if a broader data engineering footprint is already in scope.
Looker, now part of Google Cloud, uses a platform-plus-consumption model. A standard deployment begins at approximately $5,000-$10,000/month in platform fees, with additional per-user charges of $30-$65/month depending on license tier (Viewer, Standard, or Developer). At 100 seats of Looker Standard, annual licensing alone reaches $96,000-$156,000 before any infrastructure is factored in.
| Seats | Power BI Pro (annual) | Power BI Premium P1 (annual) | Looker Standard (annual, est.) |
|---|---|---|---|
| 50 | $6,000 | $59,940 | $48,000-$99,000 |
| 100 | $12,000 | $59,940 | $96,000-$138,000 |
| 200 | $24,000 | $59,940 | $132,000-$216,000 |
| 500 | $60,000 | $59,940 | $240,000-$450,000 |
*Power BI Premium P1 includes unlimited read-only users. Looker estimates include platform fee plus per-user charges at published tier bounds. Verify current pricing with each vendor before finalizing budgets.*
For finance and healthcare organizations building a complete investment picture, what Power BI consulting costs in 2026 covers implementation and ongoing service rates alongside licensing - a view that consistently changes the first-year arithmetic.
What Infrastructure Costs Should You Budget for With Each Platform?
This is where the Looker vs Power BI cost comparison diverges most sharply for regulated-industry organizations.
Power BI is a SaaS product hosted on Microsoft Azure. Storage, compute, and refresh capacity are bundled into the license tier. Organizations on Microsoft 365 E3/E5 may find Power BI Pro already included, further reducing incremental cost. Azure integrations incur normal compute charges, but these exist independently of Power BI licensing rather than as a mandatory coupling.
Looker is architecturally coupled to Google Cloud. Semantic layer queries run against BigQuery or another supported warehouse, and every query cycle generates compute costs. A mid-market organization running 200 active users with hourly refreshes on a 100 GB dataset can realistically expect $800-$2,500/month in BigQuery charges on top of Looker licensing. Organizations not already on Google Cloud face additional migration costs to replicate or move their data warehouse.
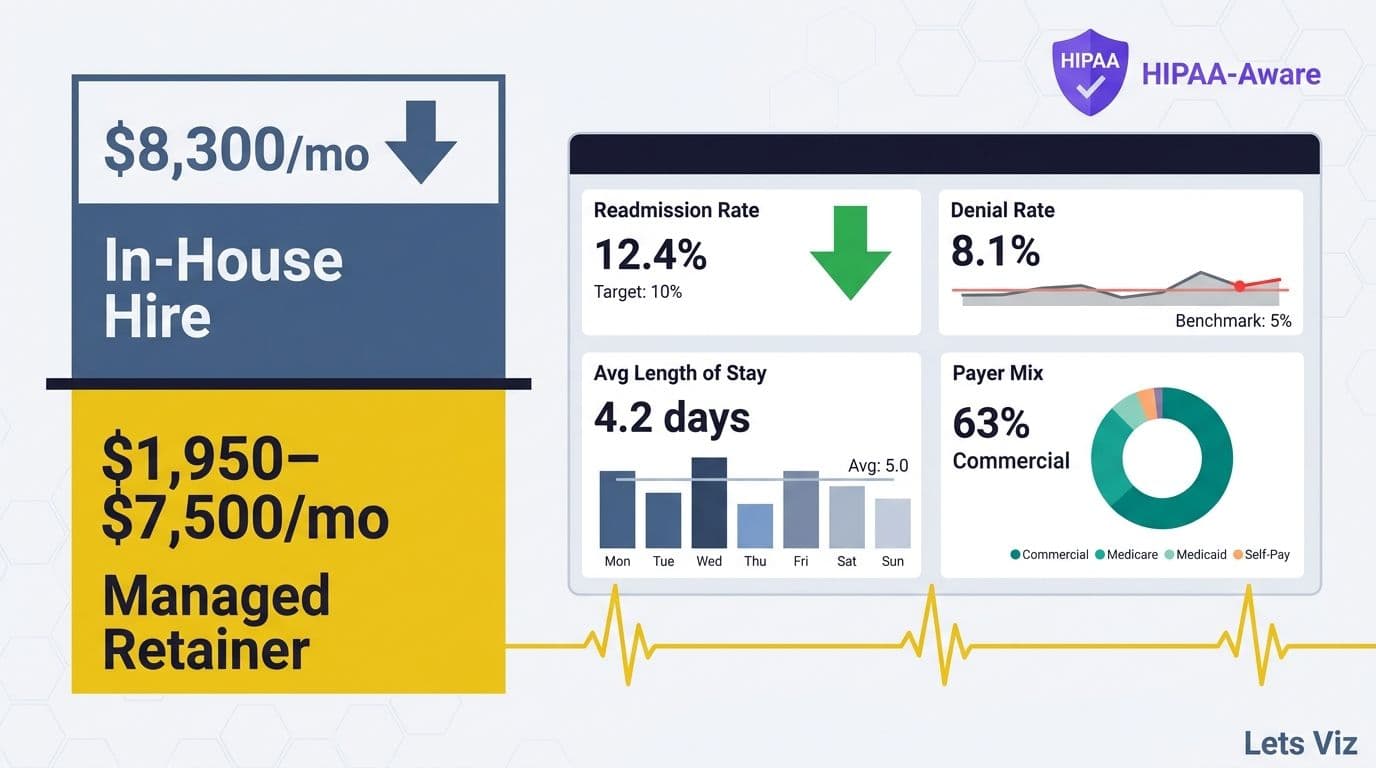
For healthcare and financial services firms subject to HIPAA, SOC 2, or FCA requirements, infrastructure residency is a compliance variable as much as a cost variable. Power BI's Azure-native architecture integrates with existing Microsoft compliance frameworks without additional engineering overhead. The HIPAA-compliant analytics dashboard checklist details the configuration steps that diverge between platforms in regulated contexts - steps that represent real engineering hours in any initial deployment budget.
As of 2026, analysts at MedInsight identify AI-driven analytics as one of three dominant themes reshaping health system BI strategy, alongside value-based care and payer analytics innovation — with health systems increasingly requiring vendors to demonstrate native integration with ambient documentation and clinical decision support tools before standardizing on a BI platform. Organizations in regulated industries that have not standardized their analytics infrastructure face platform lock-in costs that compound as AI capabilities roll out separately on each vendor's roadmap.
How Much Does Admin Overhead Add to the Real Cost of Each Platform?
Admin overhead is the cost category most procurement teams omit from initial TCO models - and the one that most frequently causes BI deployments to exceed budget in years two and three.
Looker administration centers on LookML, a proprietary modeling language with a shallow talent pool relative to mainstream BI skills. A senior LookML developer commands $120,000-$160,000 per year in the US market; UK and European contractors bill at equivalent day rates. Organizations typically need at least one dedicated LookML engineer to maintain a production Looker environment, plus a data engineering resource to manage warehouse pipeline dependencies.
Power BI administration draws from a significantly broader talent market. Power BI developers average $80,000-$120,000/year, and Microsoft's PL-300 certification creates a predictable supply of qualified candidates. For organizations running Microsoft Fabric, Power BI administration increasingly overlaps with broader data platform roles, reducing the need for BI-specific headcount.
The headcount delta between platforms - conservatively $40,000-$80,000/year per position - often exceeds the entire licensing cost difference at the 50-100 seat range. This is the structural reason managed Power BI becomes cost-competitive against in-house Looker deployments even when Looker licensing appears comparable: the service model replaces a full-time role rather than supplementing one.
The Healthcare Financial Analytics Market is projected to grow at an 8.58% CAGR from 2026 to 2035, according to Market Research Future (2026) - a trajectory that will intensify BI admin talent scarcity as demand for analytics specialists outpaces supply. Organizations locked into proprietary modeling languages face compounding recruitment and retention risk across that horizon.
What Are the Hidden Migration Costs in a BI Platform Switch?
Migration costs are the budget line most commonly underestimated in any total cost of ownership analysis - particularly for organizations moving from legacy platforms such as IBM Cognos or SAP BusinessObjects.
Data model migration is the dominant cost driver. Translating Cognos Report Studio frameworks to either platform requires semantic layer rearchitecting, not simple report conversion. The concept mapping from Cognos Report Studio to Power BI is well-documented: query subjects become Power BI tables, filters become DAX measures, and burst distributions become paginated report subscriptions. This mapping path is supported by a mature ecosystem of migration specialists. The equivalent Looker/LookML migration path is less mature, with fewer certified practitioners and limited tooling support.
A typical mid-market Cognos environment with 200-400 reports requires 800-2,000 consulting hours for migration, translating to $80,000-$250,000 at current market rates. Training and change management add a further 15-25% to migration budgets. Integration re-work - ERP connectors, CRM feeds, and scheduled refresh pipelines - adds $20,000-$60,000 for Looker (requiring custom dbt or Fivetran pipelines) versus $10,000-$30,000 for Power BI (leveraging Microsoft's native connector ecosystem). All-in, a Cognos to Power BI migration for a 200-seat organization typically runs $120,000-$300,000 over a 12-month stabilization window.
For a detailed breakdown of consulting engagement structures and what drives cost variance in BI migration projects, the Power BI consulting cost guide provides current market ranges by project type and scope.
According to Future Market Insights (2026), the AI consulting services market reached approximately USD 14 billion in 2026 and is projected to grow toward USD 90.99 billion by 2035 at a 26.2% CAGR - meaning organizations that delay platform consolidation will face progressively higher specialist fees as demand for analytics talent compounds. Establishing the right platform now reduces long-term consulting dependency.
Decision Matrix: When Does Managed Power BI Win on Total Cost of Ownership?
The TCO case for Power BI strengthens at nearly every point below 500 seats, and managed Power BI compounds that advantage by eliminating internal headcount risk while providing governed semantic layer management as part of the service.
| Cost Factor | Looker | Power BI In-House | Managed Power BI |
|---|---|---|---|
| Licensing (100 seats, annual) | $96,000-$138,000 | $12,000-$24,000 | $12,000-$24,000 |
| Infrastructure (annual) | $9,600-$30,000 | Bundled | Bundled |
| Admin headcount (annual) | $130,000-$160,000 | $90,000-$120,000 | Included in service |
| Migration from legacy BI (one-time) | $150,000-$300,000 | $100,000-$250,000 | $80,000-$180,000 |
| Training (annual) | $15,000-$30,000 | $8,000-$15,000 | Included in service |
| **3-year TCO estimate (100 seats)** | **$780,000-$1.3M** | **$400,000-$700,000** | **$320,000-$550,000** |
*Estimates based on published vendor pricing and market-rate consulting figures. Verify against your specific seat count, stack, and engagement scope.*
When Looker wins the comparison: Organizations already standardized on Google Cloud with BigQuery as their primary warehouse, engineering-led analytics cultures comfortable with LookML, and data product teams building embedded analytics for external customers will find Looker's programmatic model layer valuable enough to justify the cost premium. At 500+ seats with high query concurrency and complex multi-tenant requirements, the licensing delta narrows and Looker's architectural advantages may outweigh TCO concerns.
When managed Power BI wins the comparison: Mid-market organizations in regulated industries - financial services, healthcare, insurance - with 50-500 seats, existing Microsoft 365 infrastructure, and business-user self-service requirements consistently achieve lower 3-year TCO with managed Power BI. Lower licensing, bundled infrastructure, Microsoft ecosystem integration, and eliminated headcount risk create a structural cost advantage that scales with seat count.
For organizations currently using project-based BI consulting, the framework for outsourcing Power BI management identifies the trigger points at which a managed model delivers better economics than retained consulting or internal staffing.
How Does Power BI Premium vs Managed Service Cost Compare Across US, UK/EU, and Canada?
The power bi premium vs managed service cost calculation shifts materially by geography, because managed engagement rates track local labour markets while Microsoft capacity licensing is priced in USD and converted at mid-market rates. This regional dimension is absent from most TCO calculators but consistently surfaces as a deciding factor for multi-country organizations evaluating whether to self-manage Premium or Fabric capacity versus outsourcing to a managed provider.
Self-managed Power BI Premium / Fabric capacity (monthly licensing only)
| SKU | US (USD) | UK/EU (approx.) | Canada (approx. CAD) |
|---|---|---|---|
| Premium P1 | $4,995 | £4,200 / EUR 4,900 | CA$6,800 |
| Premium P2 | $9,990 | £8,400 / EUR 9,800 | CA$13,600 |
| Fabric F64 (P1 equivalent) | $6,272 | £5,300 / EUR 6,150 | CA$8,500 |
*Local currency figures are approximate and vary with exchange rates and Microsoft regional price adjustments. Fabric F64 includes OneLake and Spark compute in addition to Power BI capacity.*
Capacity licensing is only part of the self-managed picture. A Power BI Premium or Fabric environment requires a dedicated admin - typically 0.5 to 1.0 FTE at $90,000-$120,000/year in the US, £55,000-£80,000/year in the UK, or CA$85,000-CA$110,000/year in Canada. Adding blended headcount to P1 capacity brings annual self-managed spend to approximately $150,000-$210,000 (US), £105,000-£150,000 (UK), or CA$147,000-CA$192,000 (Canada) - before governance tooling, training, or incident response overhead.
Outsourced managed Power BI engagement (monthly, all-in)
Managed service fees bundle capacity licensing, administration, governance, and a defined number of model update or development hours per month. Representative rates for a mid-tier engagement covering 100-300 seats:
| Region | Monthly range | Typical scope |
|---|---|---|
| US | $8,000-$18,000 | P1/F64 capacity, admin, 20-40 dev hrs/month, SLA |
| UK/EU | £6,000-£13,000 | Same scope, local support hours, GDPR alignment |
| Canada | CA$10,000-CA$20,000 | Same scope, bilingual support optional |
At the 100-seat mark, the annual cost of self-managed Premium plus headcount in the US ($150,000-$210,000) sits squarely within the managed engagement range ($96,000-$216,000) - but the managed option also eliminates recruitment risk, covers DAX model reviews, and provides SLA-backed uptime. In the UK, self-managed Premium plus an admin runs roughly £105,000-£150,000/year, while a managed engagement at £6,000-£13,000/month totals £72,000-£156,000/year. Canadian organizations reach a similar crossover between 75 and 150 seats. In all three geographies, the breakeven point falls well below 200 seats when the organization is hiring a net-new admin role rather than redeploying existing headcount.
How Do Power BI's Technical Architecture Choices Affect Long-Term TCO?
Architecture decisions made at Power BI deployment affect TCO through their influence on refresh costs, query performance, and the skill requirements needed to maintain the environment over time.
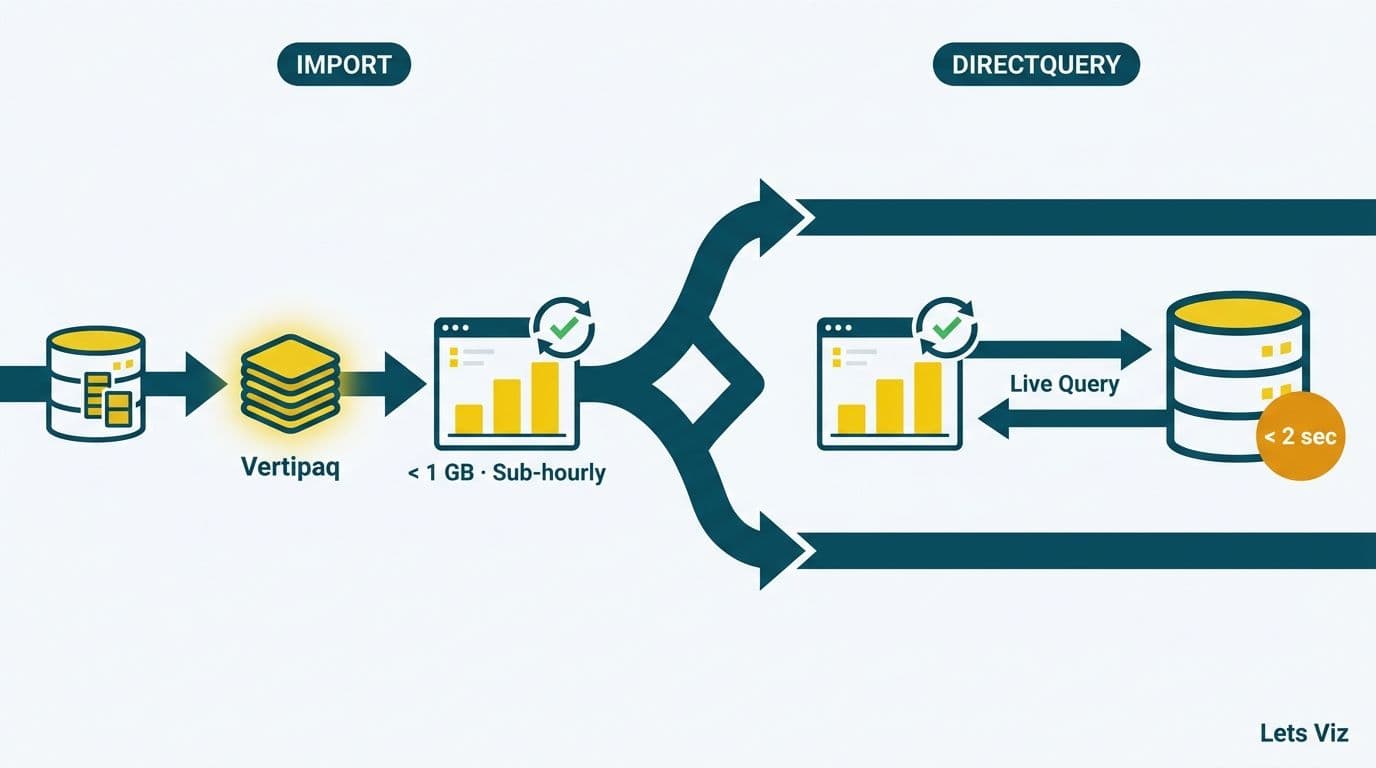
Power BI import mode vs DirectQuery is the foundational choice with direct cost consequences. Import mode stores data in Power BI's in-memory engine, enabling fast queries without repeated warehouse charges. DirectQuery passes each query to the source system in real time - well-suited for live data requirements but increasing warehouse compute costs on metered platforms and restricting certain DAX patterns. Choosing the wrong mode at initial deployment creates infrastructure cost overruns and performance re-engineering costs in later years.
SUMX - a DAX iterator function that evaluates an expression row-by-row across a table - and CROSSFILTER, which controls filter propagation direction between related tables, are powerful tools for complex financial calculations but require developers with intermediate-to-advanced DAX skills. When these functions are approximated with simpler alternatives to avoid skill-gap risk, query performance degrades and optimization work accumulates over time. Managed Power BI engagements typically include DAX model review as a core deliverable, preventing the performance debt that builds in self-managed environments.
Natural language Q&A in Power BI reduces the volume of ad-hoc report requests routed to the BI team - a labor cost saving that is difficult to quantify in initial TCO models but consistently appears in post-implementation reviews. For finance teams, AI-powered Power BI consulting documents where Copilot and Q&A features deliver measurable productivity gains in reporting and close workflows.
To estimate the total cost of a Power BI deployment or migration for your organization's specific seat count and technology stack, use the Instant project cost calculator.
---
About Lets Viz: Lets Viz is a specialist analytics consultancy serving financial services and healthcare organizations since 2020, with hands-on expertise in Power BI governance, DAX architecture, and regulated-industry data compliance. Our certified team - holding Microsoft Fabric and PL-300 credentials - has delivered BI platform migrations and managed service engagements for mid-market enterprises across the United States and United Kingdom, including payer analytics, wealth management, and multi-site healthcare finance operations.
See also: Looker Studio SEO Dashboard →
If you have already decided on Looker Studio and want to skip straight to implementation, our Looker Studio Marketing Dashboard template shows exactly what a production-ready marketing report looks like across GA4, Google Ads, Meta, HubSpot, and Salesforce.