WooCommerce Looker Studio Dashboard: Complete 2026 Guide
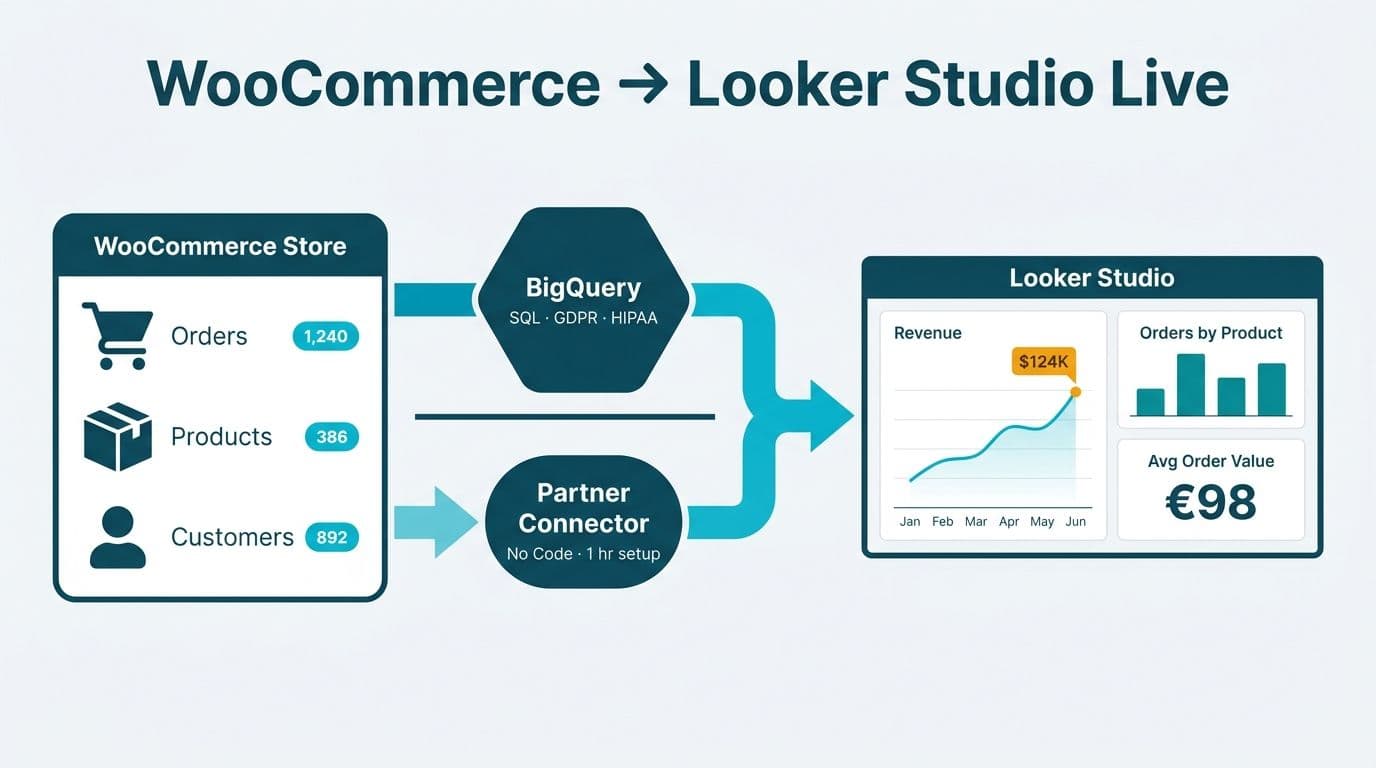
A WooCommerce Looker Studio dashboard connects your store's order, product, and customer data to Google's free visualization platform, giving finance directors and data teams a live e-commerce performance view. Connect via a BigQuery export pipeline for full SQL control and HIPAA, GDPR, or PIPEDA compliance, or use a certified partner connector that requires no code and goes live within an hour.
Key Takeaways
WooCommerce connects to Looker Studio via a BigQuery export pipeline or a third-party connector; BigQuery is the stronger choice for mid-market scale and regulated industries.
A production-ready dashboard covers three pages: revenue trends, product performance, and customer cohort analysis.
Row-level security in BigQuery lets multiple brands or business units share one dataset without data leakage - essential for GDPR and PIPEDA compliance.
Looker Studio's template system means one certified build can be reused across brands, subsidiaries, or client accounts at no extra licensing cost.
Healthcare and financial services organizations gain the most long-term value by designing compliance audit trails into the data architecture from day one.
People-ops teams in the US, UK/EU, and Canada use the same BigQuery architecture to build compliant employee-analytics dashboards, applying jurisdiction-specific anonymisation thresholds and data-residency controls to prevent re-identification in cross-border aggregate reports.
What Is a WooCommerce Looker Studio Dashboard?
A WooCommerce Looker Studio dashboard is a live reporting environment that queries WooCommerce order, product, and customer records and renders them as charts, scorecards, and tables inside Google Looker Studio - Google's free, browser-based visualization tool. Unlike a monthly export to a spreadsheet, the dashboard refreshes automatically: a finance director reviewing Monday's numbers is reading Monday's data, not a weekend snapshot.
For mid-market organizations, the dashboard typically covers three interlocking pages: a revenue overview for executive and finance reporting, a product performance breakdown for merchandising and supply chain, and a customer acquisition and retention view for marketing and growth teams. Our Certified Looker Studio consulting engagements standardize on this three-page structure because it maps directly to the questions a CIO or VP of Finance asks in a Monday morning review: How much did we make? What sold? Who bought it, and will they come back?
This applies directly to healthcare e-commerce suppliers - distributors of medical devices, laboratory consumables, or digital health software subscriptions - that run WooCommerce storefronts and need audit-ready analytics to satisfy internal finance controls and HIPAA reporting requirements.
How Do You Connect WooCommerce to Looker Studio?
WooCommerce does not ship with a native Looker Studio connector, so integration requires one of two architectures: a BigQuery export pipeline or a certified third-party partner connector. The right choice depends on data volume, internal technical capability, and regulatory obligations.
BigQuery Export Pipeline
This approach uses the WooCommerce REST API or a dedicated export plugin to pull order records, line items, customers, and products on a scheduled basis, loading them into a Google BigQuery dataset. Looker Studio then connects to BigQuery as a direct data source, using SQL views and calculated fields to present clean metrics to report authors.
The setup steps:
1. Generate WooCommerce REST API credentials (Consumer Key and Consumer Secret) from WooCommerce > Settings > Advanced > REST API.
2. Deploy a WooCommerce-to-BigQuery export script or install a maintained plugin that writes directly to a Google Cloud destination.
3. Schedule the export using Google Cloud Scheduler - daily for most stores, hourly for high-volume operations exceeding 10,000 orders per day. At that volume, a 24-hour data lag means roughly $27,000 in daily revenue moving through reports that cannot flag a fulfilment anomaly until the following morning; hourly loads cut that exposure window to under 60 minutes.
4. In BigQuery, create date-partitioned tables for orders, order items, customers, and products to control long-term query costs.
5. Write a BigQuery SQL view joining those tables into a single flat structure Looker Studio can query without report-time joins.
6. In Looker Studio, connect to BigQuery, select the flat view, and define calculated fields - AOV, refund rate, gross revenue, net revenue - at the data source level so every report author shares identical metric definitions.
This pipeline provides full data lineage: every row loaded into BigQuery is traceable to its source API call, satisfying SOC 2 Type II audit documentation and HIPAA security rule evidence requirements. Google Cloud IAM controls who can query which dataset, and Cloud Audit Logs record every access event - capabilities that third-party connectors rarely replicate.
Certified Partner Connector
Several Google Marketplace connectors pull WooCommerce data into Looker Studio using the REST API without requiring a BigQuery project. The connector authenticates with an API key, defines a fixed schema, and presents a Looker Studio data source immediately.
Setup takes under 60 minutes: generate a WooCommerce REST API key, paste it into the connector's authentication screen, select a historical backfill range, and the connector materializes a Looker Studio data source. No SQL, no GCP billing account, no deployment pipeline required.
The constraint is schema flexibility. Partner connectors expose only the fields the vendor chose to include. If your use case requires a custom WooCommerce product attribute, a subscription billing cycle field, or a custom order metadata key, you depend on the vendor's product roadmap. For straightforward reporting - top products, daily revenue, acquisition channel breakdown - a connector is entirely sufficient. For multi-source dashboards joining WooCommerce to a CRM or ERP, the fixed schema becomes a ceiling.
BigQuery vs Partner Connector: Side-by-Side
| Criterion | BigQuery Export | Partner Connector |
|---|---|---|
| Setup time | 4-8 hours (developer required) | Under 60 minutes (no code) |
| SQL and transformation control | Full (BigQuery SQL) | Limited to vendor schema |
| Data freshness | Configurable: hourly to streaming | Typically daily |
| Cost model | GCP storage and compute charges | Connector subscription fee |
| HIPAA / GDPR / PIPEDA / SOC 2 | Fully auditable, IAM-controlled | Varies by vendor |
| Join with CRM, GA4, or ERP | Yes | Rarely supported |
| Best for | Mid-market, regulated industries | SMB, proof-of-concept builds |
A US healthcare supplies distributor processing 200,000 orders per year under HIPAA audit obligations will almost always choose the BigQuery route - documented data lineage alone justifies the additional setup investment. A UK fintech selling SaaS subscriptions through WooCommerce under GDPR data residency requirements benefits from storing records inside a Google Cloud region designated for EU data processing. A Canadian retailer subject to PIPEDA will value BigQuery's ability to document exactly what personal data is collected, where it is stored, and who accessed it - the three accountability questions PIPEDA requires organizations to answer on demand.
What KPIs Should a WooCommerce Looker Studio Dashboard Track?
Each of the three dashboard pages answers one business question with a dedicated set of metrics.
Page 1 - Revenue Overview (Finance and Executive)
Gross revenue, net revenue (post-refund), and revenue by payment gateway
Daily and monthly trend lines with prior-period and prior-year comparison
Average order value (AOV) and total order count
Revenue by geography - province-level breakdowns for Canadian retailers operating under PIPEDA-compliant regional data governance
Refund rate and coupon discount rate as a percentage of gross revenue
Page 2 - Product Performance (Merchandising and Supply Chain)
Revenue and units sold by product SKU and category
Revenue concentration: what share of gross revenue comes from the top 10 SKUs?
Product-level conversion rate, using GA4 session data blended into Looker Studio for session-to-purchase attribution
Out-of-stock and low-inventory indicator, drawn from a daily product snapshot table loaded alongside order records
Page 3 - Customer Acquisition and Retention (Marketing and Growth)
New vs. returning customer split by month
Customer lifetime value (CLV) cohort chart: first-purchase cohort month on the Y-axis, cumulative spend at 3, 6, and 12 months on the X-axis
Acquisition channel breakdown from UTM source and medium stored in WooCommerce order metadata
90-day churn indicator: customers who have not reordered in the past 90 days as a percentage of the active base
For teams building department-level reporting alongside their commerce data, healthcare KPI dashboard examples by department shows how the same three-layer structure - executive overview, operational detail, cohort - applies to clinical and financial reporting using the identical Looker Studio toolset.
How Do You Build the Revenue Page in Looker Studio?
Step 1 - Data source configuration. Connect your BigQuery flat view or partner connector. If you need channel attribution joined to revenue, add a GA4 data source and use Looker Studio's blended data feature to join sessions to orders on a shared session ID or order confirmation ID.
Step 2 - Date range control. Place a date range control at the top of the canvas and link it to every chart on the page. Finance directors typically compare the current month against the prior month and the same month last year - enable Looker Studio's comparison date range feature to surface both comparisons without custom SQL.
Step 3 - Scorecard row. Four scorecards across the top: Gross Revenue, Net Revenue, AOV, and Order Count, each in comparison mode against the prior period. This row delivers the executive summary any stakeholder reads in the first ten seconds.
Step 4 - Revenue trend line. A time-series chart with Gross Revenue on the metric axis and Date on the dimension axis. Add a reference line at the monthly revenue target, stored as a BigQuery constant or a Looker Studio parameter. This makes shortfalls visible without requiring viewers to perform mental arithmetic.
Step 5 - Revenue by geography. A filled map or sorted horizontal bar chart by country and state or province. For a Canadian manufacturing company selling industrial consumables online, provincial segmentation aligns the dashboard with regional sales territories and supports PIPEDA-compliant customer data governance practices.
Step 6 - Refund and discount table. A table showing Order Status (completed, refunded, partially refunded) with count and percentage of total. Finance teams at SOC 2-audited organizations frequently include this table in monthly control evidence packages - design it for export by keeping column headers clean and descriptive from day one.
How Do You Create a Reusable WooCommerce Looker Studio Template?
A reusable template separates design and business logic from any single dataset. All chart definitions, calculated fields, and filter configurations live in the Looker Studio report itself, not in the data source. When a new WooCommerce store comes online - a new brand, subsidiary, or client account - an analyst copies the report and reconnects it to a new BigQuery dataset. Every chart, calculated field, and filter carries over automatically.
To build a portable and maintainable template:
1. Standardize the BigQuery schema across all WooCommerce stores: identical column names, data types, and grain (one row per order line item). Enforce this contract at the ETL layer so schema drift cannot silently break the template downstream.
2. Define all calculated metrics at the data source level, not inside individual charts. CLV formulas, AOV calculations, and 90-day churn flags defined at the source survive the copy operation and remain consistent across every connected report.
3. Use report-level filters rather than chart-level filters. Report-level filters apply to the entire page and cannot be accidentally removed on a single visualization, preventing data leakage in multi-brand environments where different stakeholders share the same report shell.
4. Apply BigQuery authorized views for row-level security when multiple brands or clients share one dataset. An authorized view filtered on a brand_id column means each connected report sees only its brand's rows, regardless of how the Looker Studio report is configured.
5. Version-control the template with a Looker Studio text overlay on a hidden configuration page, listing the required BigQuery schema columns, the reconnection procedure, and the version date. This makes onboarding a new data engineer straightforward and reduces long-term maintenance risk.
Teams managing multiple WooCommerce storefronts for distinct product lines find that standardizing this template pattern significantly reduces per-store deployment time - the schema contract and pre-built calculated fields eliminate the rebuild work that otherwise repeats for every new store. A UK fintech operating a main brand and two white-label partners under one GCP project uses BigQuery authorized views to simultaneously satisfy GDPR data isolation requirements and eliminate redundant infrastructure costs.
For the data governance principles that underpin this architecture, AI analytics data privacy risks: healthcare audit guide covers data lineage, access control, and audit trail design - principles directly applicable to any multi-tenant Looker Studio deployment.
How Do People-Ops Teams Build a Compliant Looker Studio HR Dashboard Template?
The same BigQuery and Looker Studio architecture used for commerce reporting is increasingly adopted by people-operations teams building employee-analytics dashboards - particularly at organizations with workforces spanning the US, UK or EU, and Canada, where data-residency obligations and anonymisation rules differ materially by jurisdiction.
A well-designed Looker Studio HR dashboard template for a multi-region employer typically covers headcount and attrition trends, compensation equity analysis, time-to-hire by department, and absence or leave utilization. The underlying data model follows the same three-tier structure used in commerce reporting: an executive summary page, a departmental operational detail page, and a cohort analysis page tracking workforce composition over rolling 12-month windows. Because the anonymisation and row-level security rules are embedded in the BigQuery layer rather than the report itself, regional HR teams inherit them automatically when they copy the template and reconnect it to their own dataset - the same portability benefit that makes the WooCommerce multi-brand template pattern so durable.
Data-Residency Choices by Jurisdiction
United States. Federal law imposes no single employee-data residency mandate, but state privacy laws - California's CPRA and Virginia's CDPA among them - grant employees rights of access and deletion. HR analytics teams at US organizations typically store BigQuery datasets in the `us-central1` or `us-east1` regions and apply column-level security to mask Social Security numbers, salary bands, and health-related leave codes before Looker Studio ever queries them. Where wellness programs or leave records intersect with HIPAA-protected information, the same data-lineage controls used for healthcare e-commerce apply directly.
United Kingdom and European Union. GDPR (UK GDPR post-Brexit) treats employee data as personal data subject to the same obligations as customer data. Cross-border reporting from a UK parent company to a US analytics team requires either an adequacy decision, Standard Contractual Clauses, or Binding Corporate Rules. The practical implementation is a separate BigQuery dataset pinned to the `europe-west2` (London) or `europe-west1` (Belgium) region, with an authorized view that pre-aggregates data to the team level before it crosses region boundaries. Only the aggregate view is exposed to the Looker Studio report used by US-based people-ops leadership, so no individual-level personal data leaves the EU/UK processing environment.
Canada. PIPEDA requires that personal employee information be protected by contractual safeguards when transferred to a third-party processor - which includes Google Cloud. Canadian HR teams using BigQuery store datasets in the `northamerica-northeast1` (Montreal) region to keep data within Canada, and document the Google Cloud data-processing addendum as part of their PIPEDA accountability evidence.
Anonymisation Patterns for Cross-Border Reports
Three patterns prevent re-identification when aggregated HR data flows across jurisdictions:
1. Minimum cell size suppression. Any dimension combination - department, gender, performance band - with fewer than five employees is suppressed in the Looker Studio report using a calculated field that returns null below the threshold. This prevents inference attacks where a single employee in a small cohort is effectively identified by their metric value.
2. Role-based row-level security. BigQuery authorized views filter employee records by a `home_region` column, ensuring a UK-based HR business partner sees only UK headcount rows while a global CHRO sees a pre-aggregated cross-region view with no individual-level salary or leave data visible.
3. Pseudonymisation at load time. The ETL pipeline that loads HR system exports into BigQuery replaces employee IDs with a deterministic hash keyed to a secret held only in Secret Manager. Looker Studio reports never expose the source system's employee ID; cohort tracking uses the pseudonymous key, which can be reversed only by the data engineering team under a documented access-request procedure.
For HR teams at healthcare organizations where employee wellness programs intersect with HIPAA-protected leave records, AI analytics data privacy risks: healthcare audit guide covers the data-lineage and access-control design principles that apply equally to clinical and workforce analytics workloads.
When Should You Use BigQuery vs a Partner Connector for WooCommerce?
Most teams can configure a partner connector and build basic scorecards without outside help. The case for a BigQuery pipeline becomes clear when any of the following applies:
Regulatory obligations require documented data lineage, IAM-controlled access logs, and exportable audit evidence (HIPAA, GDPR, SOC 2, PIPEDA).
Data volume exceeds 50,000 orders per month and the connector's daily-refresh cycle introduces a meaningful reporting lag.
Multi-source analytics is a requirement - joining WooCommerce orders with a CRM, GA4, or an ERP system in a single Looker Studio report.
Reusability at scale matters - a template that a junior analyst can safely deploy to a new store in under two hours without rebuilding metrics or risking data leakage.
A 2026 World Economic Forum report found that over 75 percent of financial services, healthcare, and e-commerce organizations have now formalized data governance standards for analytics and AI workloads - a roughly 50 percent increase from 2024 - driven by expanding AI adoption and cross-border regulatory alignment. That governance pressure extends directly to e-commerce reporting: a WooCommerce dashboard built without documented data lineage will face increasing scrutiny from internal audit functions and external regulators across US, UK, and Canadian markets.
For broader platform context, the Google Looker pricing 2026 guide and the Looker vs Power BI cost comparison at 50-500 seats cover the platform economics that CIOs and finance directors use to frame this architecture decision.
Ready to build a WooCommerce analytics layer your finance team relies on every week? Explore our Certified Looker Studio consulting to see how we scope, build, and maintain production-grade dashboards for mid-market clients across healthcare, financial services, and e-commerce.
---
About Lets Viz: Lets Viz has delivered data analytics and dashboard solutions for clients across US healthcare, UK fintech, Canadian manufacturing, and global SaaS across six-plus years since 2020, earning a 5.0 rating on Clutch. Our certified analysts combine production-grade Looker Studio architecture with deep knowledge of HIPAA, GDPR, and PIPEDA compliance requirements, ensuring every dashboard we build is audit-ready from day one.
---