How to Learn Power BI Coming from Tableau: Skills Map
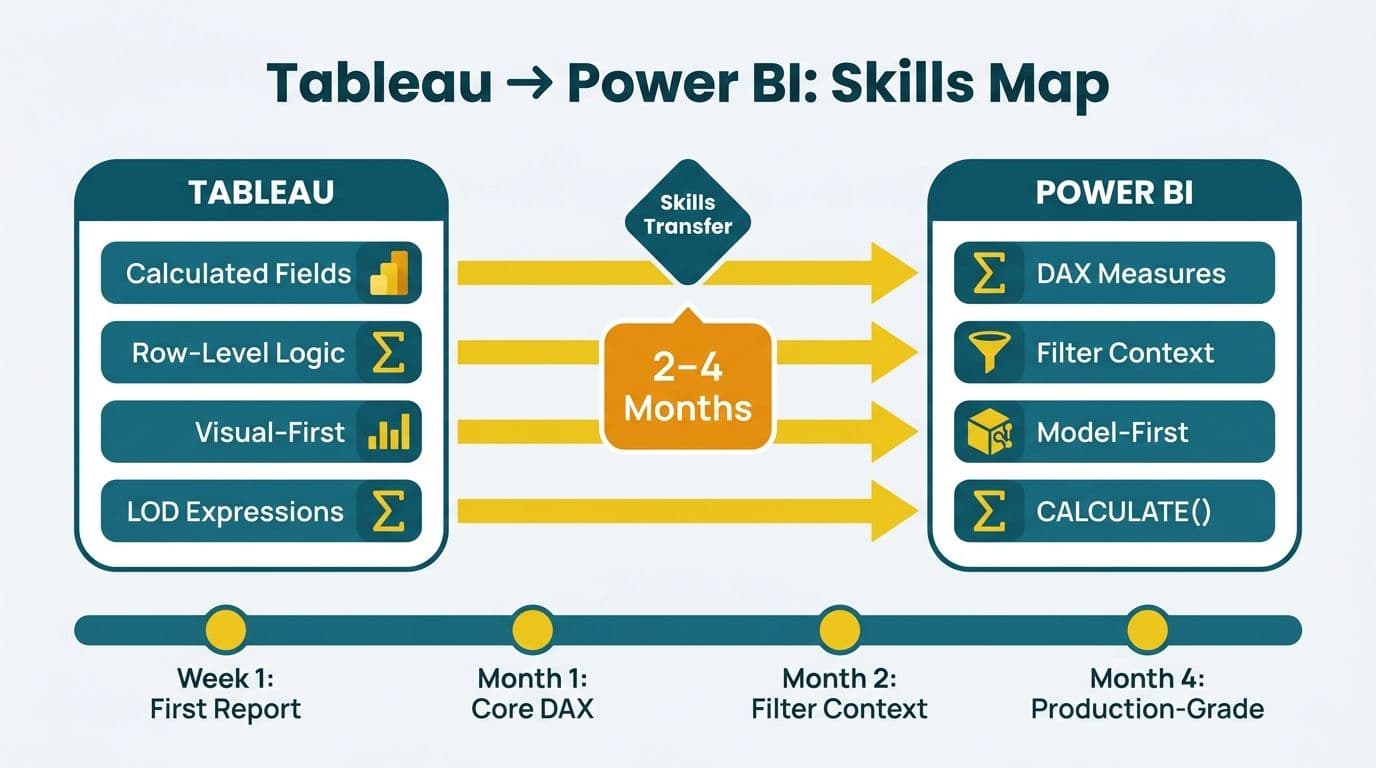
Experienced Tableau analysts can build their first functional Power BI report within a week, but production-grade competence typically takes two to four months. The critical insight is that your data intuition transfers directly - what changes is the execution layer: Power BI uses a model-first architecture where DAX expressions evaluate within filter contexts, replacing Tableau's row-level calculated fields and visual-centric grammar.
Key Takeaways
DAX and Tableau calculated fields solve the same problems through fundamentally different mechanisms - DAX evaluates within a filter context; Tableau calculated fields evaluate row by row.
Power Query replaces Tableau Prep for data transformation, but it operates before the model is loaded, not during visualization.
Row-level security in Power BI is enforced at the model layer, not the view layer - a structural difference that changes how you design for regulated environments.
Tableau analysts typically spend 60-70% of retraining time on DAX and the model-first mindset, not on the report canvas (as of 2026, based on Lets Viz client migration data across US, UK, and Canadian teams).
For healthcare and finance teams, Power BI's native compliance integrations and Microsoft Purview audit trail make the migration strategically sound.
How Does Power BI's Architecture Differ from Tableau for Experienced Analysts?
Power BI separates data transformation, modeling, and visualization into three distinct phases: Power Query, the semantic model, and the report canvas. Tableau collapses these into a more unified visual grammar. This separation is the root cause of most conceptual friction during the transition.
For teams planning a formal migration, Tableau to Power BI migration services cover this architectural remapping as part of a structured engagement, including semantic model validation, DAX translation, and governance setup.
| Dimension | Tableau | Power BI |
|---|---|---|
| Primary design paradigm | Visualization-centric | Model-centric |
| Data connection scope | Per workbook | Shared semantic model |
| Transformation layer | Tableau Prep (external) | Power Query (built in) |
| Reusability | Per data source | Measures reused across all reports |
| Governance layer | Workbook permissions | Semantic model roles + Microsoft Purview |
DAX vs. Tableau Calculated Fields: What Is the Real Difference?
Tableau calculated fields are row-level by default and become aggregated only when placed on a shelf. DAX, by contrast, always evaluates within a filter context - the intersection of slicer selections, row headers, column headers, and any CALCULATE overrides active at that moment.
This is the single most important conceptual shift. A Tableau analyst writing `SUM([Sales]) / SUM([Target])` gets a ratio that respects whatever level of detail the view defines. The equivalent DAX measure - `DIVIDE(SUM(Sales[Amount]), SUM(Budget[Target]))` - evaluates under the current filter context of the visual, which produces unexpected results if relationships are ambiguous or multiple fact tables are involved.
The COUNTX vs. COUNT distinction in Power BI DAX illustrates this clearly. `COUNT` counts non-blank values in a column across the filtered table. `COUNTX` iterates a table row by row and counts the result of an expression - a critical difference when building Power BI P&L dashboard examples or patient-visit tallies where subtotals must reconcile with row-level detail exactly.
A UK fintech firm rebuilding its FP&A reporting suite in Power BI reported that the filter context concept required roughly three weeks of hands-on practice before analysts felt confident in peer review. The payoff: their P&L dashboards passed audit with zero measure restatements in the first quarter post-migration.
| Tableau Pattern | Power BI / DAX Equivalent | Key Difference |
|---|---|---|
| Calculated field (row level) | Calculated column | Stored in model at refresh; no filter context |
| Calculated field (aggregate) | Measure | Evaluated dynamically in filter context |
| LOD FIXED | CALCULATE with REMOVEFILTERS | Explicit filter override |
| LOD INCLUDE | CALCULATE + SUMMARIZE | Adds granularity to current context |
| LOD EXCLUDE | CALCULATE with ALLEXCEPT | Removes specific filter columns |
| Table calculation (window) | RANKX, TOPN, iterator functions | Operates on table expressions, not visual partitions |
For deeper DAX mechanics, the SUMX vs SUM in Power BI guide and the ALLSELECTED DAX function explained cover iterator and context behavior with annotated examples.
Power Query vs. Tableau Prep: How Should Analysts Approach the Transition?
Tableau Prep is a visual, step-based ETL tool where each transformation is visible as a flow node. Power Query (M language) operates inside Power BI Desktop as a formula-driven transformation engine - each step generates an M expression readable and editable in the Advanced Editor.
The practical difference: Tableau Prep is closer to a drag-and-drop data pipeline; Power Query is closer to a typed query language with a GUI layer on top. Most Prep transformations - joins, pivots, aggregations, type coercion - map directly to Power Query steps. The key adjustment is understanding that Power Query runs before the model loads, not on demand per visual.
Transformation Equivalents
Tableau Prep flow - Power Query query (one M query per source)
Tableau Prep aggregate step - Power Query Group By
Tableau Prep pivot - Power Query Unpivot Columns or Pivot Columns
Tableau Prep join - Power Query Merge Queries
Tableau Prep cleaning step - Power Query Replace Values or custom column formula
A Canadian manufacturing company migrating supply chain dashboards found that replicating their Tableau Prep flows in Power Query took 40% less calendar time than the original Prep build. M language handled recursive joins and parameterized data source connections more naturally than Prep's node-based GUI.
For organizations evaluating the broader Microsoft data platform, the Microsoft Fabric vs Synapse vs Databricks: TCO Cost Breakdown provides context on where Power Query fits within a Microsoft Fabric lakehouse architecture and when Dataflows Gen2 should replace it for enterprise-scale pipelines.
How Does Row-Level Security Differ Between Power BI and Tableau?
In Tableau, row-level security (RLS) is typically enforced at the data source level - through user filters applied to extracts or calculated fields comparing `USERNAME()` against a reference table. In Power BI, RLS is enforced at the semantic model layer using DAX filters attached to roles. Reports connect to the model; the model enforces access. Individual reports carry no security logic.
For a US healthcare organization building HIPAA-compliant BI tools for hospital data visualization, model-layer RLS delivers three compliance advantages: security is auditable independently of individual reports, new reports built on the same model inherit RLS automatically, and Microsoft Purview logs row-level access events for compliance review.
For UK and EU organizations subject to GDPR, and Canadian organizations governed by PIPEDA, model-layer enforcement provides a single audit point for data residency and access controls - far simpler to demonstrate to regulators than a per-workbook filter approach.
| Dimension | Tableau | Power BI |
|---|---|---|
| Where enforced | Data source / extract filter | Semantic model DAX role |
| Assigned to | User or group at workbook level | Azure AD group via workspace role |
| New report inherits security | No - must re-apply per workbook | Yes - automatic through model role |
| Audit trail | Depends on data source logging | Microsoft Purview / Activity Log |
| Dynamic RLS | USERNAME() calculated field | USERNAME() or USERPRINCIPALNAME() in role filter |
What Conceptual Shifts Matter Most When Learning Power BI from Tableau?
Beyond the tool mechanics, four conceptual shifts separate Tableau analysts who adapt quickly from those who struggle:
1. Model first, visual second. Tableau analysts instinctively open a blank canvas and drag dimensions onto shelves. Experienced Power BI practitioners spend 60-70% of project time in the data model before opening the report canvas. A well-designed star schema makes every subsequent DAX measure straightforward; a poorly designed one creates cascading errors that are hard to trace.
2. Relationships replace joins. Tableau uses data-source-level joins and blends. Power BI uses relationships between tables defined once in the model. Dimension tables - dates, products, geographies - are shared across all measures, which is the foundation of a proper star schema.
3. Measures are portable; calculated columns are not. In Tableau, a calculated field is attached to a data source. In Power BI, a measure can be defined in any table and referenced by any report connected to that model, enabling a central measure library that standardizes KPI definitions across business units.
4. Context transition replaces table calculations. Tableau's table calculations (WINDOW_SUM, LOOKUP, RANK) operate on the visual partition. DAX iterators (SUMX, RANKX, TOPN) operate on table-valued expressions under filter context. Instead of asking what rows are visible in this view, you ask what table you are iterating and what filters are currently active.
The Cognos to Power BI DAX Translation Guide covers context-transition patterns with annotated examples - useful even for non-Cognos analysts because the filter context mechanics are identical across all migration paths.
Power BI in Healthcare and Finance: Compliance and Visualization Best Practices
Healthcare Analytics
The question of how to present hospital data to non-clinical stakeholders is a governance and design challenge that Power BI handles through layered report design. Bookmarks, report themes, and tooltip pages let analysts build an executive summary with trend lines and variance-to-budget alongside a detailed clinical view - both drawing from the same HIPAA-compliant semantic model.
Best chart types for hospital dashboards typically include small multiples for patient cohort comparisons, bullet charts for KPI versus target, and Sankey diagrams for patient flow - all available natively or via certified visuals in AppSource. For data visualization examples in public health contexts, Power BI's native connector to Azure Health Data Services and FHIR R4 APIs (available as of 2026 without custom middleware) enables real-time operational dashboards for population health management - a connector gap that previously pushed healthcare teams toward Tableau's third-party integration workarounds.
Finance Analytics
The FP&A and financial close use case is where Power BI's DAX depth delivers the largest dividend for experienced Tableau analysts. Power BI P&L dashboard examples built with proper time-intelligence DAX - SAMEPERIODLASTYEAR, PARALLELPERIOD, DATESYTD - produce auditable, reproducible statements that Tableau's table calculations cannot replicate with equivalent reliability at enterprise scale. In 2026, Power BI Copilot's integration into the DAX query view lets finance analysts generate first-draft time-intelligence scaffolding via natural language prompts; Lets Viz client teams report roughly 25-30% faster initial measure authoring on standard FP&A patterns, though structured peer review of generated DAX remains essential before any measure reaches a financial close report.
Data teams that build deep Power BI capability now - including finance-grade DAX and secure semantic model design - are positioned to lead that capability build. The FP&A Dashboard in Power BI: A Step-by-Step Build Guide walks through the exact DAX patterns finance analysts use most.
How to Learn Power BI Coming from Tableau: A Structured Skills Roadmap
For a Tableau-certified analyst targeting production readiness in two to three months, this is the recommended learning sequence:
Weeks 1-2: Model and Power Query foundations
Build a star schema from a familiar dataset
Replicate three existing Tableau Prep flows in Power Query
Complete Microsoft's PL-300 learning path modules 1 through 3
Weeks 3-5: DAX fundamentals
Implement SUM, CALCULATE, FILTER, ALL, and RELATED
Rebuild five existing Tableau calculated fields as DAX measures
Practice filter context isolation using CALCULATE vs. CALCULATETABLE comparisons
Weeks 6-8: Advanced DAX and row-level security
Implement time intelligence (SAMEPERIODLASTYEAR, DATESYTD, DATESBETWEEN)
Configure static and dynamic RLS in a test workspace
Build a model-layer measure library for a single business domain such as sales or finance
Weeks 9-12: Enterprise patterns
Connect to a shared semantic model via XMLA endpoint
Publish to Power BI Service and configure an on-premises data gateway
Review Microsoft Fabric lakehouse architecture basics if the organization plans a broader Fabric migration
For analysts whose Tableau work included paginated report production, the Power BI Report Builder vs Desktop: Finance Guide covers the pixel-perfect report capabilities that Power BI Desktop alone does not address.
---
About Lets Viz: Lets Viz has delivered analytics and BI transformation engagements since 2020, serving US healthcare systems, UK fintech firms, Canadian manufacturing organizations, and global SaaS companies. The team holds a 5.0 Clutch rating and specializes in Power BI semantic model architecture, DAX development, and regulatory-compliant dashboard design across HIPAA, GDPR, and PIPEDA environments.
Tableau to Power BI migration services provide structured skills transfer, model validation, and DAX translation as part of a managed engagement - purpose-built for analytics teams making this transition.