ALLSELECTED DAX Function in Power BI: Filter Context Explained
`ALLSELECTED` is a DAX function in Power BI that clears visual-level filter context while preserving the outer filter context - the filters set by slicers, page filters, and report filters. Where `ALL` ignores every filter silently, `ALLSELECTED` keeps slicer selections intact, making it the correct choice for running totals, grand total percentages, and period-over-period ratios in interactive reports.
Key Takeaways
`ALLSELECTED` preserves outer filter context (slicers, page filters) while clearing row-level context within visuals; `ALL` removes every filter unconditionally.
Three scenarios where `ALL` silently produces wrong numbers: running totals, percentage of grand total, and period-over-period ratios in sliced reports.
`ALLSELECTED` with no arguments captures the full outer filter context rather than targeting a specific column - useful in iterators but easy to misuse in nested CALCULATE chains.
In regulated industries, incorrect denominators in DAX measures create compliance documentation gaps alongside accuracy errors, not just cosmetic display issues.
For teams evaluating the true build cost of a DAX-heavy Power BI implementation, the Instant project cost calculator gives a vendor-neutral starting estimate before any scoping conversation.
What Is the ALLSELECTED DAX Function in Power BI?
`ALLSELECTED` is a table function and filter modifier in DAX (Data Analysis Expressions), Power BI's formula language. It returns all rows from a table or all values from a column while respecting the outermost filter context - specifically the filters applied by slicers, page-level filters, and report-level filters active at query time.
It was introduced to solve a real gap: developers needed a way to write denominator measures that reflected "what the user has filtered to" rather than "everything in the model." The function signature is:
```dax
ALLSELECTED([TableNameOrColumnName])
```
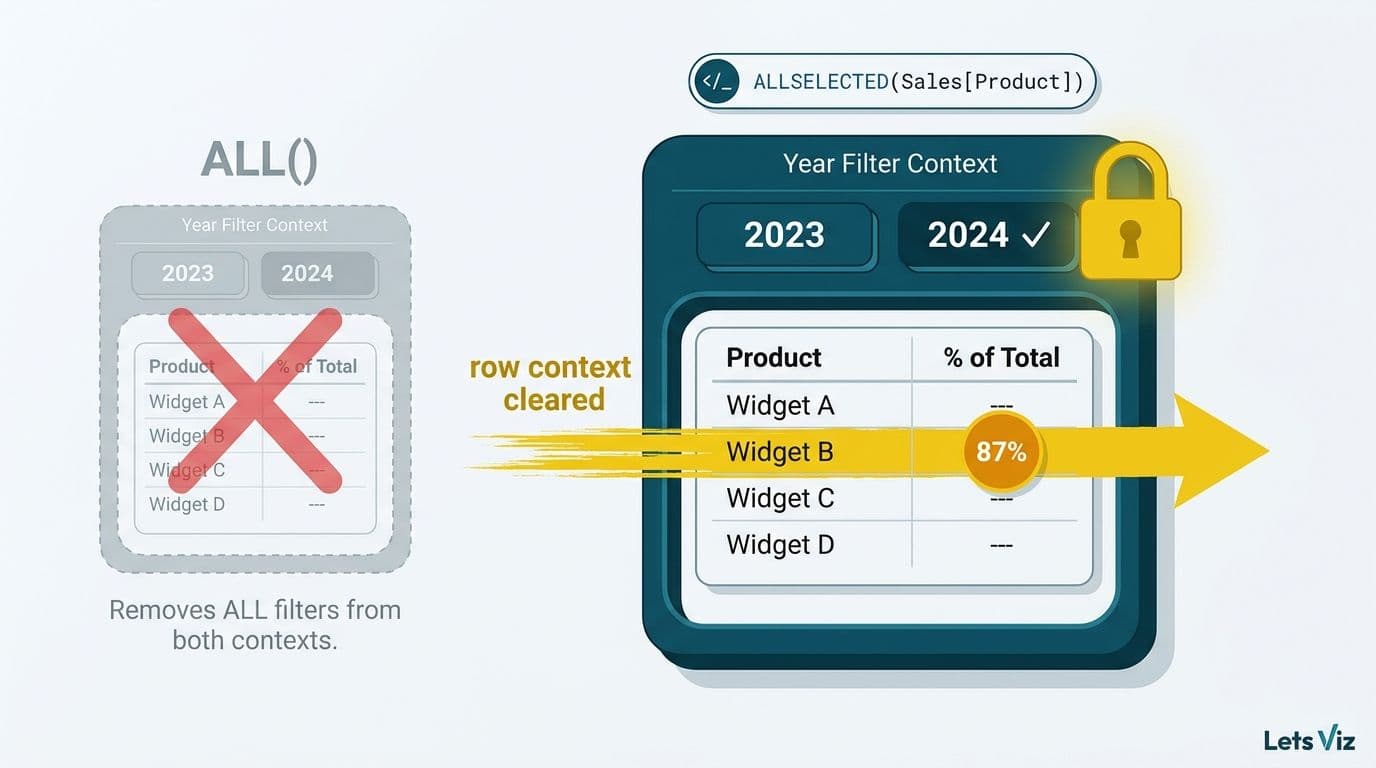
When called with no arguments inside an iterator, it captures the entire outer filter context. When called with a column reference - for example, `ALLSELECTED(Sales[Product])` - it clears only that column's filter context while leaving all other filters intact.
The Healthcare Financial Analytics Market is projected to grow at an 8.58% CAGR from 2026 to 2035, driven by demand for real-time clinical and financial reporting (Market Research Future, 2026). In that environment, a denominator that accidentally ignores slicer selections - because a developer reached for `ALL` instead of `ALLSELECTED` - can produce materially incorrect utilization rates and cost-per-case figures in hospital patient flow and bed capacity dashboards.
How Does Filter Context Differ from Outer Filter Context in DAX?
Filter context is the set of filters active at the moment a DAX expression is evaluated. In a Power BI visual, two layers of filter context are always present simultaneously.
The inner filter context is generated by the visual itself - the row headers in a matrix, the category axis in a bar chart. Each row or bar introduces a context that scopes calculations to a single product, time period, or category.
The outer filter context is everything applied above the visual level: slicer selections, page filters, report filters, and cross-filter propagation from other visuals. This context is set by the user at interaction time, not by the visual's own structure.
`ALL` destroys both layers. `ALLSELECTED` destroys only the inner layer and preserves the outer layer.
That asymmetry is the entire practical point of the function. A matrix showing monthly sales with a region slicer set to Northeast should use the Northeast total as its denominator for percentage calculations - not the global model total. `ALL` gives you the global model total. `ALLSELECTED` gives you the Northeast total.
According to medinsight.com (2026), three themes are dominating healthcare analytics strategy through 2026: value-based care, AI-driven analytics, and payer analytics innovation. Each depends on segmented, slicer-driven reporting where denominators must reflect the filtered patient population, not the global universe - making correct filter context a functional requirement, not an optimisation.
When Should You Use ALLSELECTED Instead of ALL in DAX Measures?
Use `ALLSELECTED` whenever the denominator of a ratio, the starting point of a running total, or the baseline of a comparison must reflect what the user has filtered to in the current view.
Here are the three precise scenarios where `ALL` breaks and `ALLSELECTED` fixes:
1. Running totals in a sliced date table
A running total accumulates values from the start of a period through the current row. The standard pattern uses `ALL(Dates[Date])` with a `<=` filter to accumulate - but `ALL` removes the date table from the slicer's scope entirely. If a user slices to Q3 only, the running total restarts at January 1 instead of July 1, and the cumulative figure is meaningless for the Q3 review being conducted. Replacing `ALL(Dates[Date])` with `ALLSELECTED(Dates[Date])` makes the accumulation start at the slicer's earliest visible date.
2. Percentage of grand total
The classic pattern `CALCULATE([Total Sales], ALL(Sales))` calculates each row's share of the entire model total. Add a country slicer selecting Canada and the denominator stays at the global total - so Canadian rows sum to perhaps 8% rather than 100%. The fix: `CALCULATE([Total Sales], ALLSELECTED(Sales))`. Now the denominator is the total for Canada, and the column correctly sums to 100% within the slicer's scope.
3. Period-over-period ratios in date-sliced reports
A year-over-year ratio uses `DATEADD` or `SAMEPERIODLASTYEAR` to fetch the prior period. If the denominator is an `ALL`-based total, the ratio shifts unexpectedly when users change the date slicer, because the reference total is no longer aligned with the visual's actual date range. `ALLSELECTED` keeps the reference total scoped to whatever date range is currently visible.
For teams building these patterns at scale, the Power BI Import vs DirectQuery decision guide covers query mode implications that affect how `ALLSELECTED` behaves across storage modes - a distinction that matters in large regulated-industry datasets where DirectQuery is often required for data recency.
ALLSELECTED vs ALL: A Direct Comparison
The table below contrasts the two functions across the scenarios that matter most in production reports.
| Scenario | ALL Behavior | ALLSELECTED Behavior |
|---|---|---|
| Running total with date slicer | Ignores slicer - accumulates from model start | Respects slicer - accumulates from first visible date |
| % of grand total with region slicer | Uses global model total as denominator | Uses slicer-filtered total as denominator |
| YoY ratio in sliced report | Reference total includes all periods | Reference total scoped to selected period |
| No slicer or no active filter | Identical - both remove all filters | Identical |
| Called with no arguments in iterator | Removes all filters from all tables | Captures full outer filter context |
| Performance in DirectQuery models | Generally faster - simpler query plan | Marginally higher overhead on very large models |
| Risk of silent wrong answers | High when slicers are present | Low - designed for interactive slicer-driven reports |
If any row in the scenario column describes your current measure, `ALLSELECTED` is the safer default unless you have an explicit reason to compute against the full unfiltered model.
How Does the No-Argument Form of ALLSELECTED Work in Power BI DAX?
The no-argument form - `ALLSELECTED()` - is the most misunderstood variant. Without a table or column argument, it does not target a specific filter. Instead, it captures the entire outer filter context of the current query session.
This is useful inside iterating functions like `SUMX` or `CALCULATE` where you want to reference the full slicer state without specifying which column to release. But it creates a subtle trap: if there is no outer context - for example, the measure is evaluated inside another `CALCULATE` that has already established a new filter context - `ALLSELECTED()` may behave identically to `ALL()`.
The practical rule: use `ALLSELECTED(TableName)` or `ALLSELECTED(ColumnName)` with explicit references when you know which filter layer you want to preserve. Reserve the no-argument form for advanced iterator patterns where you have tested its scope behavior against real slicer interactions in your specific data model.
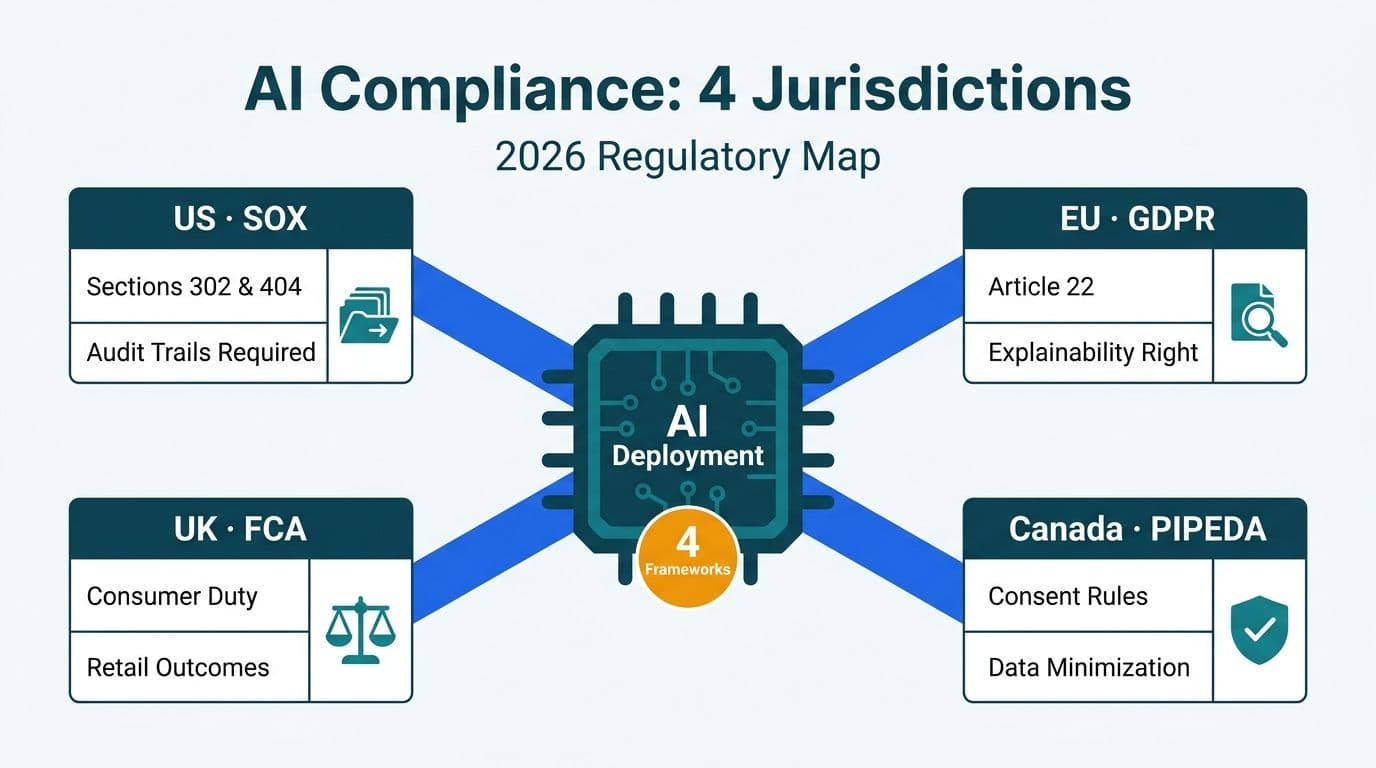
Why Regulated Industries Cannot Afford Silent DAX Errors
In regulated industries, the difference between a measure using `ALL` and one using `ALLSELECTED` is not just an accuracy issue - it is a compliance documentation issue.
A US healthcare analytics team building Power BI dashboards for HIPAA-compliant clinical reporting needs patient cohort percentages to reflect the filtered population. If the denominator uses `ALL`, a physician reviewing a slicer-filtered report sees percentages that sum to less than 100% - because the denominator is the entire hospital population, not the filtered department cohort. That inconsistency erodes trust and creates audit documentation gaps. See Power BI consulting for healthcare organizations for how a DAX denominator audit fits into a compliant implementation review.
A UK fintech firm subject to GDPR data minimisation requirements typically restricts analysts to specific product lines or customer segments via row-level security and slicer defaults. If a DAX measure bypasses those slicer boundaries by using `ALL` where `ALLSELECTED` was intended, reported figures can inadvertently aggregate data outside the analyst's permitted scope - a potential GDPR incident rather than just a display error. GDPR fines for data minimisation violations can reach €20 million or 4% of global annual turnover, meaning a single incorrectly scoped denominator measure is a regulatory liability, not a cosmetic bug.
A Canadian manufacturing organization operating under PIPEDA faces similar issues when building production dashboards for different plant sites. An `ALL`-based denominator means a plant manager's report includes capacity figures from other facilities, distorting efficiency ratios and potentially triggering incorrect procurement decisions.
The AI consulting services market is forecast to grow from USD 14.0 billion in 2026 to over USD 90 billion by 2035 at a 26.2% CAGR (Future Market Insights, 2026). As more regulated-industry teams embed analytics into daily decision workflows, the cost of silent DAX errors scales with that adoption. A single incorrectly specified denominator measure, replicated across dozens of reports, becomes a systemic accuracy risk that is far harder to remediate after deployment.
For healthcare teams building departmental views, the healthcare KPI dashboard examples by department article demonstrates how correct filter context directly determines the reliability of clinical performance metrics.
Power BI row level security and ALLSELECTED interaction: Power BI row level security for healthcare data operates at the model level and cannot be bypassed by DAX filter functions. `ALLSELECTED` correctly preserves both the RLS boundary and the slicer filter simultaneously - returning only the slicer-visible rows within the rows RLS permits. `ALL` also cannot bypass RLS, but it clears the slicer, returning all RLS-permitted rows regardless of slicer state. Teams building healthcare dashboard templates and hospital patient flow or bed capacity dashboards need to understand this interaction: the slicer boundary and the RLS boundary serve different purposes and must both be accounted for in denominator design.
Practical DAX Patterns for the Three Core Scenarios
The three production-ready patterns below address the failures described earlier. Each replaces an `ALL` call with `ALLSELECTED` in exactly the position where the outer filter context matters.
Running total that respects a date slicer:
```dax
Running Total Sales =
CALCULATE(
[Total Sales],
FILTER(
ALLSELECTED(Dates[Date]),
Dates[Date] <= MAX(Dates[Date])
)
)
```
Percentage of slicer-filtered grand total:
```dax
% of Selected Total =
DIVIDE(
[Total Sales],
CALCULATE([Total Sales], ALLSELECTED(Sales))
)
```
Year-over-year growth scoped to selected period:
```dax
YoY Growth % =
VAR CurrentPeriod = [Total Sales]
VAR PriorPeriod =
CALCULATE(
[Total Sales],
DATEADD(ALLSELECTED(Dates[Date]), -1, YEAR)
)
RETURN DIVIDE(CurrentPeriod - PriorPeriod, PriorPeriod)
```
`DATEADD` with `ALLSELECTED` works correctly only when the Dates table has a contiguous date range within the selected period. Test against non-contiguous selections - fiscal year gaps, custom calendar exclusions - before deploying in production environments.
Teams migrating from other BI tools will find the Tableau calculated fields to Power BI DAX conversion guide useful for mapping fixed LOD expressions - which share a conceptually similar outer-context scope - to their DAX equivalents, including these `ALLSELECTED` patterns.
How to Audit Existing Reports for ALL vs ALLSELECTED Errors
Many production Power BI reports use `ALL` where `ALLSELECTED` was intended, and the error stays invisible until a user applies a slicer and notices percentages that no longer sum correctly.
A systematic audit approach:
1. Search DAX measures for `ALL(` - any measure using `ALL(TableName)` or `ALL(ColumnName)` in a denominator or accumulation context is a candidate for review.
2. Test each measure with a slicer applied - add a simple slicer, select a subset, and check whether percentage totals sum to 100% and running totals start from the correct period boundary.
3. Check no-argument ALLSELECTED - any `ALLSELECTED()` without arguments inside a complex `CALCULATE` chain should be tested with nested filter contexts to verify it captures the intended outer context and does not silently collapse to `ALL()` behaviour.
4. Document the intended scope - for regulated-industry reports, add a measure description (via the Description property in Model view) stating whether the denominator is model-total or slicer-total. This supports audit trails for HIPAA, GDPR, and PIPEDA compliance reviews.
If your team is scoping a Power BI implementation that includes complex DAX measures - running totals, cohort percentages, or period-over-period ratios across regulated datasets - the Instant project cost calculator gives you a vendor-neutral starting estimate for the build.
---
About Lets Viz: Lets Viz is a data analytics consultancy serving US healthcare organizations, UK fintech firms, Canadian manufacturers, and global SaaS businesses since 2020. Our Power BI practice covers DAX architecture, HIPAA-compliant clinical dashboards, and data governance across regulated industries, and we hold a 5.0 Clutch rating across client engagements.