Data Relationships in Power BI

By Neetu Singla4 min read
Quick AnswerPower BI data relationships work by linking tables through shared key columns — typically a one-to-many join between a lookup/dimension table and a fact table — so that visuals and DAX measures can filter and aggregate data across multiple tables correctly. Setting these up requires matching column data types, choosing the right cardinality and cross-filter direction, and ensuring your model avoids ambiguous or circular paths.
Most Power BI data models involve data from many tables that must be connected via relationships. To slice and dice graphics utilizing data from different tables, well-prepared and well-thought-out tables with linkages are required.
This blog post goes through the fundamentals of Power BI connection modeling. This blog post will not go into why so many tables are required, or how to represent data across several tables.
 You’ll most certainly be analyzing data from many imported tables. Relationships between tables are required to calculate results and provide accurate information in reports. Power BI Desktop makes connection construction easier.
After linking two tables using a relationship, you may use the data in both tables as if they were a single table, without worrying about connection details or flattening those tables. Power BI Desktop can automatically create connections, so you may not need to. Power BI Desktop will not make connections if it cannot be certain that two tables are connected. As a result, connect.
You’ll most certainly be analyzing data from many imported tables. Relationships between tables are required to calculate results and provide accurate information in reports. Power BI Desktop makes connection construction easier.
After linking two tables using a relationship, you may use the data in both tables as if they were a single table, without worrying about connection details or flattening those tables. Power BI Desktop can automatically create connections, so you may not need to. Power BI Desktop will not make connections if it cannot be certain that two tables are connected. As a result, connect.
 Second, by clicking and dragging the column from one table into the column of another table where you want the connection to be made.
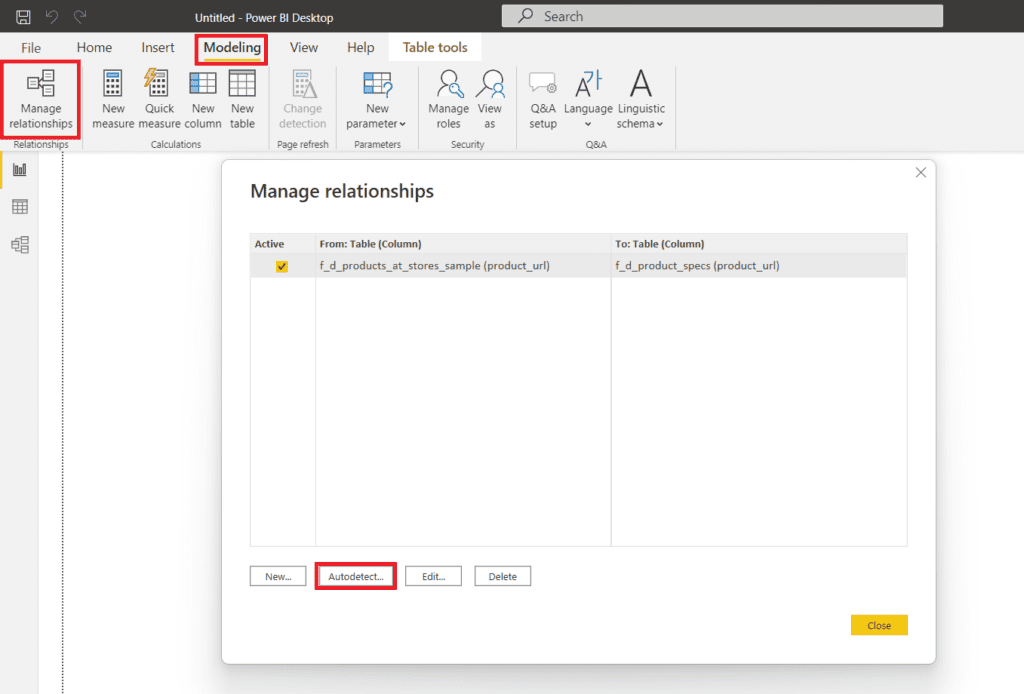
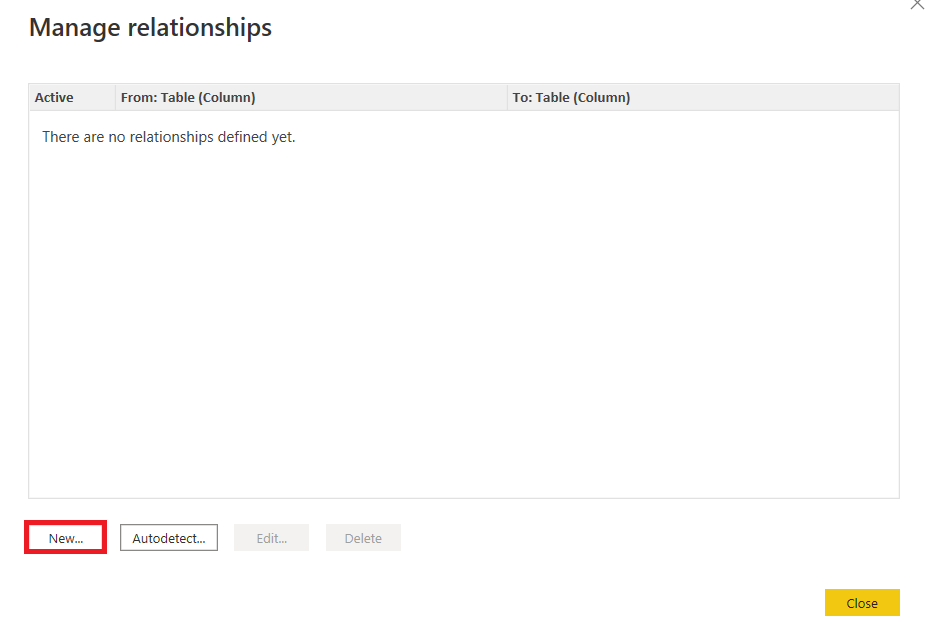
 Let’s start from the beginning and utilize the preceding example to construct a connection between our ‘f_d_product_specs’ and ‘f_d_products_at_stores_sample’ tables so that the tables are linked through relationships by choosing ‘Managing Relationships’. Let’s go with ‘New’.
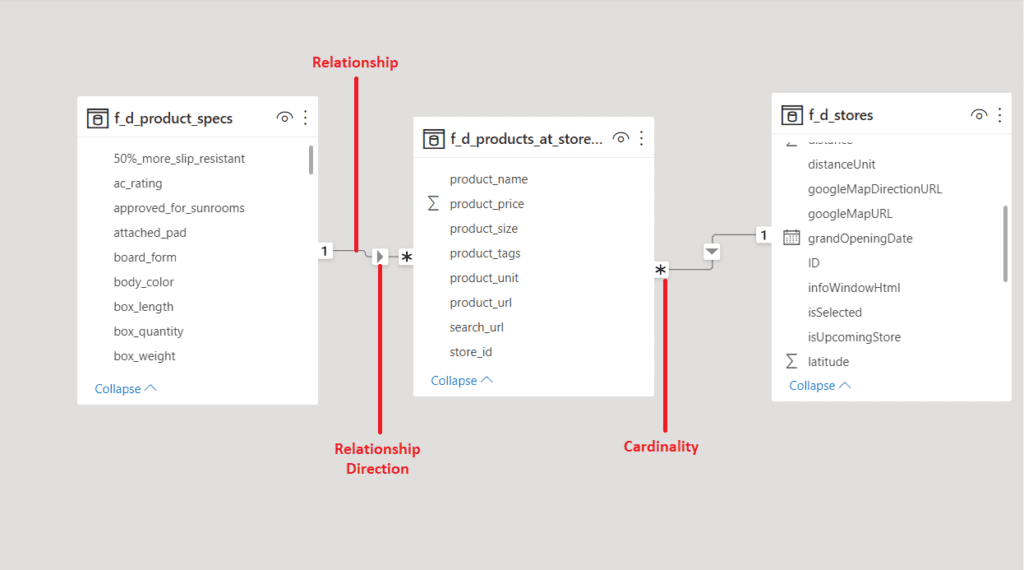
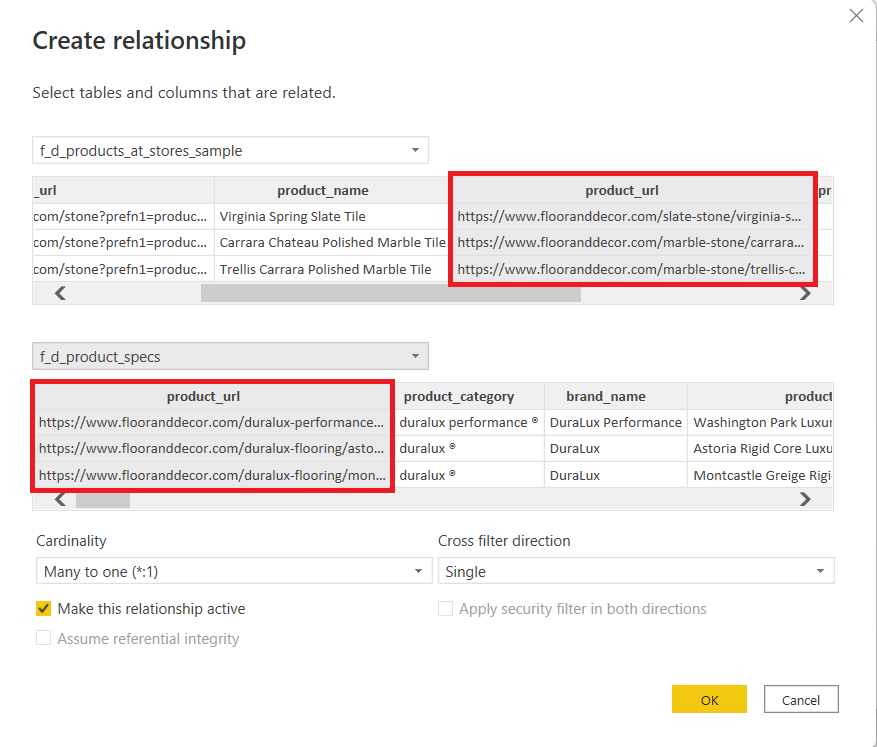
 Choose the two tables you wish to link with a relationship, as well as the columns (fields) that will connect them. You’ll note that Power BI attempts to determine the columns that will link your tables automatically. When your tables are properly configured, Power BI will generally get this correctly. The figure below shows that Power BI recognized the ‘product_url’ column as the field via which we would construct our link. This is the column that we want to utilize. Just keep in mind that column names do not have to be the same in order to join tables.
 Relationship Editing
It is critical to change your connections after your tables are linked by a column from each table. We shall look at two things here:
Relationship Editing
It is critical to change your connections after your tables are linked by a column from each table. We shall look at two things here:
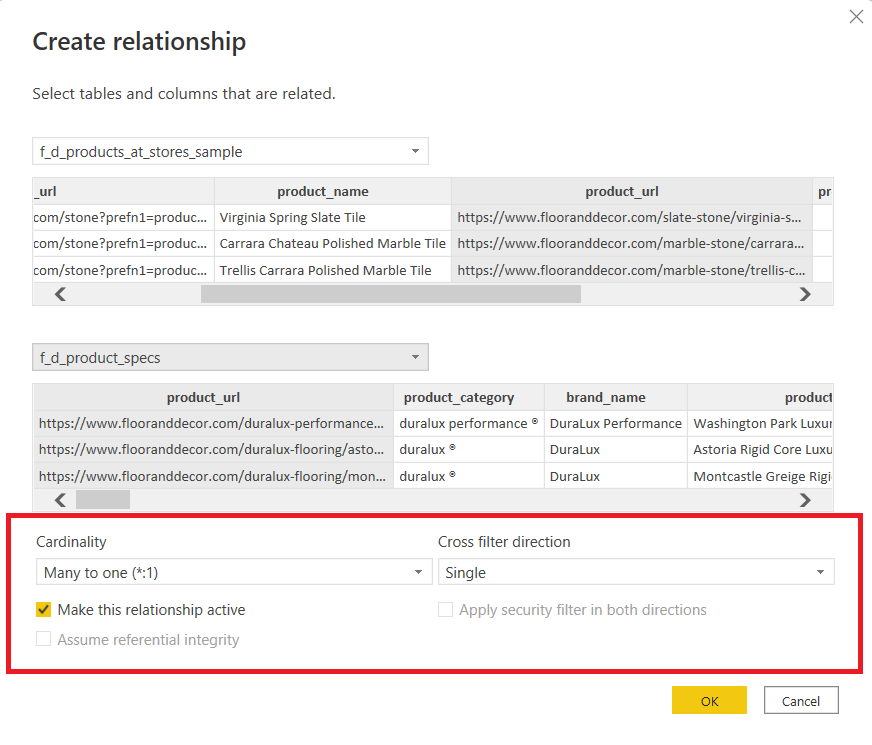 Before proceeding with our example, let us define Cardinality and Cross filter direction.
Cardinality
Table relationships may have three distinct sorts of cardinality.
Many to One (*:1) – The most common sort of connection. This implies that a column in one database may only contain one occurrence of a value, and this table is your lookup table. The value may appear many times in the other column.
One to One (1:1) – Each relational column in both tables contains only one occurrence of a value.
Many-to-many relationships: This connection design has a few advantages. Because two tables have a many-to-many connection, the necessity for unique values in tables is removed.
Filter direction of Relationships
Before proceeding with our example, let us define Cardinality and Cross filter direction.
Cardinality
Table relationships may have three distinct sorts of cardinality.
Many to One (*:1) – The most common sort of connection. This implies that a column in one database may only contain one occurrence of a value, and this table is your lookup table. The value may appear many times in the other column.
One to One (1:1) – Each relational column in both tables contains only one occurrence of a value.
Many-to-many relationships: This connection design has a few advantages. Because two tables have a many-to-many connection, the necessity for unique values in tables is removed.
Filter direction of Relationships
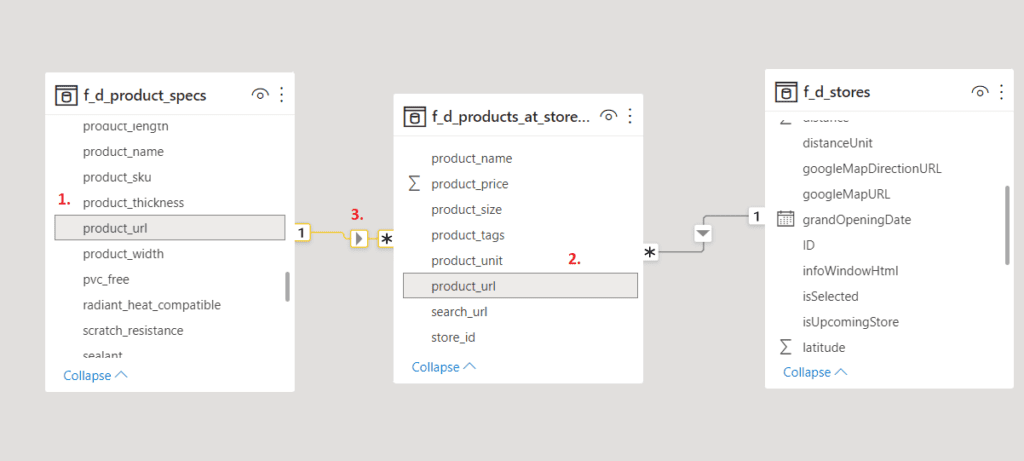
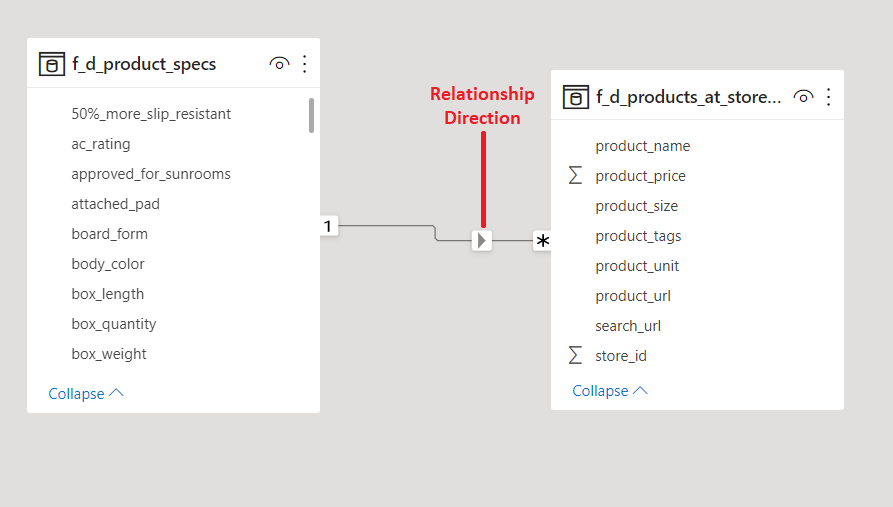 The most crucial question is what a relationship’s direction signifies. This determines the direction of your tables’ filtering. The relationship’s direction pertains to how Power BI filters the data. As an example, consider our data. The connection between our S Transactions and Products tables demonstrates that the relationship is going from Products to S Transactions.
You’ll most certainly be analyzing data from many imported tables. Relationships between tables are required to calculate results and provide accurate information in reports. Power BI Desktop makes connection construction easier.
After linking two tables using a relationship, you may use the data in both tables as if they were a single table, without worrying about connection details or flattening those tables. Power BI Desktop can automatically create connections, so you may not need to. Power BI Desktop will not make connections if it cannot be certain that two tables are connected. As a result, connect.
Autodetect during load
When you query two or more tables at the same time, Power BI Desktop tries to identify and build connections for you. Cardinality, Cross filter direction and Make this relationship active are all configured automatically. Power BI Desktop searches the column names in the tables you’re querying for possible associations. If there are any, such associations are immediately formed. If Power BI Desktop cannot identify a match with high confidence, it does not construct the connection. However, the Manage connections dialogue box may still be used to manually establish or change relationships. On the Modeling tab, select Manage relationships > Autodetect.
Creating relationships manually
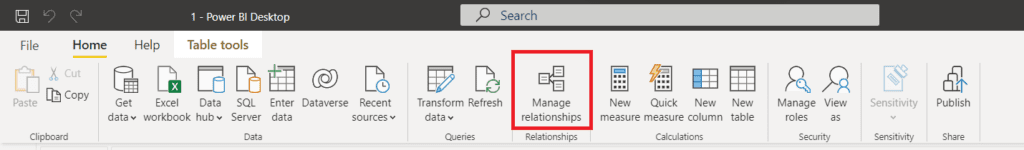
Let’s begin by manually linking two of our tables: our ‘Items’ database, which contains all information about our products, and our ‘Transactions’ table, which has all of our sales transactional data. There are two methods to start a relationship: To begin, pick ‘Manage Relationships’ from the ‘Home’ menu.
Second, by clicking and dragging the column from one table into the column of another table where you want the connection to be made.
Let’s start from the beginning and utilize the preceding example to construct a connection between our ‘f_d_product_specs’ and ‘f_d_products_at_stores_sample’ tables so that the tables are linked through relationships by choosing ‘Managing Relationships’. Let’s go with ‘New’.
Choose the two tables you wish to link with a relationship, as well as the columns (fields) that will connect them. You’ll note that Power BI attempts to determine the columns that will link your tables automatically. When your tables are properly configured, Power BI will generally get this correctly. The figure below shows that Power BI recognized the ‘product_url’ column as the field via which we would construct our link. This is the column that we want to utilize. Just keep in mind that column names do not have to be the same in order to join tables.
Relationship Editing
It is critical to change your connections after your tables are linked by a column from each table. We shall look at two things here:
- Cross filter direction
- Cardinality
Before proceeding with our example, let us define Cardinality and Cross filter direction.
Cardinality
Table relationships may have three distinct sorts of cardinality.
Many to One (*:1) – The most common sort of connection. This implies that a column in one database may only contain one occurrence of a value, and this table is your lookup table. The value may appear many times in the other column.
One to One (1:1) – Each relational column in both tables contains only one occurrence of a value.
Many-to-many relationships: This connection design has a few advantages. Because two tables have a many-to-many connection, the necessity for unique values in tables is removed.
Filter direction of Relationships
The most crucial question is what a relationship’s direction signifies. This determines the direction of your tables’ filtering. The relationship’s direction pertains to how Power BI filters the data. As an example, consider our data. The connection between our S Transactions and Products tables demonstrates that the relationship is going from Products to S Transactions. As you can see, business intelligence has a lot to offer businesses of all sizes across all industries. If you’re not already using BI in your decision-making process, now is the time to start!
Check out other helpful Power BI Blogs

If you are looking forward to getting your data pipeline built and setting up the dashboard for business intelligence, book a call now from here.