What Is a Data Warehouse? Signs You've Outgrown Spreadsheets
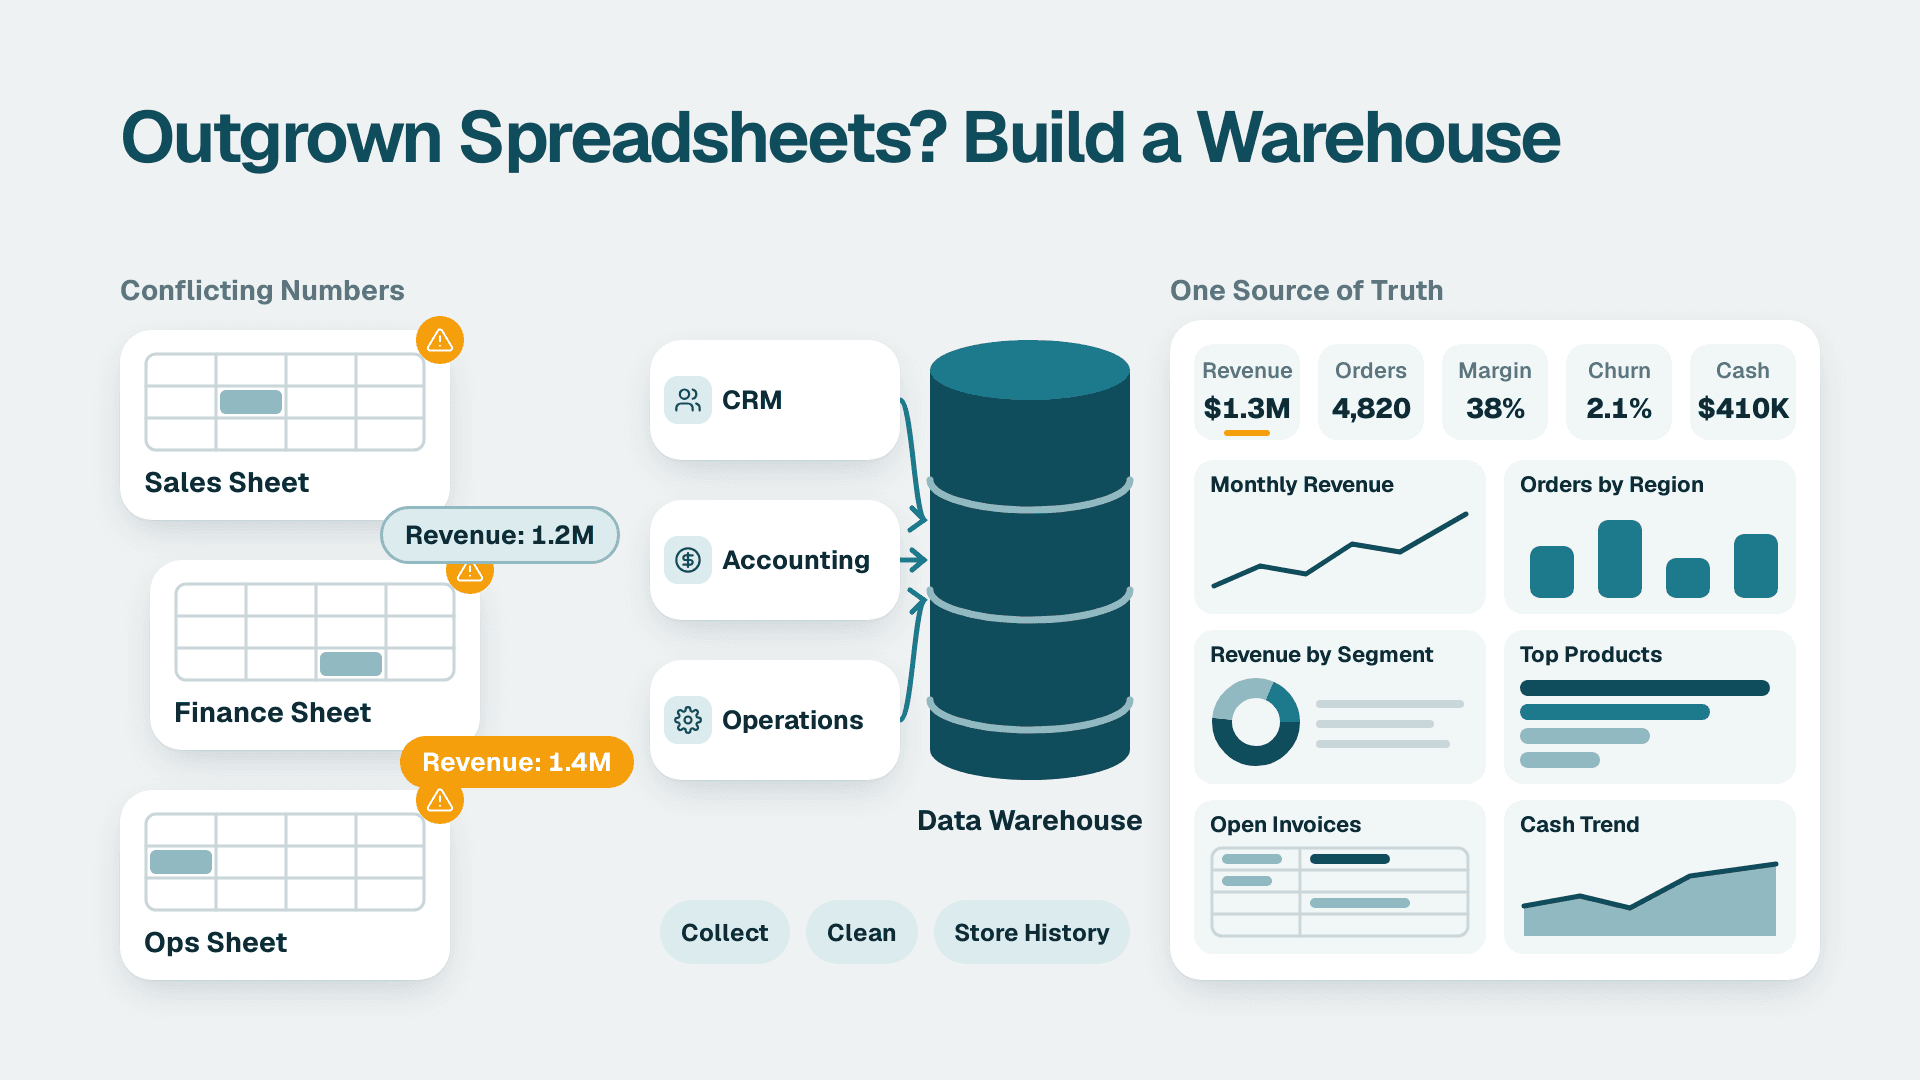
A data warehouse is a central system that collects data from your operational tools, cleans and organizes it, and keeps its history so reporting and analysis run from one trusted place. In plain terms, it is the shared source of truth that sits between your source systems and your dashboards.
Key Takeaways
- A data warehouse stores integrated, historical business data in a structure built for analysis, not for running day-to-day transactions.
- It differs from an operational database in purpose: databases record events, warehouses explain them over time.
- Conflicting numbers, slow refreshes, and spreadsheet-dependent reporting are the clearest signs you have outgrown direct-to-source reporting.
- You do not need a warehouse on day one, but you do need one before reporting logic gets copied into dozens of files and reports.
- On Microsoft Fabric, the warehouse is one component of a wider platform, so the design choice is about fit, not just technology.
What is a data warehouse, and what does the term mean?
A data warehouse is a system that integrates data from many sources into one store, organized for reporting and analysis rather than for processing transactions. That is the data warehouse definition most practitioners use, and it holds whether the system runs on a server in your office or as a managed cloud service.
The term is also written as DW or DWH, and the larger company-wide version is called an enterprise data warehouse (EDW). A reference definition of the term describes it as a system used for reporting and data analysis and a core component of business intelligence.
To explain data warehouse in one picture, think of a retail distribution centre. Suppliers (your CRM, ERP, billing tool, marketing platform, and support desk) each ship goods in their own packaging. The warehouse receives them, checks them, relabels them to a common standard, and shelves them so anyone can find what they need. Reports then draw from the shelves, not from each supplier's loading dock.
Three properties make this useful:
- Integrated: customer, product, and date mean the same thing across every report.
- Historical: it keeps past states, so you can compare this quarter with the same quarter last year even if the source system overwrote the old values.
- Read-optimized: it is structured so large analytical questions return quickly without slowing the systems your staff use to do their jobs.
If you are weighing how a warehouse fits into a wider Fabric design, Power BI and Fabric consulting covers the modelling, capacity, and governance decisions that sit around it.
What is data in a data warehouse?
The data in a data warehouse is structured, cleaned, and organized into tables that SQL can query, typically with a defined schema. It comes from operational systems, but it is not a raw copy of them. By the time warehouse data reaches a report, it has been matched, de-duplicated, and given consistent definitions.
Typical examples include invoices from an ERP, deals from a CRM, subscription events from a billing system, ad spend from marketing platforms, and ticket volumes from a service desk. A growing mid-market company may have 10 to 30 such sources, each with its own keys, date formats, and quirks.
A warehouse is also not the right home for everything. It is typically not ideal for storing massive volumes of raw, unstructured data, and cost and complexity of storage grow with data volume. Files, logs, images, and semi-structured feeds usually land in a lake first, and only the curated, tabular parts move into the warehouse. Our explainer on how a lakehouse, a data lake, and a data warehouse differ walks through that split in detail.
What is a data warehouse vs. a database?
A database is built to run an application, while a data warehouse is built to analyze what the application recorded. Both store tables, but they are tuned for opposite jobs.
Operational databases (loosely called OLTP systems) benefit from row-oriented storage because they read and write single records constantly: one order, one payment, one customer update. Analytics databases (loosely called OLAP systems) benefit from column-oriented storage because they scan millions of rows but only a few columns, such as revenue by region by month.
| Feature | Operational database | Data warehouse |
|---|---|---|
| Main purpose | Run the application | Support reporting and analysis |
| Typical workload | Many small reads and writes | Fewer, larger analytical queries |
| Storage orientation | Row-oriented | Column-oriented |
| Data scope | Current state of one system | Integrated history from many systems |
| Users | Applications and front-line staff | Analysts, BI leads, executives |
| Change pattern | Records updated in place | History preserved and appended |
The practical consequence is that running heavy reports against the operational database slows the application, and the numbers still will not reconcile with another system. The warehouse removes both problems.
Is SQL a data warehouse?
No. SQL is a query language, and a data warehouse is a system that stores and organizes data. You use SQL to ask questions of a warehouse, but SQL itself holds nothing.
The confusion is understandable because warehouses require data in a tabular format with a schema so that SQL can query it. That requirement is also what separates a warehouse from a data lake, which can hold structured, semi-structured, and unstructured data without forcing it into tables first. Similarly, a SQL Server instance on its own is a database engine. It becomes a warehouse only when you design it as one: integrated sources, conformed dimensions, scheduled loads, and history.
What is EDW in data warehouse terms, and what other types exist?
EDW stands for enterprise data warehouse, a single warehouse that serves the whole organization. It is one of three common variations, alongside the operational data store and the data mart.
- Enterprise data warehouse (EDW): the company-wide store, integrating data across departments.
- Operational data store (ODS): a store of recent, lightly processed data used for near-term operational reporting.
- Data mart: a smaller subset serving a single line of business or project, such as finance or sales.
Microsoft's description of deployment models adds another dimension: on-premises, cloud, hybrid, and federated. A federated warehouse does not hold data in one place, but presents a combined view across different systems. Mid-market teams on Fabric usually land on a cloud model, which offers highly scalable compute and storage, pay-as-you-go pricing, and managed operation, in contrast to older on-premises systems built on massively parallel or symmetric multiprocessing hardware and sometimes delivered as stand-alone appliances.
How does a data warehouse work?
A warehouse works by extracting data from sources, preparing it, loading it into structured tables, and exposing it to reporting tools. The two main workflows are ETL (extract, transform, load) and ELT (extract, load, transform), which differ in whether cleaning happens before or after the data lands.
Most warehouses follow a three-tier pattern:
1. Bottom tier: data sources, storage, and the loading process.
2. Middle tier: the analytics engine, often an OLAP server, that handles aggregation and calculation.
3. Top tier: front-end tools for querying, BI, dashboards, and reporting.
OLAP supports three basic operations: roll-up (consolidating detail into totals), drill-down (moving from a total to its parts), and slicing and dicing (viewing the same data from different angles). The OLAP layer itself comes in three forms: MOLAP works on a multidimensional cube and is typically fastest, ROLAP works directly on relational tables, and HOLAP splits work between the two.
Two more concepts matter in practice. First, latency: OLAP systems typically carry a data latency of a few hours, and a data mart closer to a day, so a warehouse is a deliberate trade of freshness for consistency. Second, metadata: data sources, table and column names, refresh schedules, and usage measures. Good metadata is what lets a BI lead answer where a number came from.
What are the signs a growing company has outgrown spreadsheets and direct-to-source reporting?
You have outgrown spreadsheets and direct-to-source reporting when the effort of producing a trusted number grows faster than the business does. Each sign below is a symptom of the same root cause: business logic scattered across files and reports instead of defined once.
Sign 1: Two reports give two answers
Sales says revenue was one figure, finance says another, and both can defend their file. The difference is rarely arithmetic. It is a definition: when a deal counts, which currency rate applies, whether credits are netted. If you routinely debug these gaps, our guide on why Power BI reports disagree with the general ledger shows the reconciliation pattern a warehouse is designed to make unnecessary.
Sign 2: Every metric lives in someone's head
One analyst knows which filters to apply to the churn export, and nobody else does. When that person is on leave, reporting stops or quietly changes. A warehouse moves the logic into a governed, documented layer.
Sign 3: Reports query production systems directly
Direct-to-source reporting points dashboards at the CRM, ERP, or application database. It works at small scale. As report counts and users rise, refreshes compete with real work, source APIs throttle, and a vendor schema change breaks a dozen dashboards at once.
Sign 4: Refreshes are slow, fragile, or manual
A workbook that takes ten minutes to open, a refresh that fails on Mondays, or a manual copy-paste step before the leadership meeting is a reliability problem. It also hides a risk: nobody notices when a step is skipped.
Sign 5: You cannot answer questions across systems
Which marketing channel produces customers with the lowest support cost? That needs ad data, CRM data, and service data joined on a shared customer key. Spreadsheets can approximate this once. They cannot maintain it.
Sign 6: History disappears
Many source systems overwrite old values. If a customer changes region or a product changes category, last year's reports silently shift. A warehouse preserves history so past periods stay stable and comparable.
Sign 7: Spreadsheet sprawl and shadow copies
Files with names like final_v7_revised multiply, each a slightly different snapshot. Version confusion is expensive, and it is also a governance exposure when those files carry personal or regulated data.
Sign 8: Compliance and audit questions are hard to answer
When an auditor or regulator asks who can see customer data and where it flows, a sprawl of exports is difficult to defend. A central store with access controls, lineage, and retention rules is far easier to evidence.
| Approach | Works well when | Breaks down when |
|---|---|---|
| Spreadsheets | One owner, few sources, low volume | Multiple contributors, shared definitions, or audit needs |
| Direct-to-source reporting | A single system, simple questions | Cross-system joins, many users, heavy refreshes |
| Data warehouse | Several sources, shared metrics, history needed | Very small teams with one source and no growth plans |
As a rough test, if three or more of the signs above describe your company, the question is no longer whether you need a warehouse but how to sequence building one. The free BI readiness self-assessment can help you score where your current setup stands.
How do compliance rules affect a data warehouse?
A warehouse concentrates data, which makes access control and retention easier to enforce but raises the stakes if it is designed carelessly. The right controls depend on where your customers and staff are.
Consider three hypothetical examples. A US healthcare services group handling patient-related data would map warehouse access to HIPAA requirements, and a US SaaS finance team selling to enterprise buyers would typically be asked for SOC 2 evidence covering access and change management. A UK fintech or an EU retailer must account for GDPR, including lawful basis, minimization, and the ability to locate and delete an individual's records. A Canadian manufacturer with customer or employee data would consider PIPEDA obligations around consent, safeguards, and accountability.
In each case the pattern is the same: classify sensitive columns, restrict access by role, log who queries what, and define retention. These controls are far simpler to apply once in a warehouse than across hundreds of exported files.
When should you not build a data warehouse yet?
You should hold off when a warehouse would add overhead without removing a real problem. A company with one primary system, a handful of reports, and a single analyst may be better served by tidying its source reporting for now.
A warehouse is also premature when nobody agrees on basic definitions. Technology will not settle whether an active customer means a paid account or a logged-in user. Settle that first, because a warehouse will only encode the disagreement faster.
Finally, be honest about ownership. A warehouse needs someone responsible for load failures, schema changes, and new requests. Without an owner, it decays into another unmaintained system.
How does a data warehouse fit into Microsoft Fabric?
In Microsoft Fabric, the warehouse is one part of a unified platform rather than a separate product you stitch on. Microsoft positions Fabric as a platform that unifies data across an organization so AI models can be applied without moving or duplicating data.
For data engineers and BI leads, that changes the planning question. Instead of asking which warehouse product to buy and how to wire it to Power BI, you decide how much of your data belongs in structured warehouse tables, how much in lake storage, and how both are modelled for reporting. Some vendors distinguish a traditional warehouse (structured data only) from a lakehouse-style system that blends the two, and Fabric lets you use either pattern or both.
Capacity is the other practical decision. Fabric workloads draw on shared capacity, so sizing affects both cost and performance. Our guide to Fabric F-SKU and P-SKU capacity costs explains how to think about that choice. Note too that Copilot features need a paid Fabric capacity at F2 or higher, or Power BI Premium P1 or higher; a Pro or PPU licence alone is not enough. For licence-level planning, remember that Power BI Pro lists at $14 per user per month and Premium Per User at $24 per user per month.
What are the top data warehouse options?
Rather than ranking brands, it is more useful to compare the models, because the right one depends on your team and data. The five common options below cover most mid-market decisions.
| Option | What it is | Best fit |
|---|---|---|
| On-premises warehouse | Hardware and software you run yourself | Strict data residency or existing infrastructure |
| Cloud data warehouse | Fully managed service with scalable compute and storage | Most growing mid-market teams |
| Hybrid warehouse | Mix of on-premises and cloud components | Gradual migration or mixed residency needs |
| Federated warehouse | Combined view across systems without central storage | Quick cross-system visibility, lighter governance needs |
| Lakehouse-style platform | Lake storage with warehouse-style querying on top | Mixed structured and unstructured workloads |
If your reporting already lives in Power BI, moving toward a Fabric-based model is usually the shortest path. Our walkthrough on migrating a Power BI workspace to Microsoft Fabric covers that transition.
How do you start building a data warehouse without overreaching?
Start with one business question that crosses at least two systems, and build only what answers it. This keeps scope honest and gives stakeholders a visible win.
1. Pick the first use case. Choose a metric people already argue about, such as revenue, pipeline, or churn.
2. Agree the definitions. Write down what each term means and who owns it before any code is written.
3. Inventory the sources. List systems, owners, refresh needs, and sensitive fields.
4. Load and model. Land the raw data, then build clean, conformed tables with consistent keys and history.
5. Connect reporting. Point dashboards at the warehouse, not the sources, and retire the old spreadsheets deliberately.
6. Monitor and document. Track load success, record metadata, and assign an owner for changes.
Then expand one subject area at a time. Data engineers tend to enjoy the modelling work; BI leads tend to value the definitions work more. Both are necessary, and neither is optional.
---
About Lets Viz: Lets Viz is a data analytics consultancy that has helped teams build reliable reporting and data platforms since 2020, working with US healthcare organizations, UK fintech firms, Canadian manufacturers, and global SaaS companies. The team holds a 5.0 Clutch rating and focuses on Power BI and Microsoft Fabric implementations that finance and operations leaders can trust.
If you are planning a warehouse on Fabric and want an experienced second opinion on design and capacity, explore Power BI and Fabric consulting.
Sources
- Reference definition of a data warehouse
- Overview of data warehouse architecture and OLAP types
- Guide to data warehouse tiers, variations, and lakehouse-style systems
Facts and prices checked November 2026.