Power BI Report Builder vs Desktop: Finance Guide
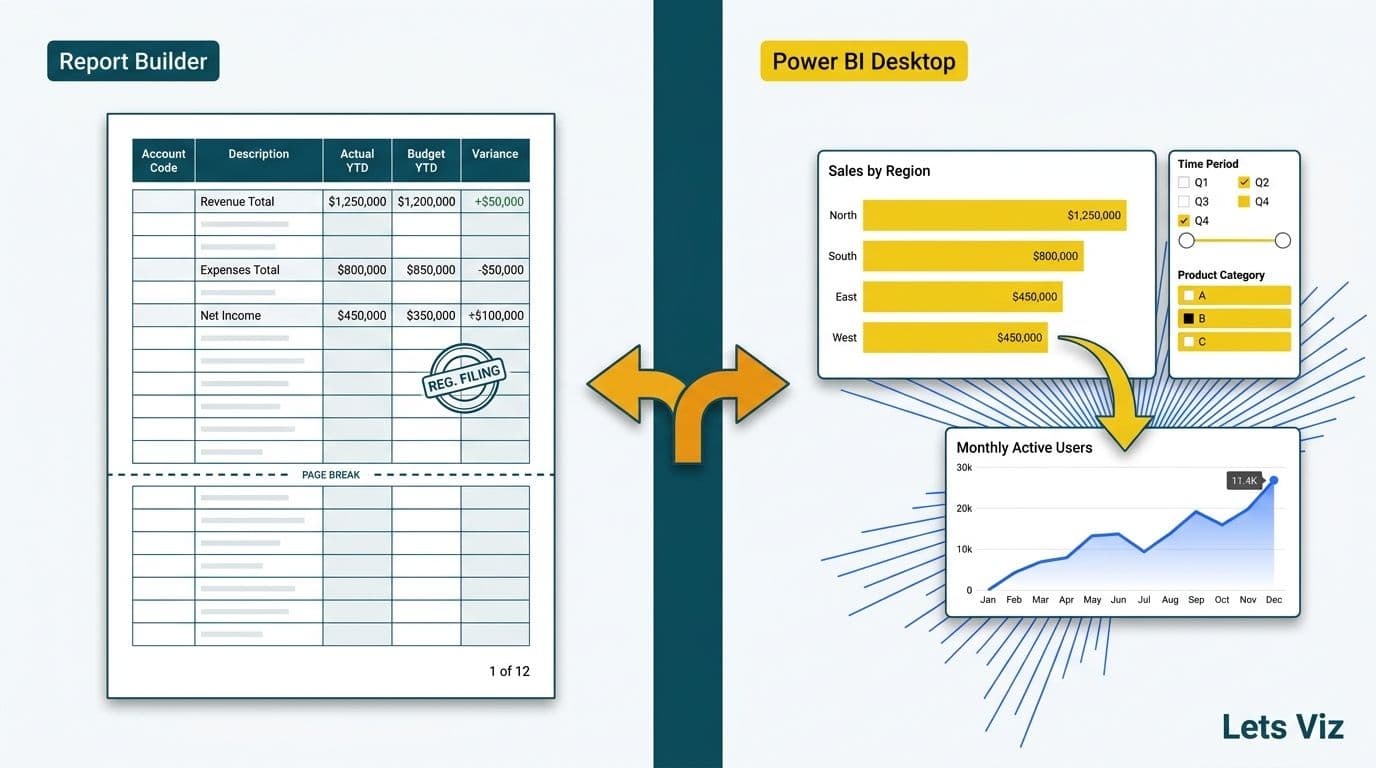
Power BI Report Builder produces paginated, fixed-layout documents - invoices, regulatory filings, and print-ready statements that render identically regardless of dataset size. Power BI Desktop produces interactive reports designed for on-screen exploration, filtering, and drill-through. Finance teams need both: Report Builder for document production, Desktop for analytical discovery. The tool choice follows the output requirement, not the tool's general popularity.
Key Takeaways
Report Builder creates paginated reports - pixel-perfect, fixed-layout documents designed for print and bulk export
Desktop creates interactive reports - filterable, drillable dashboards and exploration canvases
Publishing paginated reports to the Power BI service requires Premium Per User (PPU) or a Premium capacity licence - not a standard Pro licence
Finance use cases split by purpose: invoices and regulatory filings go to Report Builder; KPI dashboards and forecasting models go to Desktop
Best practice is a shared semantic model feeding both tools, ensuring consistency between the interactive executive dashboard and the PDF board pack
What Is the Core Difference Between Power BI Report Builder vs Desktop?
Power BI Report Builder is a standalone desktop application for authoring paginated reports - the successor to SQL Server Reporting Services (SSRS) in the modern Power BI ecosystem. A paginated report controls its own pagination: it inserts page breaks, manages headers and footers, and produces an identical layout whether the underlying query returns 100 rows or 100,000. The output is deterministic - the same query, the same dataset, and the same timestamp always yield the same document - which is why auditors and regulators accept paginated PDFs as formal records.
Power BI Desktop is the standard authoring tool for interactive reports. Visuals resize dynamically, cross-filters cascade across the canvas, and users drill from a summary metric to the underlying transaction in seconds. Desktop reports are designed for screens, not printers. They adapt to the data; paginated reports control how data is presented on each page.
Both tools connect to the same sources - Azure SQL, Dataverse, Excel, Microsoft Fabric lakehouses, and hundreds of certified connectors. Both publish to the Power BI service. The architectural distinction is output intent: exploration versus documentation.
Before scoping a finance BI project that spans both tools, use the Instant project cost calculator to estimate implementation effort - the tool combination chosen significantly affects project hours and licence costs.
When Should Finance Teams Choose Power BI Report Builder?
Report Builder is the correct choice when the output format is legally, contractually, or operationally non-negotiable. Finance generates many such requirements:
Customer invoices and billing statements. An invoice must paginate cleanly across any number of line items - three or three hundred - and must match a branded template precisely. Report Builder's sub-report and group-header logic handle variable-length content natively. Desktop's table visuals truncate or scroll, which is unsuitable for a legally binding document.
Regulatory filings and compliance exports. The US SEC, the UK's FCA, and Canada's OSFI all require financial institutions to produce consistent, reproducible records on demand. A Report Builder PDF carries a generation timestamp and is produced from a governed, access-controlled dataset, creating an audit trail that Desktop exports cannot replicate.
Fixed-layout financial statements. Board packs, consolidated income statements, and balance sheets frequently must conform to templates approved by governance committees. Report Builder offers pixel-level control over fonts, borders, column widths, and conditional formatting that the drag-and-drop Desktop canvas cannot guarantee.
Parameter-driven batch reports. A daily accounts-receivable aging report covering 80,000 customer records, segmented by region and overdue bracket, is a natural Report Builder scenario. Parameters drive the query; pagination handles the volume across as many pages as the data requires.
According to Market Research Future, the Healthcare Financial Analytics Market is projected to grow at an 8.58% CAGR through 2035 — a trajectory reinforced by the wave of regulatory expansions across the US, UK, and Canada that took effect in 2026. Finance teams in regulated industries face mounting documentation requirements that interactive dashboards alone cannot satisfy.
For teams automating recurring financial output, the guide on how to automate monthly financial reporting in Power BI covers scheduling and parameterisation workflows in detail.
When Does Power BI Desktop Win for Finance Analysis?
Desktop is the right tool when the goal is understanding and discovery rather than document production. Finance scenarios where Desktop is the clear choice:
KPI dashboards and executive scorecards. A CFO-facing dashboard showing revenue, gross margin, cash runway, and budget variance benefits from interactivity. Clicking a region isolates it; drilling into a subsidiary reveals the detail. Desktop makes this exploration natural in a way a static Report Builder PDF cannot.
Forecasting and scenario modelling. DAX what-if parameters, decomposition trees, and AI-powered Key Influencers visuals allow analysts to model scenarios interactively. A finance analyst investigating what happens to EBITDA if customer acquisition cost rises 15% gets an immediate visual answer in Desktop. Report Builder has no equivalent capability.
Ad hoc investigation. When a finance controller needs to explain an unexpected spike in cost of goods sold, Desktop's cross-filtering and drill-through capabilities compress what was a multi-hour spreadsheet investigation into minutes.
Self-service reporting across business units. Published Desktop reports let business-unit finance teams build their own filtered views using slicers and bookmarks, without IT involvement. This autonomy reduces demand on central finance teams and accelerates decision cycles.
Through 2025 and into 2026, three dominant themes have defined analytics adoption: value-based analytics, AI-driven reporting workflows, and democratised cross-functional data access (MedInsight, 2026). Desktop's interactive, self-service architecture directly addresses all three.
For teams evaluating Desktop against other BI platforms in financial reporting settings, the Power BI vs Tableau vs Excel for financial reporting guide covers the wider decision.
Report Builder vs Desktop: Licensing and Cost Breakdown
This is the most frequent planning oversight for finance teams adopting paginated reports.
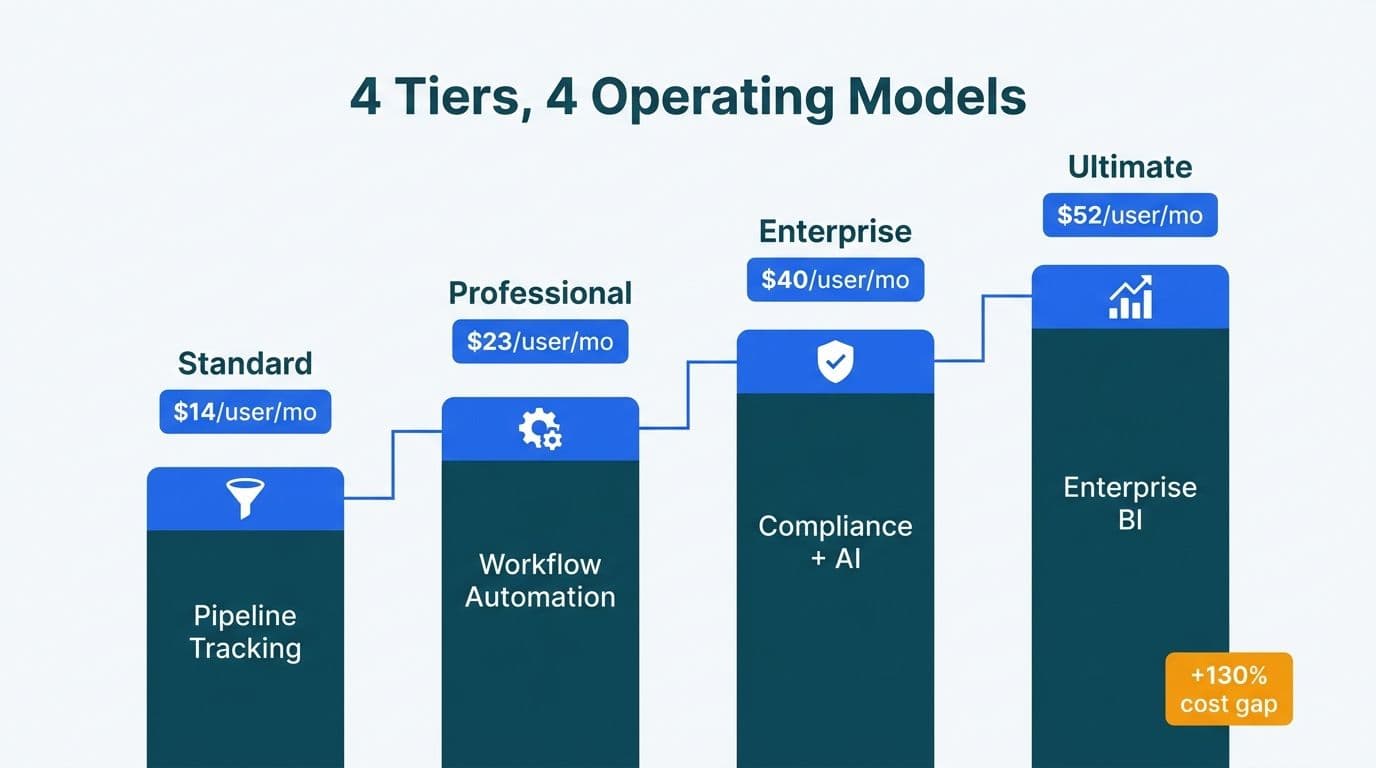
Power BI Desktop is free to download and use locally. Sharing reports through the Power BI service requires Power BI Pro at approximately US$10/user/month (annual commitment). Most finance teams of 10 to 50 users operate comfortably on Pro licences.
Power BI Report Builder is also free to download. The licensing gap appears at publishing: distributing paginated reports through the Power BI service requires Power BI Premium Per User (PPU) at approximately US$20/user/month - or a dedicated Premium capacity node (P1 and above) starting at approximately US$5,000/month. Finance teams that discover this requirement mid-project typically face an unplanned budget revision.
The Premium Surprise: Why Finance Teams Get Caught
Many organisations assume their existing Pro licences cover paginated report publishing - they do not. The jump from Pro to PPU doubles per-user licence cost. For a 25-person finance team, that gap amounts to roughly US$3,000 per year in additional licence spend before any implementation costs are factored in - a figure that frequently surfaces only after a paginated report prototype has already been built and approved. Teams that identify this early can explore alternatives: Power BI Report Server for on-premises deployment, a shared Premium capacity across a department, or a deliberate scope decision about which documents truly require paginated output versus which can use Desktop's PDF export function.
| Feature | Power BI Desktop | Power BI Report Builder |
|---|---|---|
| Report type | Interactive | Paginated (fixed layout) |
| Primary finance use | Dashboards, KPIs, forecasting | Invoices, filings, fixed statements |
| Authoring licence | Free | Free |
| Service publishing licence | Pro (~US$10/user/month) | PPU (~US$20/user/month) or Premium capacity |
| Page break control | Not supported | Full native control |
| Parameter-driven multi-page output | Not supported | Native |
| Row-count handling | Visual truncation at high volumes | Full dataset, paginated across pages |
| Export formats | PDF (limited), PowerPoint, PNG | PDF, Excel, Word, CSV, XML |
| Scheduled PDF delivery | Subscriptions (limited) | Full parameterised subscription engine |
| On-premises deployment | Power BI Report Server | Power BI Report Server |
| Shared semantic model | Yes | Yes (via Analysis Services endpoint) |
How Do US, UK, and Canadian Finance Teams Approach the Choice?
Geography and regulatory context shape how organisations balance Report Builder against Desktop.
United States. A US healthcare finance team handling patient billing produces Explanation of Benefits (EOB) documents and invoices that must satisfy HIPAA's documentation standards. Report Builder's deterministic, timestamped PDF output creates the audit chain that HIPAA compliance officers require. The same team runs Desktop for interactive cost-per-encounter dashboards and payer mix analysis. Power BI row-level security for healthcare data ensures analysts access only the patient population their role permits - a governance control that applies equally in both Report Builder and Desktop environments connected to the same certified dataset. For SaaS companies under SOC 2, the pattern is identical: Desktop for internal analysis, paginated exports for external audit evidence.
For healthcare BI governance context, the managed Power BI service for healthcare build-vs-buy guide covers tool selection and compliance controls in detail.
United Kingdom and European Union. A UK fintech firm subject to FCA reporting obligations and GDPR Article 30 routes all customer-facing financial documents through Report Builder. The immutable paginated PDF serves as the legally defensible record. Interactive Desktop dashboards handle cohort analysis, revenue attribution, and churn modelling internally, with GDPR-compliant row-level security restricting analysts to only the datasets their data processing agreements authorise.
Canada. Canadian financial institutions governed by OSFI guidelines and PIPEDA accountability principles face structurally similar requirements. A Canadian credit union generates member account statements and regulatory returns in Report Builder for compliance evidence, while using Desktop to monitor branch performance and loan portfolio health interactively. PIPEDA's emphasis on accuracy and accountability makes reproducible paginated output a practical requirement for any member-facing financial document.
According to Future Market Insights, the AI consulting services market will grow from USD 11.07 billion to USD 90.99 billion by 2035 at a 26.2% CAGR - reflecting the scale of investment financial institutions across all three markets are directing toward structured data infrastructure that underpins both tool types.
What Is the Optimal Workflow When Finance Teams Need Both Tools?
Most mature finance BI environments deploy Report Builder and Desktop in parallel, both drawing from a shared semantic model published to the Power BI service. This architecture is what makes the two tools coherent rather than competing.
Step 1 - Build and certify a single dataset. Finance data engineers publish and certify a Power BI semantic model with all business logic (DAX measures, KPI definitions, currency adjustments) and row-level security applied centrally. This is the single source of truth for both report types.
Step 2 - Author Desktop reports via Live Connection. Analysts connect Desktop reports to the certified dataset using Live Connection. Interactive dashboards, variance analyses, and KPI scorecards reflect the same logic and access controls as the paginated reports.
Step 3 - Author Report Builder reports against the same model. Report Builder connects via the Analysis Services endpoint (requiring PPU or Premium). Invoice templates, regulatory filing queries, and board-pack generators all read from the same governed dataset.
Step 4 - Automate scheduled distribution. Power BI subscriptions deliver paginated PDFs on schedule - daily accounts-receivable aging to the collections team, monthly P&L statements to board members, quarterly regulatory exports to the compliance function. Desktop reports refresh on demand and via scheduled data refresh.
This shared-model approach eliminates discrepancy risk between an interactive CFO dashboard and the PDF board pack derived from it. Both report types read from the same numbers, at the same access level, with the same business logic applied - satisfying the consistency requirements of HIPAA, GDPR, and PIPEDA simultaneously.
Teams evaluating whether to build and maintain this infrastructure in-house or engage an external managed service should review the when to outsource Power BI management decision framework before committing to either path.
---
Finance BI projects combining paginated and interactive reporting vary significantly in cost depending on data source count, user volume, and compliance requirements. Use the Instant project cost calculator to get a scoped estimate for your organisation before you begin.
---
About Lets Viz: Lets Viz is a data analytics consultancy specialising in Power BI, Microsoft Fabric, and Zoho implementations for clients across US healthcare, UK fintech, Canadian manufacturing, and global SaaS - rated 5.0 on Clutch. Operating since 2020, the team has designed and delivered paginated and interactive reporting architectures for finance, compliance, and operations teams in regulated industries across North America and Europe.