SUMX vs SUM in Power BI: When to Use Each
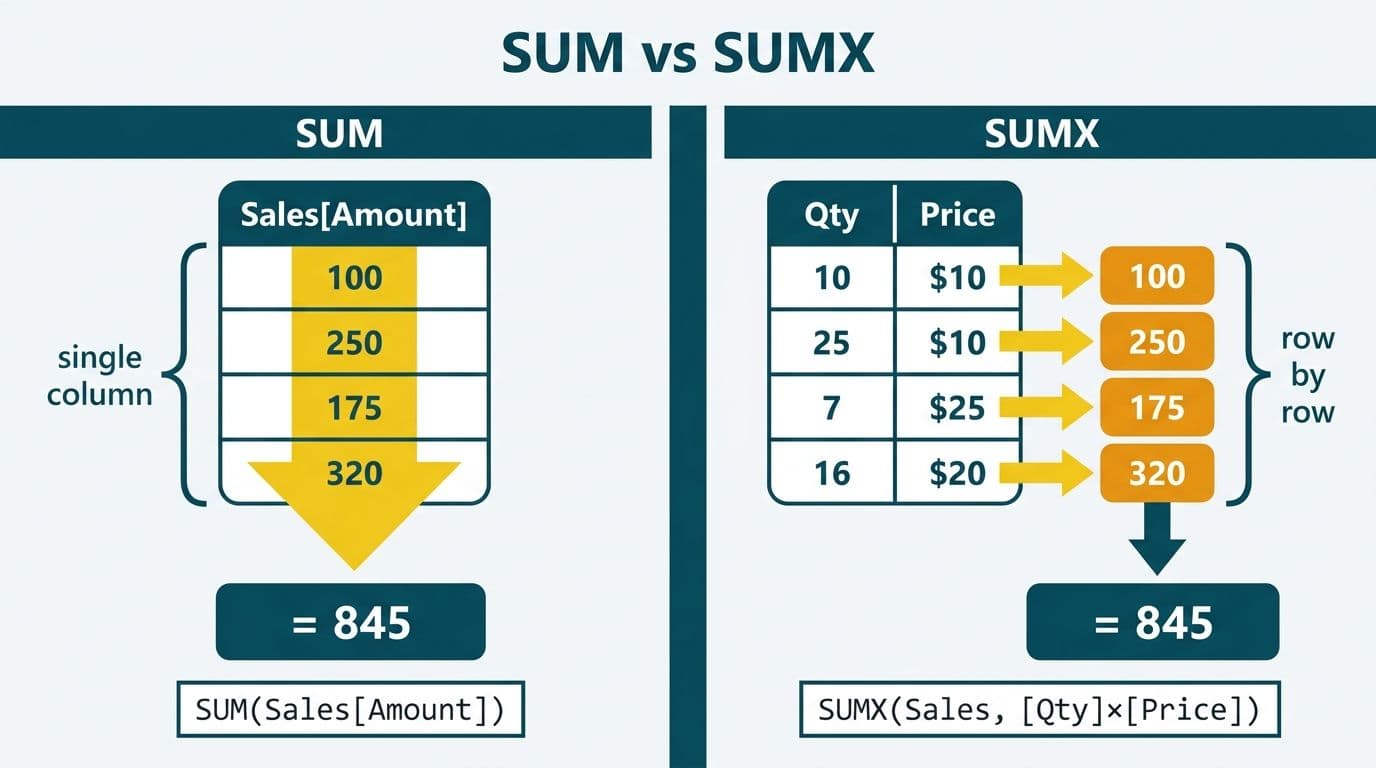
SUM is a simple aggregator that totals values in one column within the current filter context. SUMX is an iterator: it steps through every row in a table, evaluates an expression at that row, then sums the results. Use SUM when the value already exists in a column; use SUMX when you need to calculate something per row first - such as profit margin per transaction or prorated daily revenue.
Key Takeaways
- SUM(Table[Column]) adds values in a single column; SUMX(Table, expression) evaluates an expression row by row before summing.
- SUMX is mandatory when no single column holds the value you want to aggregate - such as revenue computed from Quantity multiplied by Unit Price.
- SUM is more efficient for simple column totals; prefer it whenever the final value already exists at the row level in your dataset.
- In healthcare revenue cycle analytics dashboards, SUMX is often required to compute net reimbursement at claim level, where each claim carries a different contractual adjustment rate.
- Misusing SUM where SUMX is required produces silent errors - totals that look plausible but are arithmetically wrong under filtering.
What Is the Difference Between SUMX and SUM in Power BI?
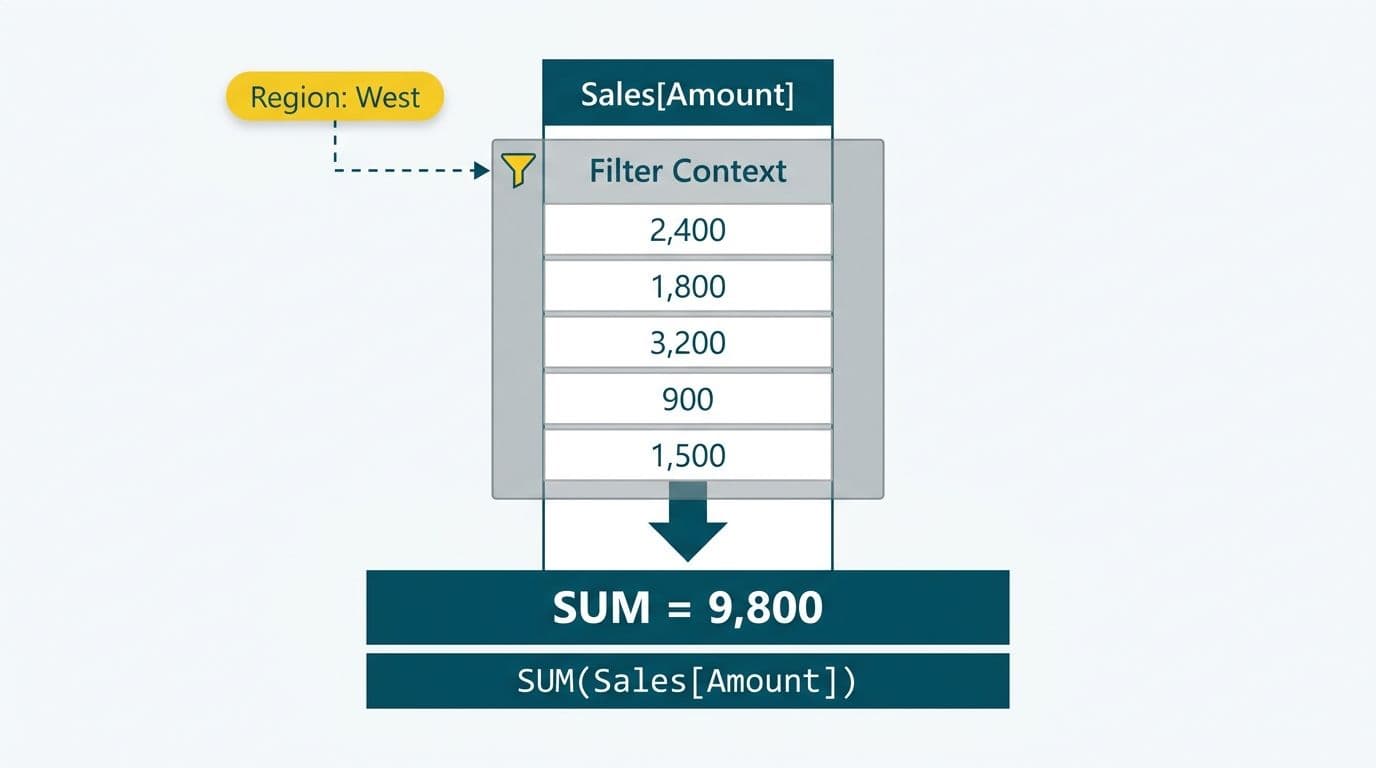
SUM and SUMX are both DAX aggregation functions, but they operate at different levels of the data model. SUM takes a single column reference and adds every value in that column within the current filter context. It is a scalar operation with no awareness of other columns or row-by-row logic.
```
Total Revenue = SUM(Sales[Revenue])
```
SUMX is an iterator function. It accepts two arguments - a table and a DAX expression - and evaluates that expression for every row in the table before summing the row-level results.
```
Total Revenue = SUMX(Sales, Sales[Quantity] * Sales[UnitPrice])
```
Both measures may return the same number on a given report page when a pre-calculated Revenue column exists and the model is a simple single-table structure. They diverge as soon as the model introduces relationships, mixed granularity, or conditional row-level logic.
The structural difference carries a performance cost. SUM is evaluated once against the column in the current filter context. SUMX materializes a row context for each row in the table, evaluates the expression, then collapses the results. This makes SUMX more expensive in terms of memory and query time - a practical consideration whether your organization is evaluating Power BI Pro vs Premium Per User licensing tiers or running shared capacity for a large user base.
For organizations that route financial and operational reports through automated analytics pipelines managed by an AI automation consulting practice, a DAX layer built on misapplied SUM vs SUMX choices creates silent errors in automated dashboards - discrepancies that surface only when a finance director cross-checks actuals against the source system.
When Should You Use SUMX Instead of SUM?
SUMX is the right choice when the value you need to aggregate does not exist as a physical column in your table. Three reliable triggers indicate SUMX is required:
1. Arithmetic between columns is required at row level. If revenue equals Quantity multiplied by Unit Price, and no Revenue column exists, SUM has nothing to reference. SUMX handles the multiplication per row before summing.
2. The expression contains a condition that varies by row. Suppose a UK fintech firm processes transactions in GBP, EUR, and USD and must convert each to a base reporting currency before producing consolidated revenue. The FX conversion rate is stored per transaction row. SUM cannot branch on a per-row value; SUMX steps through each record, applies the applicable rate, and sums the converted results.
3. The expression requires a related table. SUMX can embed RELATED() to pull a value from a related dimension table for each row in the fact table. SUM has no mechanism to traverse relationships row by row.
A Canadian manufacturing company tracking plant-level material costs frequently encounters the third pattern: unit cost per component lives in a materials pricing table that is updated weekly, while the production fact table holds quantities. SUMX over the production fact table - with RELATED() fetching the current price from the pricing dimension - produces a valid, up-to-date total. A SUM of a pre-built cost column risks using stale prices embedded at the last data refresh.
Side-by-Side Financial Examples: SUMX vs SUM in Power BI
The clearest way to understand the SUMX vs SUM decision is through concrete financial scenarios. The table below maps six common patterns from financial services and operational analytics to the correct function:
| Scenario | Pre-built Column? | Correct Function | Reason |
|---|---|---|---|
| Total revenue from an existing Revenue column | Yes | SUM(Sales[Revenue]) | Column already holds the final value |
| Revenue = Quantity * Unit Price (no Revenue column) | No | SUMX(Sales, Sales[Quantity] * Sales[UnitPrice]) | Row-level multiplication required |
| Net margin = Revenue minus COGS per order | No | SUMX(Orders, Orders[Revenue] - Orders[COGS]) | Subtraction must happen at row level |
| Total claims paid (single AmountPaid column) | Yes | SUM(Claims[AmountPaid]) | Direct column total |
| Net reimbursement = Charge minus Contractual Adjustment per claim | No | SUMX(Claims, Claims[Charge] - Claims[ContractualAdj]) | Adjustment rate varies by claim |
| FX-converted revenue across multi-currency transactions | No | SUMX(Sales, Sales[Amount] * RELATED(FX[Rate])) | Conversion rate varies per row |
The most common mistake is applying SUM to a pre-aggregated or averaged metric such as a margin percentage column. Summing percentage values across rows produces a meaningless total. The correct pattern is SUMX on the underlying drivers: compute (Revenue - Cost) per order via SUMX, then divide by a SUM of revenue for the denominator to arrive at a true weighted margin.
A second common error is assuming SUMX and SUM are interchangeable when a single table is in use. They may return identical results in an unfiltered state, but as soon as a report slicer restricts the data or a relationship introduces rows from a joined table, the two functions diverge. A model that passes in the unfiltered state but fails under any filter is not a correct model - it is a deferred problem.
Where SUMX Is Mandatory: Calculations SUM Cannot Handle
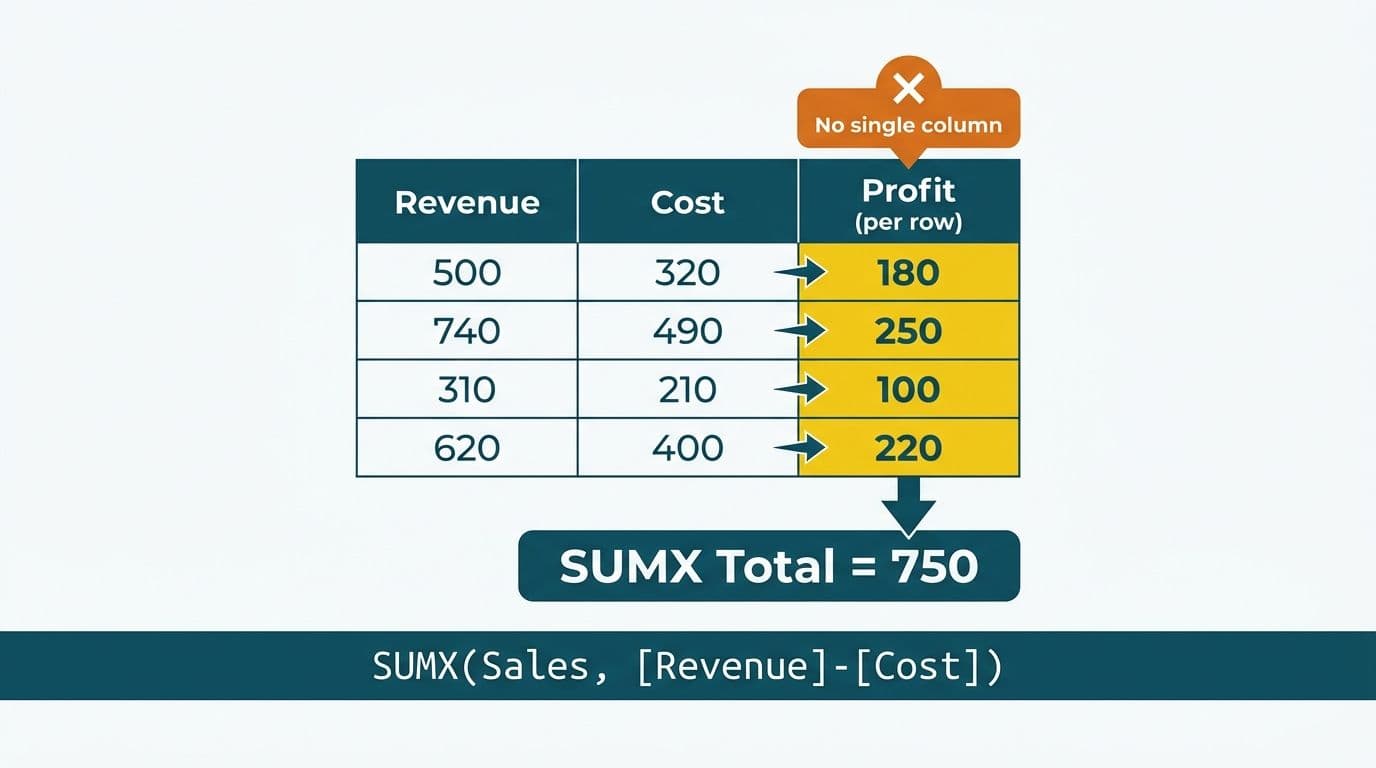
Some financial and operational patterns make SUMX non-negotiable.
Multi-currency financial consolidation. A US SaaS finance team reporting consolidated revenue across USD, GBP, CAD, and EUR must convert each transaction to a base currency before totalling. The conversion factor varies by row and may come from a related rates table joined at currency code and reporting period. SUMX iterates the transaction table, pulls the applicable rate via RELATED(), applies the conversion per row, and sums the results. SUM applied to a mixed-currency Amount column produces an arithmetically invalid number that will fail any standard currency reconciliation. For multi-entity organizations with legal entities in the US, UK, and Canada simultaneously, this error means consolidated revenue figures cannot be reconciled to functional-currency reports or audited financials.
Healthcare revenue cycle analytics. In a healthcare revenue cycle analytics dashboard, net collections depend on subtracting claim-level contractual adjustments from gross charges. Each claim carries a different allowed amount negotiated with the payer - Medicare, Medicaid, or a commercial insurer. Using SUM(Claims[GrossCharge]) minus SUM(Claims[Adjustment]) is mathematically equivalent to SUMX only in a single unfiltered table with one row per claim - which is almost never the case in a real revenue cycle model. Whether you are building in-house or working with a managed analytics service for healthcare providers, the claim-line granularity of the fact table determines which function is correct. For US healthcare organizations subject to HIPAA financial reporting requirements, producing incorrect totals from a DAX error is a governance risk. European healthcare providers processing patient cost data under GDPR face identical integrity expectations. Our Power BI healthcare reporting implementation cost guide covers model architecture decisions that affect this pattern at the design stage.
Prorated revenue recognition. A UK fintech firm recognizing subscription revenue across partial calendar months cannot sum a pre-built monthly column because the proration depends on active days per subscription per period. SUMX iterates each subscription row, computes (DailyRate * ActiveDays), and produces a correctly prorated total. SUM applied to an approximate monthly figure accumulates rounding errors across large subscriber books - a material issue for firms operating under FCA revenue recognition standards.
Inventory valuation with time-varying costs. A Canadian manufacturing company subject to PIPEDA data governance requirements may value inventory under weighted average cost, where cost changes with each goods receipt. SUMX can iterate the valuation table, compute (Quantity * CostAtDate) per batch, and sum across batches. A pre-built cost column is not a valid substitute because the cost embedded at import time goes stale between data refreshes.
Where SUM Is the Correct Choice
SUM is not the inferior option - it is the right choice in the majority of everyday measures and should be preferred whenever conditions allow.
Use SUM when:
- A numeric column already holds the aggregated or pre-calculated value at the correct granularity.
- Fact tables arrive from source systems with revenue, quantity, or cost already computed per transaction row.
- You need to reduce query latency: replacing unnecessary SUMX calls with SUM - where an equivalent column already exists - meaningfully reduces query computation, particularly on large models where managed Power BI service cost scales with query complexity and refresh volume.
- Whether you are working with Power BI dataflows vs datasets, when the dataflow transformation layer has already resolved row-level calculations upstream, SUM over the resulting dataset column is both correct and efficient.
A practical diagnostic: if you can write `SUM(Table[Column])` and that column holds exactly the value you want to total at the correct granularity, SUMX adds memory cost and complexity with no analytical benefit.
Teams working with a Power BI managed service for finance often find that a model audit of inherited reports identifies SUMX calls that can be safely replaced with SUM - reducing query latency without changing any reported figures.
SUMX vs SUM in Healthcare and Financial Services Reporting
Healthcare and financial services place the heaviest demands on DAX correctness because their reports feed compliance, clinical, and investment decisions.
Healthcare. Revenue cycle dashboards aggregate claim data across payers, procedures, date ranges, and adjustment categories. Using SUM on an aggregated line total will produce incorrect figures when a report slices by a dimension whose granularity does not match how the pre-aggregation was built. SUMX on the claim-line fact table - computing net reimbursement per line, then summing - is the robust pattern that holds under any combination of filters. A well-governed Power BI model for these environments starts with the architecture principles in our Power BI governance best practices guide.
Financial services. Portfolio performance reports that SUM return percentages across positions are wrong by construction - returns are not additive across positions of different sizes. The correct measure uses SUMX to compute each position's contribution (market value multiplied by its return rate), sums those contributions, then divides by total portfolio value. A report built this way holds under any asset class or date range filter. One built on SUM of returns fails the moment positions are filtered to a subset.
Connecting the DAX layer to automated pipelines. Modern Power BI implementations route data through automated ingestion and transformation workflows. Understanding how AI workflow automation connects to Power BI determines whether your SUMX measures receive the granular row-level data they require, or pre-aggregated data that makes the iterator unnecessary. Designing the pipeline and the DAX layer together - rather than retrofitting one to the other - prevents this class of error at scale.
Performance Considerations When Using SUMX
SUMX is more computationally expensive than SUM because it materializes a row context for every row in the table on each query. On small tables the difference is negligible. On models with tens of millions of rows - common in healthcare revenue cycle datasets or multi-year transactional histories in financial services - an unnecessary SUMX can degrade report render time enough to affect user adoption.
Practical rules for managing SUMX performance:
- Filter before iterating. Wrap the table argument in CALCULATETABLE or FILTER only when necessary, and push filters upstream to minimize the rows SUMX must process.
- Avoid nested iterators without cause. Nesting SUMX inside SUMX multiplies computational cost. Restructure to a single iterator wherever logic permits.
- Consider calculated columns for fixed row-level expressions. If a row-level calculation never needs to respond dynamically to filter context, computing it as a calculated column moves the cost to data refresh time rather than query time.
- Understand your licensing tier. On Power BI Premium Per User or dedicated capacity, the VertiPaq engine handles iterators more efficiently than on shared Pro capacity - but sound DAX practice reduces cost at any tier.
For reporting across multi-year transaction histories in accounting and finance contexts, the difference between a well-tuned SUM measure and an unoptimized SUMX can translate to meaningful differences in user-facing render times and report reliability under filtering.
If your Power BI model is producing totals your finance team cannot reconcile, or you need a structured DAX review ahead of a compliance audit, AI automation consulting from Lets Viz covers the full stack from data model design through automated deployment.
---
About Lets Viz: Lets Viz has delivered data analytics and automation solutions since 2020, serving clients across US healthcare, UK fintech, Canadian manufacturing, and global SaaS. The team holds a 5.0 Clutch rating and specializes in Power BI model design, DAX optimization, and automated reporting pipelines built to meet HIPAA, GDPR, and PIPEDA compliance requirements.