Zoho Analytics vs Excel for Business Reporting: When to Switch
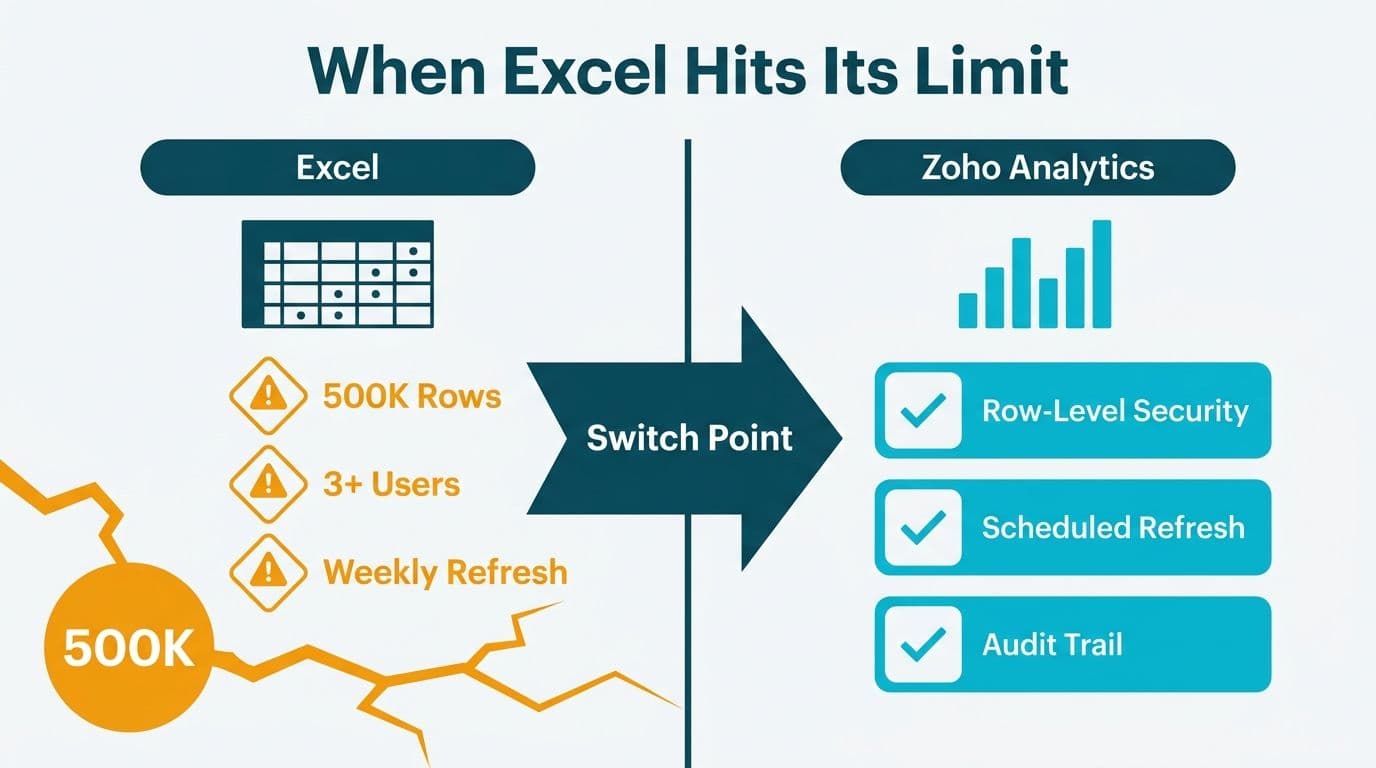
Excel becomes a liability for business reporting when your dataset exceeds 500,000 rows, your team has more than three concurrent report consumers, or you need data refreshes faster than weekly. At any of those thresholds, a dedicated BI platform like Zoho Analytics delivers row-level security, scheduled refresh, and a full audit trail that spreadsheets cannot match - at a fraction of the cost of enterprise alternatives.
Key Takeaways
Excel reliably fails at three specific thresholds: datasets above 500K rows, more than three concurrent report consumers, or refresh cycles faster than weekly.
Zoho Analytics closes the gap between spreadsheet chaos and enterprise BI at mid-market pricing, with native connectors to 500+ data sources including Zoho CRM, ERP systems, and cloud databases.
Healthcare and finance teams carry compounding regulatory risk from Excel: HIPAA, SOC 2, GDPR, and PIPEDA auditors increasingly flag uncontrolled workbook access as a reportable finding.
Migration from Excel to Zoho Analytics typically completes in four to eight weeks for a mid-market team with reasonably clean source data.
Teams already on Zoho CRM or Zoho One realize the fastest ROI because the analytics connector requires zero additional configuration time.
When Does Excel Actually Break for Business Reporting?
Excel breaks earlier than most operations teams expect - and it fails in three distinct, predictable ways.
Row volume is the most visible limit. Excel's worksheet ceiling is 1,048,576 rows, but performance deteriorates well before that ceiling is reached. A US healthcare billing team running monthly accounts-receivable aging reports experienced pivot table refresh times exceeding 12 minutes at 400,000 rows. Before a single analyst had the patience to wait, the file had already been duplicated into three working copies with diverging figures. The reporting tool had become the source of error, not just a source of delay.
Concurrent users trigger the second failure mode. When more than two or three analysts need to read or edit the same workbook simultaneously, version conflicts become near-certain. A finance director at a Canadian manufacturing firm - subject to PIPEDA data-handling obligations - described an external audit finding in which the same budget model existed in 14 slightly different versions scattered across email threads. Auditors flagged it as a control deficiency, not a tool limitation.
Refresh frequency is the third and most underestimated threshold. Excel requires a human to pull, paste, or run a macro every time underlying data changes. If your stakeholders need daily or intraday visibility into revenue, patient throughput, or inventory positions, manual refresh is not a workflow - it is a full-time job hidden inside an analyst's schedule, and it is the first thing to collapse when that analyst is sick, on leave, or has moved on.
The most common engagement our Zoho consulting services team is brought in to address is not a complex data warehouse migration. It is liberating finance and operations teams from the three failure modes above - usually before a compliance finding forces the conversation.
Zoho Analytics vs Excel for Business Reporting: A Direct Comparison
The comparison is not a fair fight at scale. Excel is a calculation tool stretched into a reporting and distribution role over decades of organizational inertia. Zoho Analytics was designed as a BI platform from the ground up, with governance, sharing, and scheduled refresh as first-class capabilities.
| Dimension | Excel | Zoho Analytics |
|---|---|---|
| Row capacity | 1,048,576 per sheet | 500M+ rows (cloud) |
| Concurrent users | 2-3 practical maximum | Unlimited (role-based) |
| Scheduled refresh | Manual or macro-driven | Automated (hourly minimum) |
| Row-level security | File permissions only | Per-user, per-row filters |
| Audit trail | None built-in | Full access and change log |
| Native connectors | Manual import / ODBC | 500+ (Zoho CRM, Salesforce, GA4) |
| Collaboration model | Shared drive or email | URL-based permission-gated sharing |
| HIPAA / GDPR support | Requires manual controls | Built-in workspace isolation |
| Licensing at 10 users | Included in M365 | ~$115-$575/month by tier (2026 pricing) |
The cost row requires context. Excel's apparent "free" status disappears when you count the analyst hours spent on data hygiene, version reconciliation, and fielding ad-hoc report requests from stakeholders who cannot access the source file directly. Mid-market finance teams typically spend eight to twelve analyst-hours per week on tasks Zoho Analytics automates. At a fully-loaded analyst cost of $80,000 per year, that is $31,000 to $46,000 in avoidable annual labor per person - frequently more than the annual license cost of Zoho Analytics at its largest available tier.
The World Economic Forum (2025) convened over 100 experts representing more than 50 major financial services organizations to address the industry's transition toward governed, AI-assisted analytics. By mid-2026, that imperative has moved decisively downstream: organizations with fewer than 500 employees now represent the fastest-growing segment of new cloud BI deployments, driven by compliance pressure and AI querying capabilities that eliminate the analyst bottleneck that made BI platforms impractical for smaller teams a decade ago - a signal that automated reporting is no longer a large-enterprise concern but a mid-market imperative.
Zoho Analytics' built-in AI query layer, Zia Analytics, gives non-technical stakeholders a natural language interface to data without requiring them to write formulas or learn a proprietary query language. This capability is broadly comparable to what Power BI Copilot offers Microsoft-stack organizations, though Power BI Copilot licensing requirements introduce a separate procurement step - typically Premium Per User or Fabric capacity - that mid-market teams frequently find cost-prohibitive. Finance directors evaluating the comparison often note that Zoho Analytics requires no DAX learning curve to produce a first useful report, which matters considerably when onboarding a team that has spent years inside spreadsheets.
How Does Excel Compliance Risk Compound in Healthcare and Finance?
Regulated industries face a cost that never appears in a standard tool comparison: compliance and audit exposure that scales with every person who touches an uncontrolled spreadsheet.
In US healthcare, HIPAA requires covered entities to implement access controls, audit controls, and transmission security for protected health information. An Excel workbook containing patient financial data shared via email or a network drive fails at least two of those three safeguard categories by default. A single PHI exposure incident carries civil penalties from $100 to $50,000 per violation under HITECH Act tiering, with OCR enforcement activity accelerating through 2026 and average resolution agreement amounts reaching record levels. For healthcare CFOs and finance directors, the compliance argument alone often closes the Excel migration decision without further cost-benefit analysis.
UK fintech firms operating under GDPR face parallel obligations. A data subject access request requires your organization to demonstrate exactly who accessed personal data, when, and under what authority. An Excel file circulated across a SharePoint site offers no such audit trail. Zoho Analytics' workspace permission model and built-in access logging satisfy this requirement natively, with no custom development or manual evidence assembly required at audit time.
Canadian organizations subject to PIPEDA - and newer provincial legislation in Quebec under Law 25 - face comparable accountability requirements. A Vancouver-based insurance brokerage we worked with had 14 brokers sharing a single Excel workbook for client premium tracking. After a staff departure, the organization could not confirm which client records had been accessed or exported. Migrating that workflow to Zoho Analytics resolved the accountability gap in one sprint and eliminated the firm's most significant PIPEDA exposure point.
For healthcare-specific dashboard design considerations, see our healthcare KPI dashboard examples by department. Finance teams can explore analytics adoption patterns across both sectors in our AI analytics use cases in healthcare and finance guide.
What Does a Mid-Market Excel-to-Zoho Analytics Migration Actually Involve?
Migration scope varies significantly depending on how far Excel has been adopted as a quasi-BI tool. Three patterns account for the vast majority of mid-market projects.
Pattern 1: Pivot Table Replacement (two to three weeks). One or two standing reports - typically revenue by region and AR aging - are rebuilt as Zoho Analytics dashboards connected directly to the source ERP or CRM. The team retains Excel for ad-hoc calculation and scenario modeling; Zoho Analytics handles the standing reports that need to be reliable, shareable on a schedule, and audit-ready. This is the fastest path to eliminating the three failure modes above for your highest-priority outputs.
Pattern 2: Shared Workbook Migration (four to six weeks). A single workbook that multiple teams update manually is replaced by a Zoho Analytics workspace connected to the authoritative source system. This pattern eliminates version conflicts, resolves the audit findings that accompany them, and typically removes four to six hours of weekly reconciliation work from the finance team's calendar. Data validation and access configuration account for most of the timeline.
Pattern 3: Excel Data Model Migration (six to twelve weeks). Some teams have built sophisticated Power Query pipelines or VBA-driven calculation models inside Excel. These require the most preparation. Data model logic must be rebuilt in Zoho Analytics' formula layer or moved upstream into a staging layer before the migration can begin. Teams that have previously worked through a tableau to power bi migration checklist for another tool transition will recognize the sequencing: inventory the current model, map all data dependencies, rebuild in the target environment, run parallel validation for two to four reporting cycles, then cut over.
In each pattern, the critical success factor is data quality upstream of the migration, not the tooling selected. Teams migrating complex calculation models frequently find that data quality work in the source system - often in CRM opportunity data - accounts for a significant share of the overall timeline. Once source data is reliable, the Zoho Analytics configuration itself moves quickly.
Before committing to a migration timeline, the free BI readiness self-assessment identifies data quality, governance, and skills gaps that affect both scope and duration.
When Should You Consider a Different BI Platform?
Zoho Analytics is the right default for mid-market teams already operating within the Zoho ecosystem, organizations that need fast time-to-value without heavy IT involvement, and finance or operations teams where licensing cost is a genuine constraint. It is not the right answer for every scenario.
Consider an alternative platform if your situation matches one of the following:
Your data science team requires embedded Python or R notebook environments for predictive modeling. Zoho Analytics supports foundational ML models and forecasting, but it is not a full data science workbench. Teams with mature model-development practices typically need a more open-ended environment for iterative experimentation.
Your organization has standardized on Microsoft 365 E5 and your BI stakeholders are already exploring how to enable Copilot in Power BI across their existing semantic models. In that scenario, evaluating Power BI Copilot data model readiness and understanding which scenarios fall within the Power BI Copilot scenario library may be the more practical investment - particularly when Power BI Premium licensing is already partially funded through existing Microsoft agreements. Teams asking how to learn Power BI coming from Tableau, or running an active tableau server to Power BI service migration, are likely already committed to the Microsoft ecosystem and should complete that transition rather than introducing a second BI platform in parallel.
Your reporting volume has grown to petabyte scale and requires managed cloud data infrastructure. At that point, dedicated data platform solutions become relevant, as covered in our comparison of Microsoft Fabric vs Power BI.
For finance teams evaluating the full BI landscape, our best AI tools for finance professionals guide covers the analytics market across price tiers and use cases.
The practical answer for most mid-market operations teams: if you are genuinely asking whether Excel is breaking for your organization, it already has. The question is which BI platform fits your ecosystem, your compliance requirements, and your budget. For organizations between 50 and 500 employees that are not already committed to an enterprise platform stack, Zoho Analytics consistently delivers the fastest, most cost-effective path to governed, scalable reporting.
Our Zoho consulting services team specializes in Excel-to-BI migrations for healthcare and finance organizations across the US, Canada, and the UK - from initial scoping and data quality assessment through dashboard handoff and team training. Ready to explore the platform first? Try Zoho Analytics free and connect with us when you are ready to scale.
---
About Lets Viz: Lets Viz is a data analytics consulting firm that has served US healthcare providers, UK fintech firms, Canadian manufacturing companies, and global SaaS businesses since 2020. With a 5.0 Clutch rating and certified expertise across Zoho Analytics, Power BI, and the modern data stack, our team has guided dozens of mid-market organizations from fragmented, spreadsheet-driven reporting to governed, scalable BI environments built for audit and scale.