Zoho Analytics Dashboard Examples for Sales and Finance
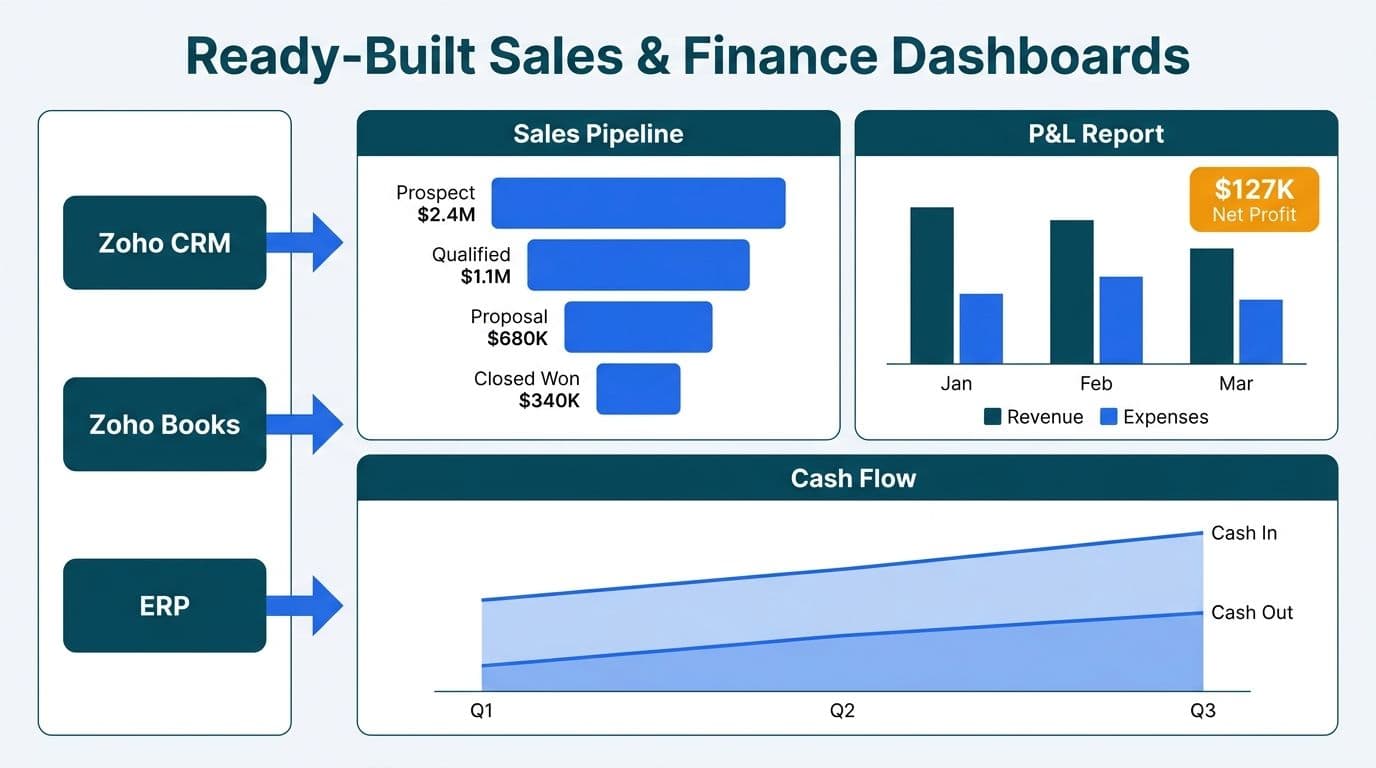
Zoho Analytics ships pre-built dashboard examples for sales pipeline tracking, profit-and-loss reporting, and cash-flow analysis that mid-market teams can adapt in days rather than months. Each template connects natively to Zoho CRM, Books, or an external ERP, and the platform's granular permissions let CIOs lock sensitive P&L data to the finance directors and analysts who need it.
Key Takeaways
Zoho Analytics provides ready-to-use templates for sales pipeline, P&L, and cash-flow dashboards, each connectable to Zoho CRM, Zoho Books, or third-party ERPs.
Zia, Zoho's built-in AI assistant, auto-generates trend summaries and anomaly alerts inside any dashboard without additional model configuration.
Role-based access controls and row-level security are standard, satisfying audit requirements under HIPAA (US healthcare), GDPR (UK/EU), and PIPEDA (Canada).
Finance directors gain the most value from period-over-period comparison views and drill-through layouts that move from board-level KPIs to transaction detail.
Metric definitions and data-quality validation must come before dashboard design - silent data errors invalidate even well-structured layouts.
What Are Zoho Analytics Dashboard Examples for Sales and Finance?
Zoho Analytics dashboard examples are pre-configured report layouts that combine charts, pivot tables, and KPI widgets into a single interactive screen. The platform's built-in Workspace Templates gallery includes purpose-built layouts for CRM performance, financial statements, and operational reporting.
Beyond the template gallery, organizations that need custom formula columns, multi-source blending, or HIPAA-grade access controls typically require additional configuration - the scope that Zoho consulting services engagements cover as part of a structured implementation.
How the template gallery works. When you create a new workspace in Zoho Analytics, the platform offers to pre-populate it with sample data and a set of default dashboards tied to that data source. For a Zoho CRM sync, this includes a sales rep performance board, a pipeline-by-stage funnel, and a monthly trend line for deals closed. For Zoho Books, it includes an income statement, a balance sheet summary, and a cash-position widget.
These starting points are not finished products. A "qualified lead" in a US SaaS company means something different from a "warm prospect" in a UK fintech firm, and neither matches the "active referral" a Canadian wealth-management practice tracks. The templates provide structure; configuration turns structure into decision-support.
What Does a Zoho Analytics Sales Dashboard Example Look Like?
A production Zoho Analytics sales dashboard contains four core panels: a pipeline-by-stage funnel, a win-rate trend by rep or team, a deal-velocity widget showing average days from creation to close, and a revenue-forecast figure that rolls up weighted probability across open opportunities.
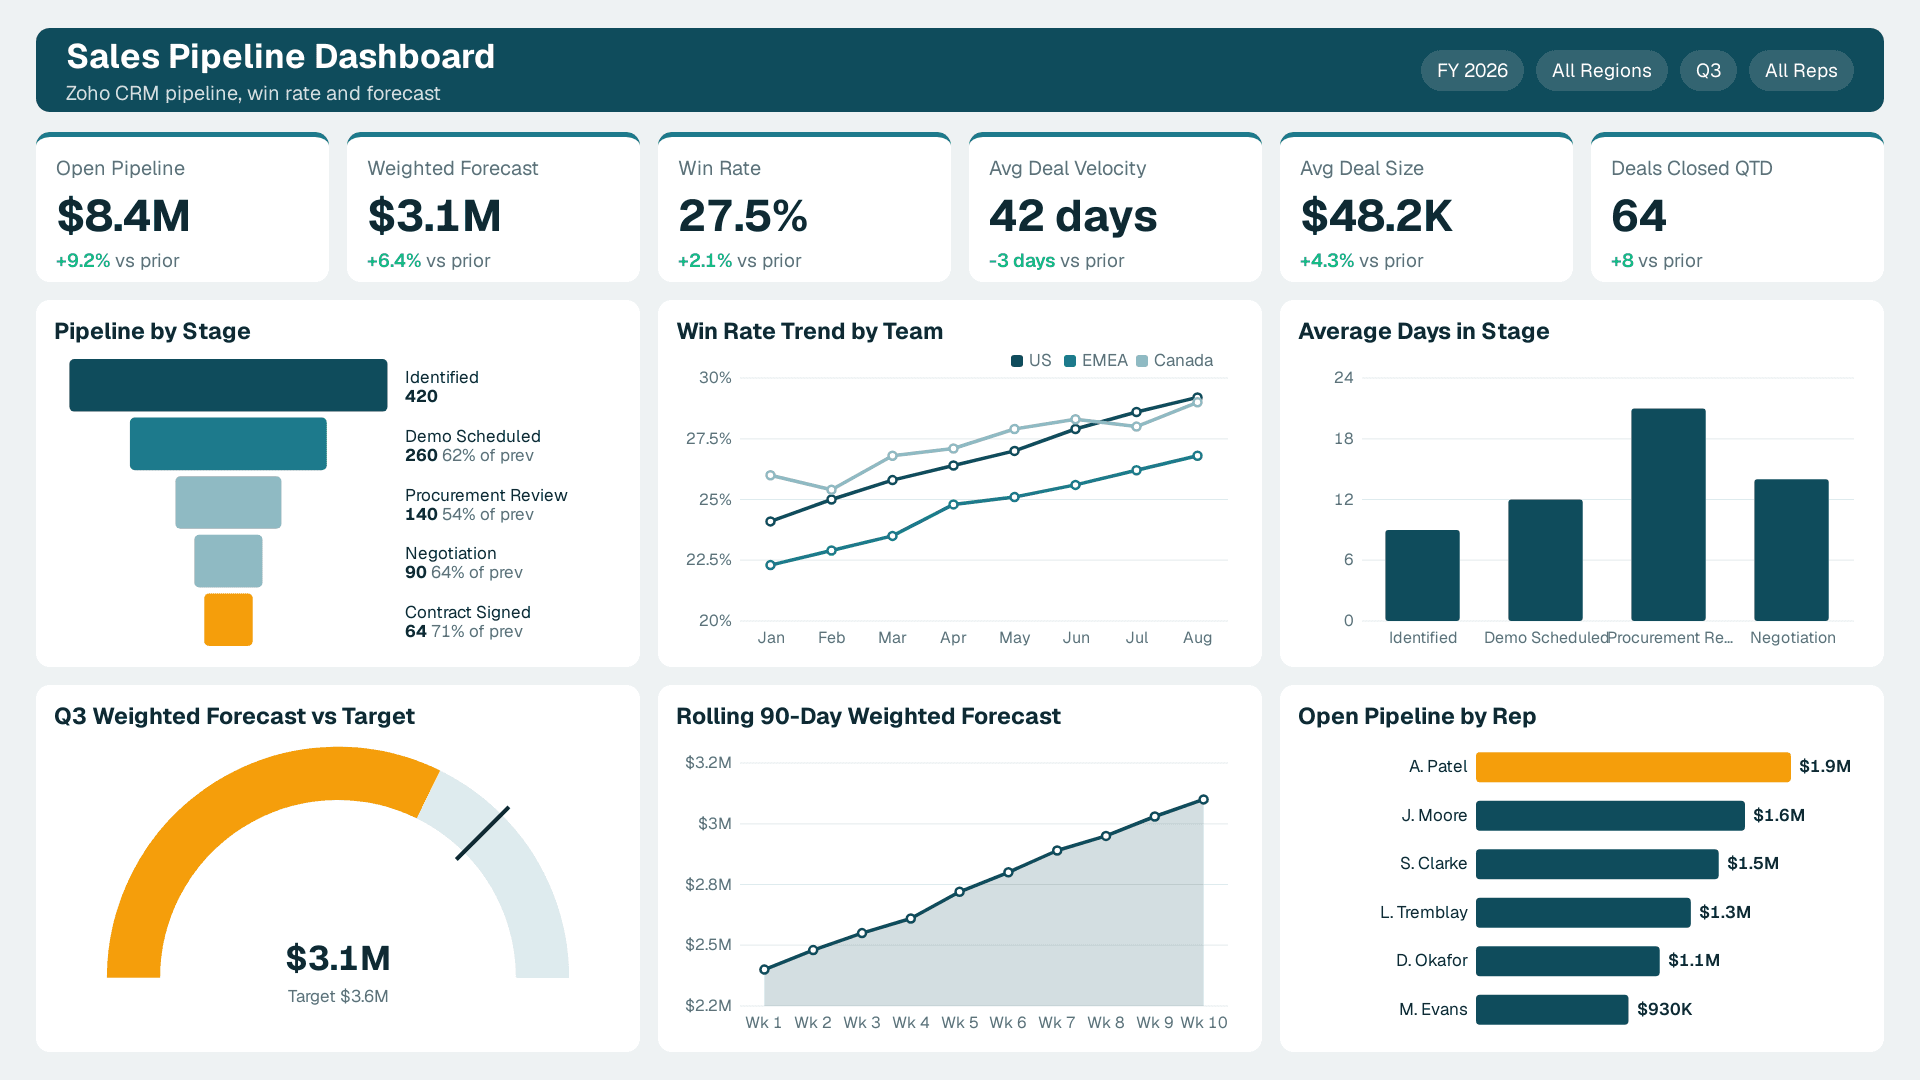
The standard Zoho CRM connector syncs Accounts, Contacts, Leads, and Deals on a schedule you define - down to 15-minute refresh intervals on paid plans (Zoho Analytics, as of 2025). Formula columns inside Zoho Analytics derive metrics not stored natively in CRM, such as "days since last activity" or "stage age."
Funnel analysis
Zoho Analytics includes a dedicated Funnel Chart widget. Dragging the CRM Stage field into the funnel automatically calculates conversion rates between each stage. A US healthcare technology company tracking provider partnerships, for example, might configure stages - Identified, Demo Scheduled, Procurement Review, Contract Signed - then monitor where prospects stall most frequently.
Filtering and drill-through
Dashboard-level filters let a regional sales director in Toronto view only the Canadian pipeline while a London-based VP sees the full EMEA book. Row-level security enforces this boundary automatically when each user's login maps to a region attribute in the underlying dataset.
Revenue forecasting
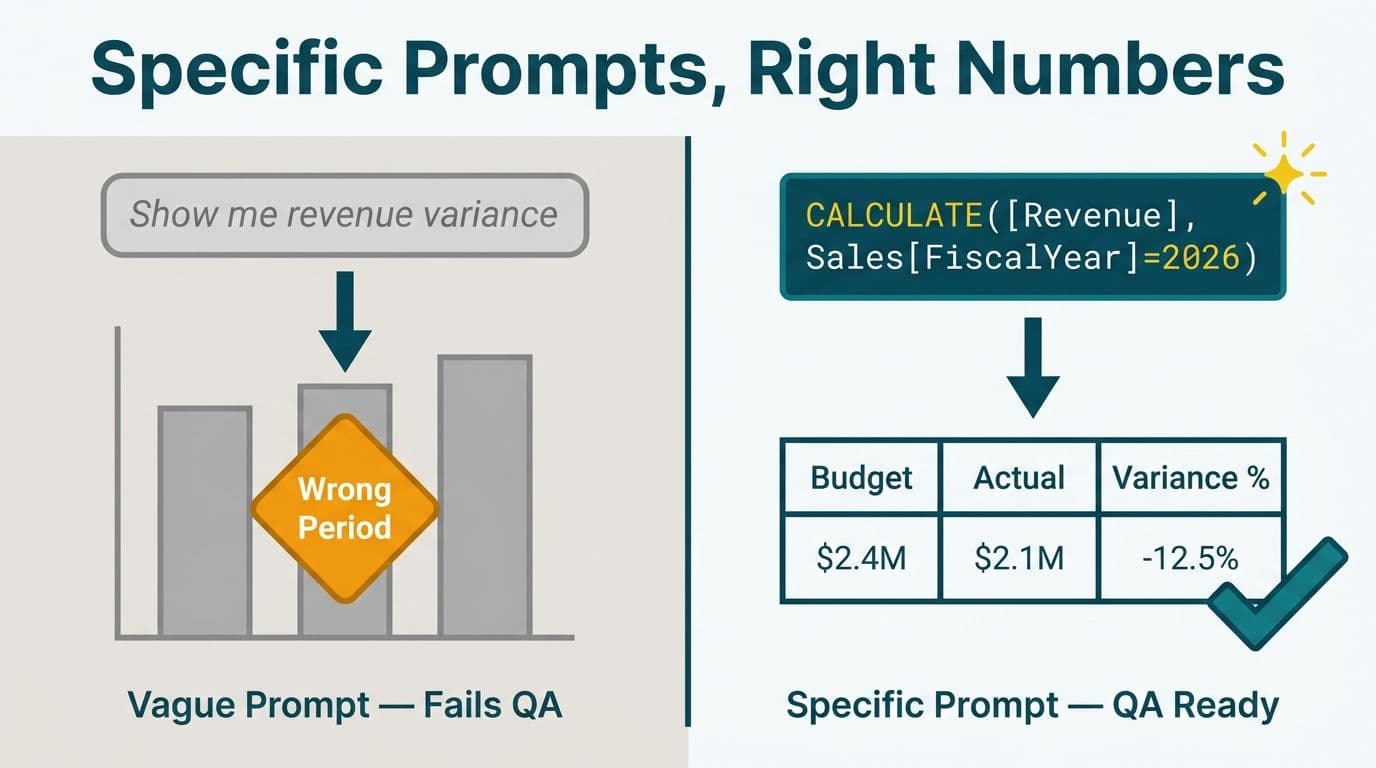
Zoho Analytics's Ask Zia feature lets a sales manager type "Show me forecasted Q3 revenue by product line" directly into the dashboard search bar and receive a chart in seconds, without building a new report. For teams that want a more structured forecast model, weighted-pipeline formulas can be created as formula columns: `Deal_Amount * Close_Probability / 100`. The result feeds a rolling 90-day forecast tile that sales operations can monitor daily.
How Do You Build a P&L Dashboard in Zoho Analytics?
A P&L dashboard starts with a clean general-ledger feed. For Zoho Books customers, the native Books connector maps Chart of Accounts categories to pivot-table rows and adds period-over-period columns - current month, prior month, year-to-date, prior-year-to-date - in a single configuration step.
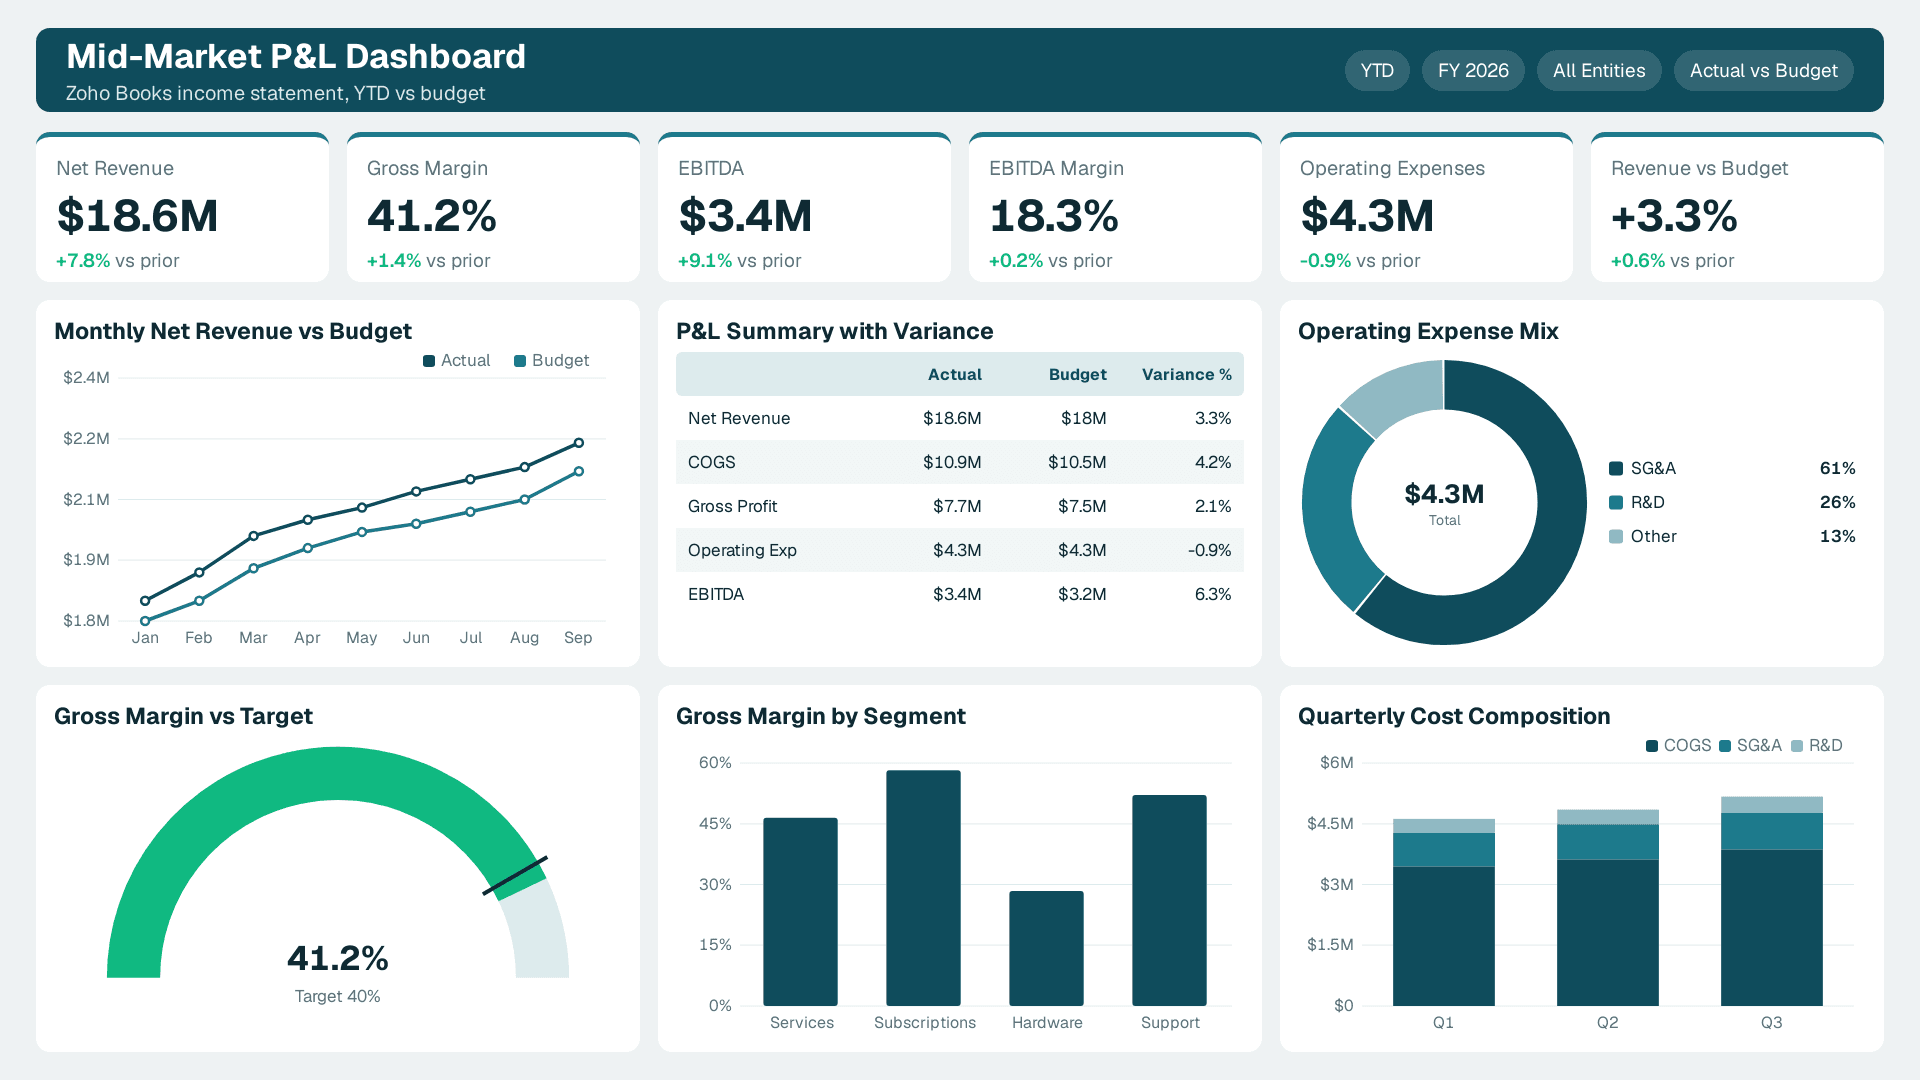
For organizations using a non-Zoho ERP - common in Canadian manufacturing and UK financial-services firms - the Import API or a scheduled CSV push handles the data layer. Consistent revenue, COGS, and expense tagging at source is the prerequisite for a reliable P&L view.
Chart of Accounts mapping
When connecting Zoho Books to Zoho Analytics, the connector exposes all account categories as rows. Finance teams typically create a lookup table that maps account codes to P&L line items - Revenue, COGS, SG&A, R&D, Other - and then use that lookup to aggregate the income statement correctly. This mapping step is where most first-time implementations encounter friction, because account naming conventions in Books often diverge from the format a CFO expects on the board deck.
Key components of a mid-market P&L layout
Period selectors in the header (month, quarter, trailing-twelve-months)
Revenue waterfall - gross revenue minus returns equals net revenue
Gross margin widget - dollar figure and percentage together
EBITDA summary for board-level period comparisons
Variance column - actual versus budget, color-coded via conditional formatting
Zoho Analytics's conditional formatting applies red/amber/green coding to the variance column automatically once threshold rules are set - no custom code required.
Compliance note
Finance dashboards that include patient billing data must sit behind a HIPAA Business Associate Agreement for US healthcare organizations - Zoho Corporation offers BAAs as part of enterprise agreements (Zoho Privacy, as of 2025). UK and EU organizations subject to GDPR should confirm that data residency is set to the EU region inside workspace settings. Canadian firms covered by PIPEDA should review Zoho's cross-border data transfer policies before connecting payroll or personal financial data.
What Should a Cash-Flow Reporting Dashboard Include?
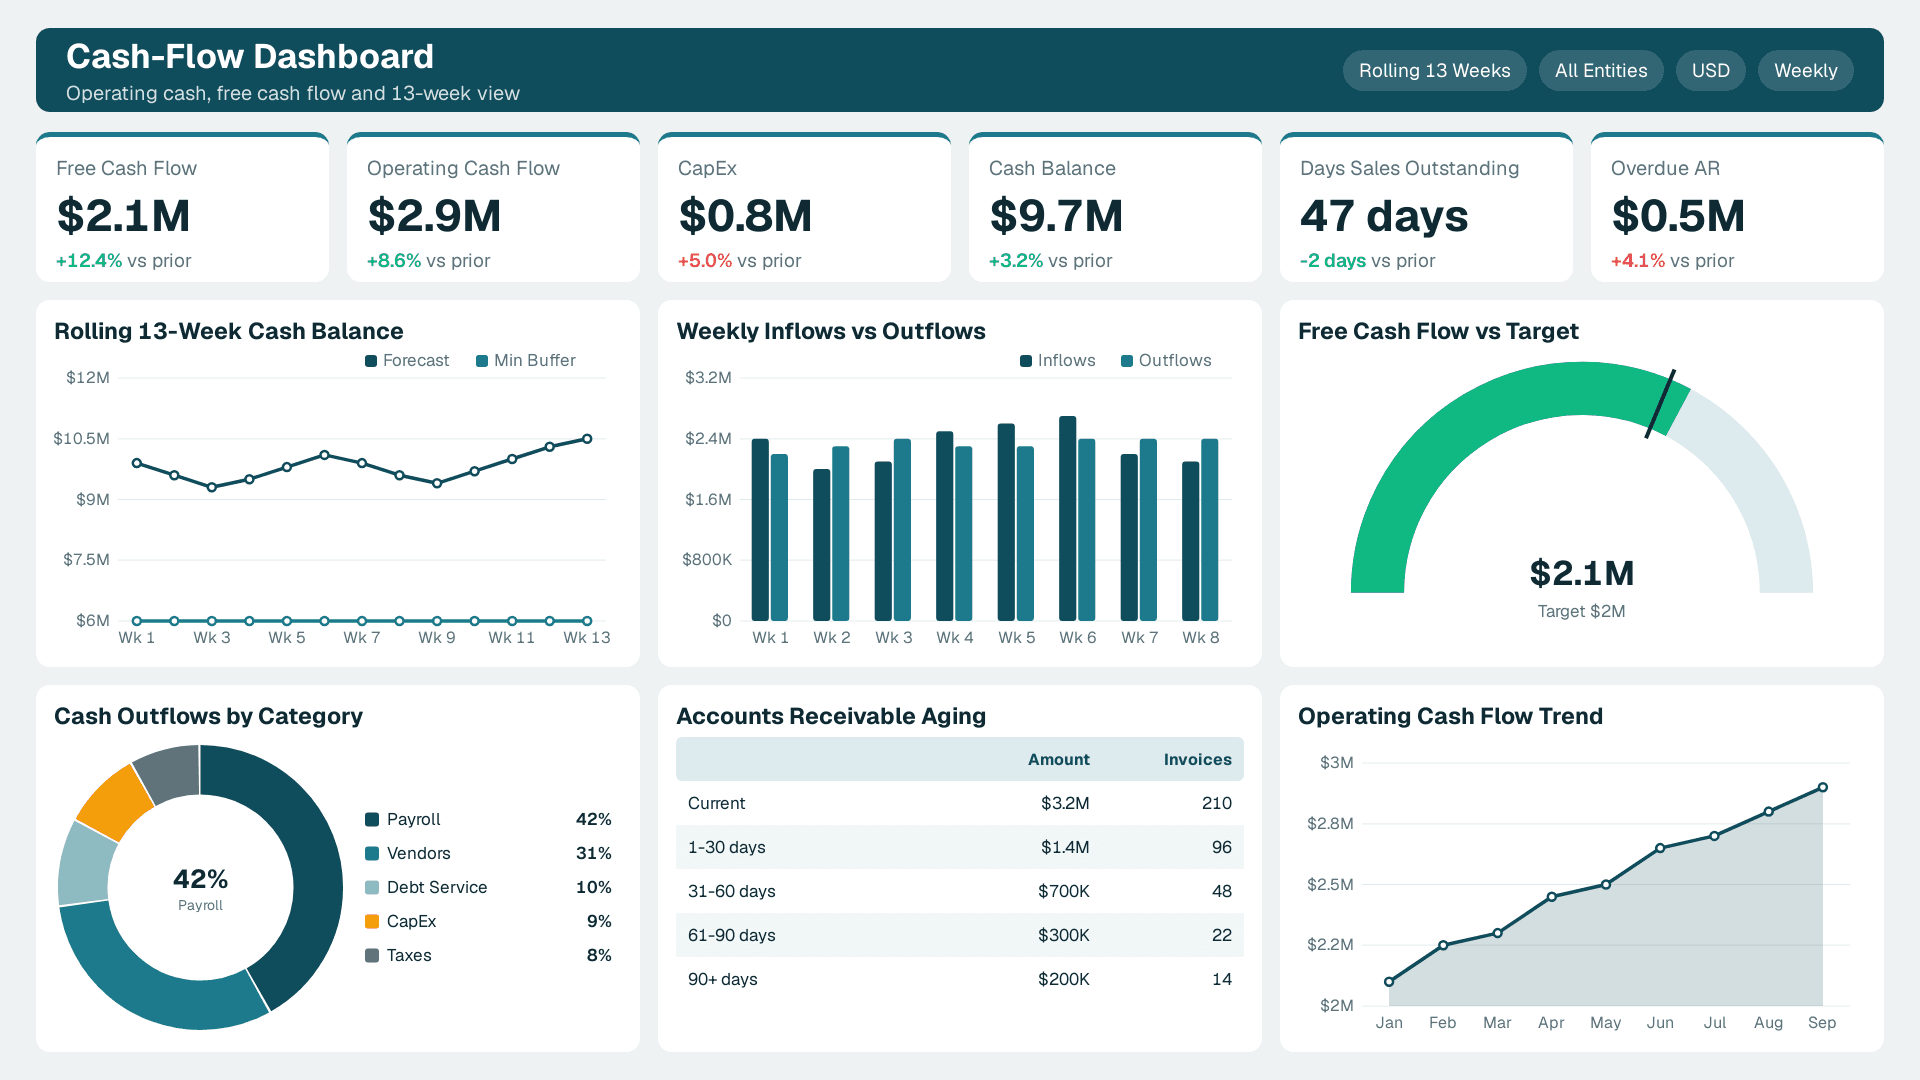
Cash-flow dashboards are the most underbuilt category in mid-market analytics. Most teams have income statements; far fewer have a live operating-cash view that refreshes at least weekly. A complete Zoho Analytics cash-flow dashboard mirrors a standard Statement of Cash Flows:
| Section | Key Metrics | Typical Data Source |
|---|---|---|
| Operating activities | Collections, payroll, net operating cash | Zoho Books, bank feed |
| Investing activities | CapEx, asset disposals, acquisitions | ERP, manual upload |
| Financing activities | Loan draws, repayments, equity rounds | Zoho Books, spreadsheet |
| Summary | Net cash change, closing balance, runway weeks | Derived formula columns |
Free cash flow widget
A single KPI tile showing operating cash minus CapEx gives the CFO an instant read without opening a full report. Zoho Analytics's Custom Formula editor builds this in one expression once the constituent fields exist in the dataset.
Rolling 13-week cash view
Zoho Analytics's relative-date formulas support a rolling horizon that updates automatically each week. A US private-equity-backed portfolio company can publish a read-only version of this view to its board members using Zoho Analytics's Shared Views feature, with no login required for recipients - a useful pattern for investor reporting under tight information-control requirements.
How Does Zoho Analytics Support Healthcare Compliance Reporting?
Healthcare compliance reporting in Zoho Analytics covers two distinct needs: operational metrics (patient throughput, claims status, appointment utilization) and financial metrics (cost per encounter, reimbursement lag, payer-mix revenue).
Zoho's row-level security model lets compliance officers restrict PHI-adjacent fields - such as patient identifiers linked to financial records - to only the analysts cleared to view them. This is a prerequisite for any US healthcare organization operating under HIPAA, and the same control layer satisfies similar obligations under GDPR for UK providers handling patient financial data.
Zia for anomaly detection
Zoho Analytics's AI assistant, Zia, flags statistical anomalies in a claims dashboard automatically - for example, a sudden spike in denied claims from a specific payer code. Rather than a compliance officer scanning rows manually, Zia surfaces the deviation as a narrative insight card inside the dashboard (Zoho Analytics, as of 2025). Administrators can also configure Alerts - threshold-based triggers, set under the dashboard's Alerts panel - to send email notifications to designated recipients the moment an anomaly is detected, so the compliance officer receives the signal without needing to be logged in to the platform. This capability is available on Business and Enterprise plan tiers.
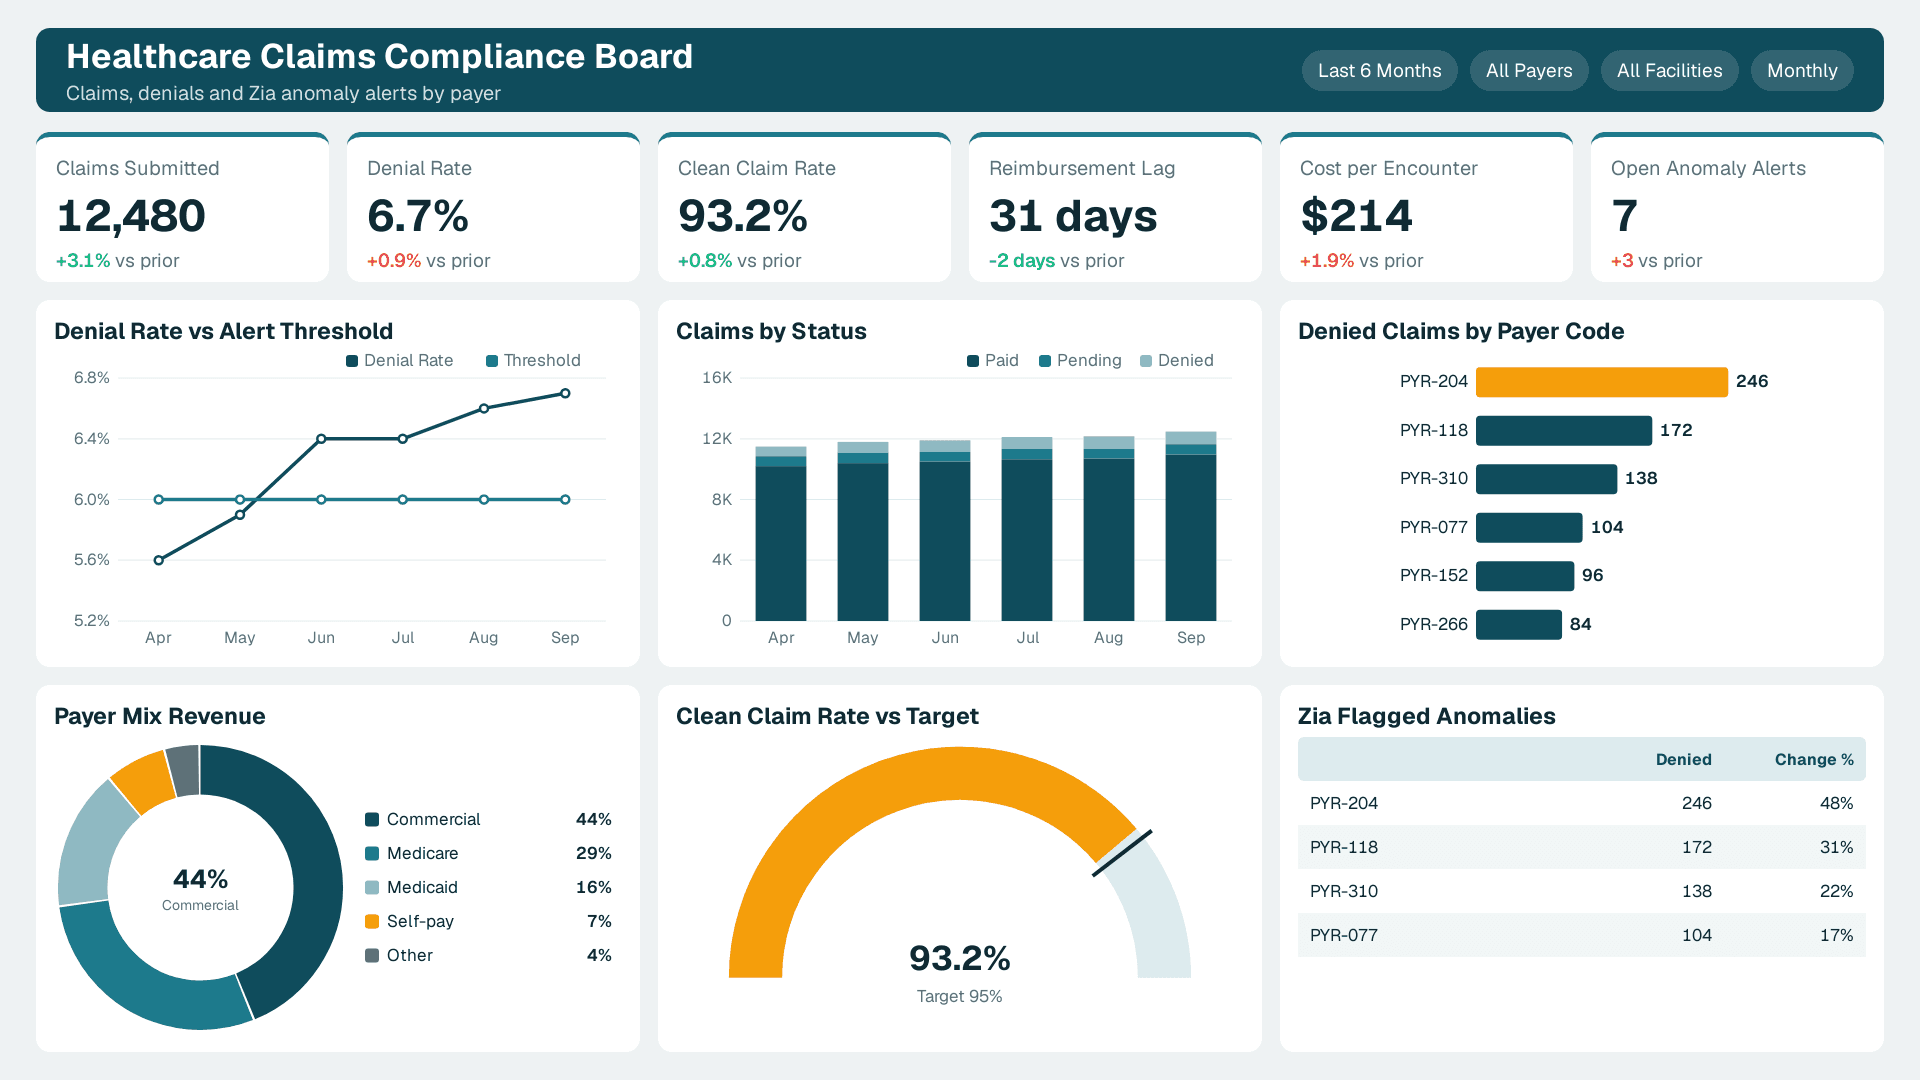
For a UK National Health Service supplier or a Canadian provincial health authority, the same anomaly-detection logic applies to GDPR and PIPEDA-governed datasets, with the added requirement that Zia's natural-language outputs do not expose personal data in the insight summary - a setting the workspace administrator controls.
What Zoho Analytics Integrations Power These Dashboards?
The Zoho One implementation guide covers the broader ecosystem, but for analytics specifically, the connector library spans Zoho CRM, Zoho Books, Zoho Desk, Salesforce, HubSpot, QuickBooks, Xero, Google Ads, and Stripe, plus direct connectors for Snowflake, BigQuery, Amazon Redshift, and Azure Synapse (Zoho Analytics, as of 2025).
Sales-to-finance data bridge
The most valuable integration pattern for mid-market firms is the CRM-to-Books bridge: deals closing in Zoho CRM trigger invoices in Zoho Books, and both datasets land in a single Zoho Analytics workspace. The Blend Data wizard — Zoho Analytics's point-and-click multi-source join tool — handles the cross-workspace merge without requiring SQL, making the join accessible to analyst-level users rather than just engineers. This eliminates the manual reconciliation step that typically delays monthly financial close by several days.
Connector refresh cadence
Zoho Analytics supports auto-sync for cloud connectors on schedules ranging from daily to every 15 minutes depending on the plan. For a sales team that needs near-real-time pipeline visibility, the 15-minute Zoho CRM sync on the Enterprise plan keeps dashboard data current without manual refresh. For finance teams where daily data is sufficient, a nightly sync from Zoho Books keeps the reporting window aligned with the accounting close cycle.
ERP connectors for finance teams
Organizations running SAP, Oracle NetSuite, or Microsoft Dynamics can push a GL extract into Zoho Analytics via the Import API. The GDPR Compliant SaaS Financial Reporting checklist covers the data-handling requirements that apply once personal financial data enters a cloud analytics platform - relevant for any UK or EU finance team moving from an on-premises ERP to a cloud BI layer.
When Should You Hire a Zoho Analytics Consultant vs. Keep It In-House?
The inflection point is roughly this: when a dashboard requires more than three connected data sources, custom formula columns, or row-level security tied to organizational hierarchy, the configuration complexity typically exceeds what a generalist analyst can deliver on a first attempt without prior Zoho Analytics experience.
What in-house analysts handle well. Standard reports built on a single Zoho CRM or Books workspace are well within reach of an analyst who has completed the Zoho Analytics certification available through Zoho's learning management system. The certification covers report types, formula syntax, and connector setup - a reliable foundation for single-source dashboard work. It does not cover multi-workspace blending or complex row-level security configurations.
Where a consultant accelerates delivery. Multi-source dashboards - combining Zoho CRM pipeline data with QuickBooks actuals and a spreadsheet budget - require workspace blending, lookup columns, and formula columns that interact across datasets. Getting these right on the first build, rather than after two or three rework cycles, is where specialist pattern recognition pays for itself. When HIPAA or GDPR requirements add compliance obligations to the technical scope, the cost of rework rises further.
See our Zoho Analytics pricing guide for the plan tier each feature requires before scoping a project.
| Scenario | Best Fit | Rationale |
|---|---|---|
| Single Zoho CRM or Books workspace | In-house analyst | Low complexity; certification covers it |
| Multi-source blend (CRM + ERP + budget) | Zoho Analytics consultant | Cross-workspace joins and formula columns |
| HIPAA / GDPR compliance configuration | Consultant or legal review | Data residency, BAA, RLS setup |
| Executive-facing P&L or board pack | Consultant | Layout standards, drill-through, scheduling |
| Ongoing dashboard maintenance | In-house after handoff | Analyst owns it post-delivery |
Data Quality Is the Dashboard's Foundation
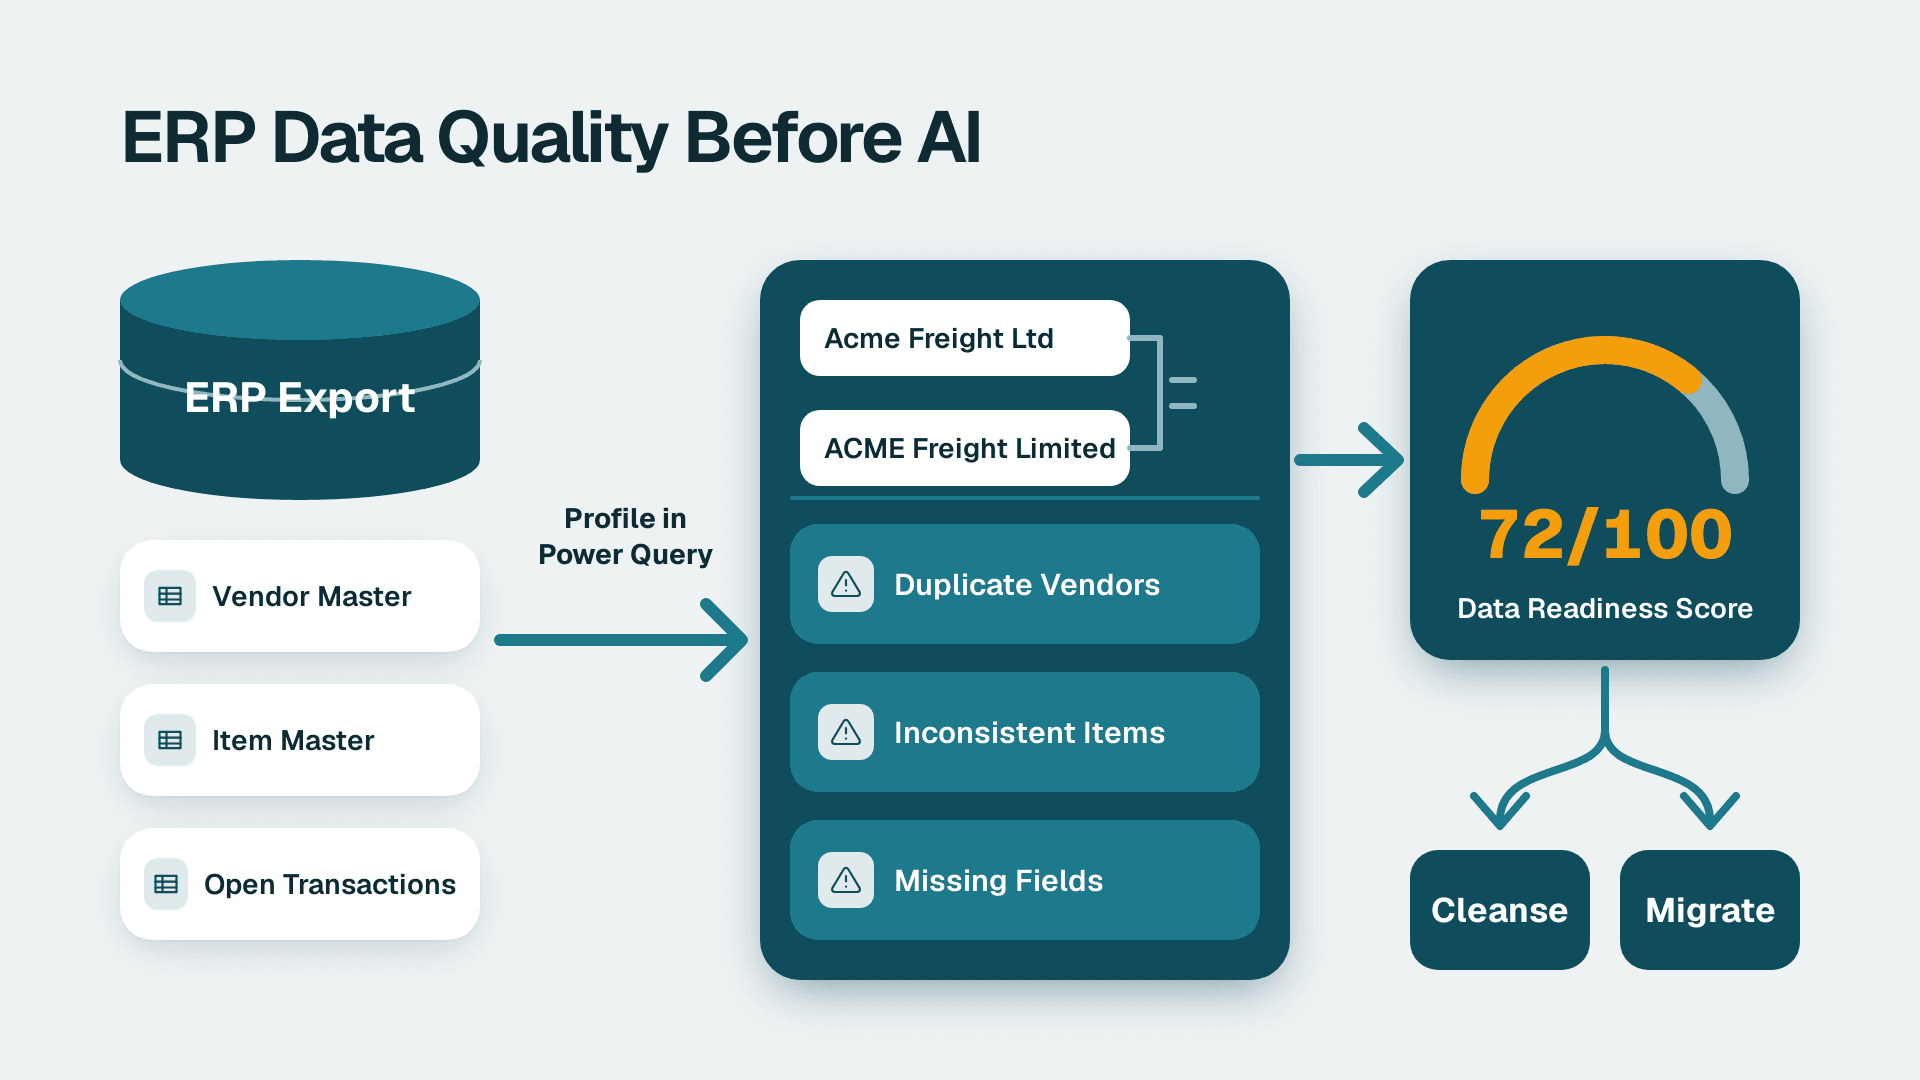
Even a well-designed Zoho Analytics dashboard fails when the underlying data carries silent errors. One engagement illustrates the risk: a home-services company's support dashboard was reporting excellent first-response times because Zoho Desk stores 0 hours - not a null value - for tickets that were never answered, so every ignored ticket counted as an instant response. We rebuilt the metric on real response data and validated it row by row across 105,704 tickets with zero mismatches before the corrected dashboard went live.
The same principle applies directly to sales and finance dashboards. A pipeline funnel pulling "won" deals from a stage field populated inconsistently by reps will show conversion rates that are precise but wrong. A P&L that includes unapplied credits in revenue will overstate gross margin. The dashboard is only as reliable as the field definitions and data-entry discipline behind it.
Before building any dashboard covered in this article, map each metric to its exact source field, document the business rule, and run a sample validation. Zoho Analytics's Query Tables feature lets you write the validation directly inside the platform and surface exceptions as a report before the dashboard reaches stakeholders.
For teams evaluating platforms before committing, the Looker Studio vs Power BI 2026 guide covers feature tradeoffs relevant to finance and sales use cases. Finance teams already running Power BI will find the FP&A Dashboard in Power BI build guide useful as a structural reference for what a mature finance dashboard should contain, regardless of BI tool chosen.
Ready to build your sales pipeline, P&L, or cash-flow dashboard on Zoho Analytics? Our Zoho consulting services team handles connector setup, formula configuration, and access governance from day one - book a discovery call to get started. Or explore the platform yourself: Try Zoho Analytics free.
---
About Lets Viz: Lets Viz has delivered data analytics and dashboard consulting to mid-market organizations since 2020, with a client roster spanning US healthcare providers, UK fintech firms, Canadian manufacturing companies, and global SaaS businesses. The firm holds a 5.0 Clutch rating and operates as a certified Zoho partner, with hands-on delivery experience across the Zoho Analytics integrations, compliance configurations, and multi-source dashboard architectures described in this article.