SUMX Power BI Finance: Aggregation Examples for FP&A
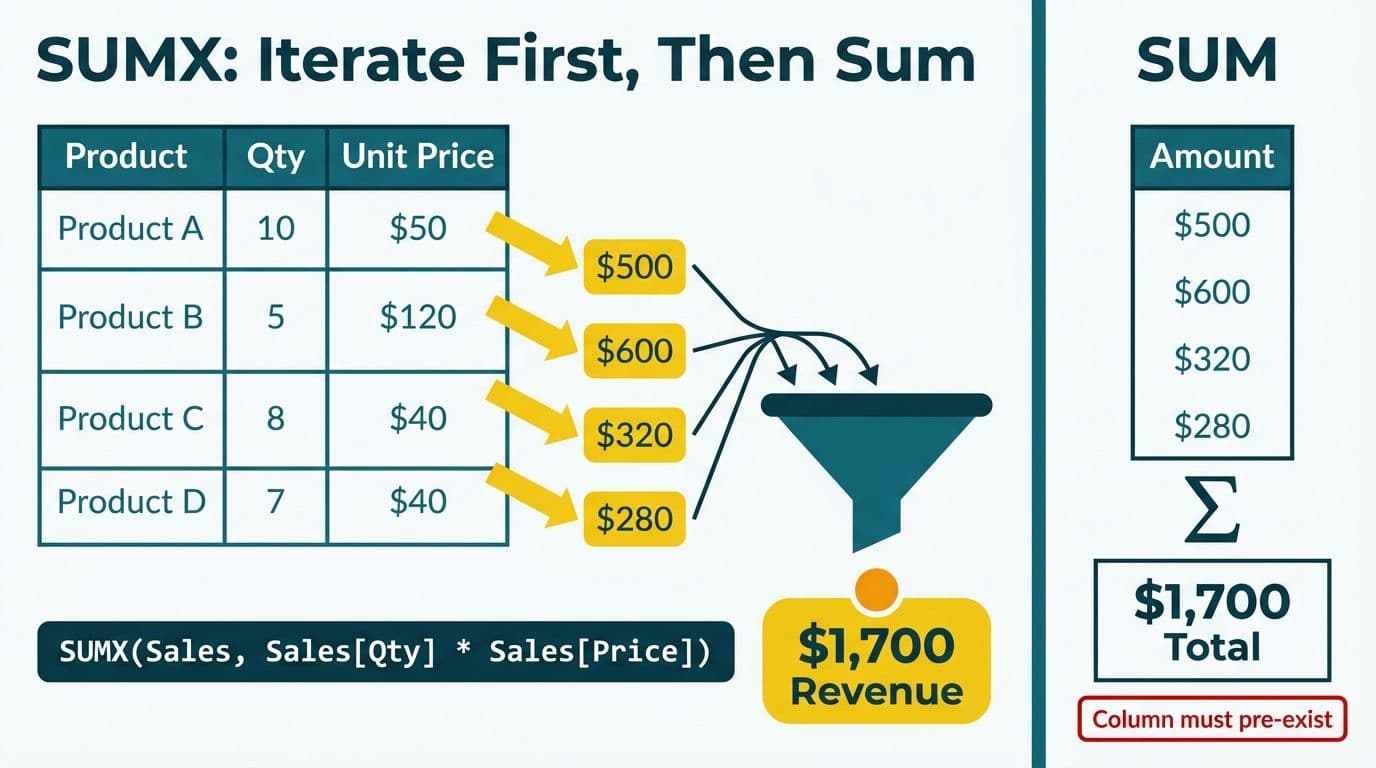
SUMX is an iterator function in DAX that evaluates an expression row by row across a table and returns the sum of those results. Unlike SUM - which totals a single pre-computed column - SUMX lets finance teams compute revenue, gross margin, and weighted-average unit cost at the transaction level before aggregating, making it the essential choice for multi-entity finance models where per-row calculations must precede roll-up.
Key Takeaways
- SUMX iterates row by row; SUM totals a pre-existing column - use SUM when the column already exists, SUMX when it does not
- Revenue, gross margin, and weighted-average unit cost all require SUMX because they depend on per-row multiplication before aggregation
- CALCULATE changes filter context; SUMX changes row context - they solve different problems and are frequently combined in FP&A measures
- In multi-entity models, SUMX respects active model relationships automatically - explicit FILTER inside SUMX is usually a performance anti-pattern
- Miscoding ratio measures without DIVIDE causes divide-by-zero errors that surface as financial statement defects
What Is SUMX and Why Do Finance Teams Need It in Power BI?
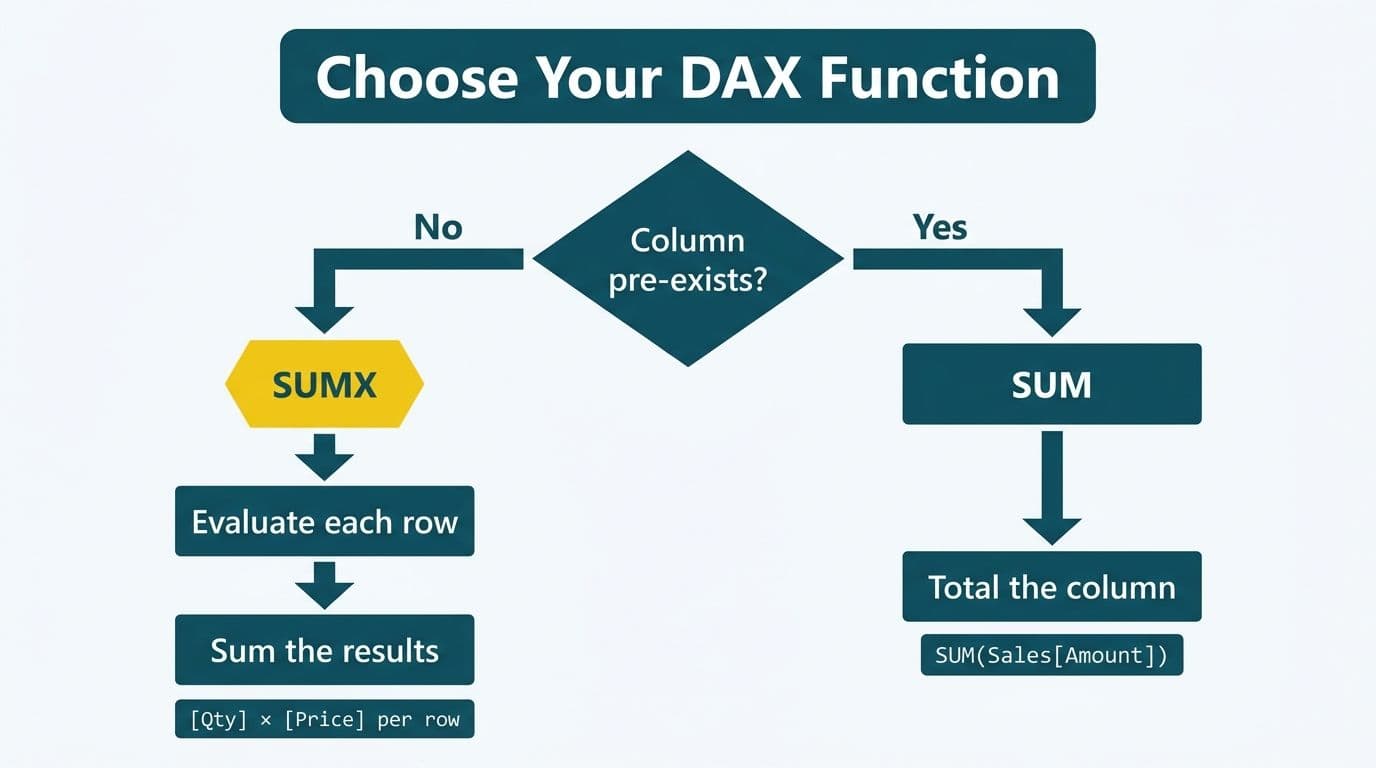
SUMX is a DAX iterator function - it takes a table and an expression, evaluates that expression for each row in the table, and sums the results. This differs fundamentally from SUM, which totals an existing numeric column without row-level evaluation.
For finance teams building FP&A models, the distinction matters every time a metric requires a per-row calculation before aggregation. Revenue is the canonical example: if a fact table stores unit price and quantity in separate columns, SUM([Revenue]) works only if a revenue column already exists. When it does not, SUMX(Sales, Sales[UnitPrice] * Sales[Quantity]) computes revenue at the order-line level and aggregates correctly regardless of which filters are active.
The Power BI for SaaS finance teams service page covers the broader architecture of FP&A-grade models in Power BI, including how DAX iterator functions fit into a governed measure library.
In legacy DAX patterns, the EARLIER function handled nested row context inside calculated columns. SUMX replaces most of those patterns in modern Power BI measures - it is more readable and avoids the scope confusion that made EARLIER error-prone in complex models. According to Microsoft's DAX function reference (2025), SUMX belongs to a family of X-suffix iterators - AVERAGEX, COUNTX, MAXX, MINX - that all follow the same evaluate-per-row-then-aggregate pattern.
SUMX vs SUM vs CALCULATE: Which Should You Use?
These three functions solve different problems and are often confused because they produce identical results in simple scenarios. The decision rule: use SUM for a pre-existing column, SUMX for a row-by-row expression, and CALCULATE to modify which rows are in scope.
| Scenario | Best Function | Reason |
|---|---|---|
| Total a single pre-calculated column | SUM | No row iteration needed; fastest path |
| Multiply price x quantity and sum | SUMX | Must evaluate per row before summing |
| Revenue filtered to a single fiscal year | CALCULATE + SUM | Changes filter context without iteration |
| Gross margin across a rolling period | CALCULATE + SUMX | Both filter and row context required |
| Weighted-average unit cost by entity | SUMX + SUMMARIZE | Iterates a pre-summarized virtual table |
| Revenue by entity via a model relationship | SUMX | Iterator respects active relationships |
SUM is the most performant option when a numeric column already exists. If a data warehouse pre-calculates line-item revenue, SUM([LineRevenue]) is preferable to SUMX(Sales, Sales[UnitPrice] * Sales[Quantity]).
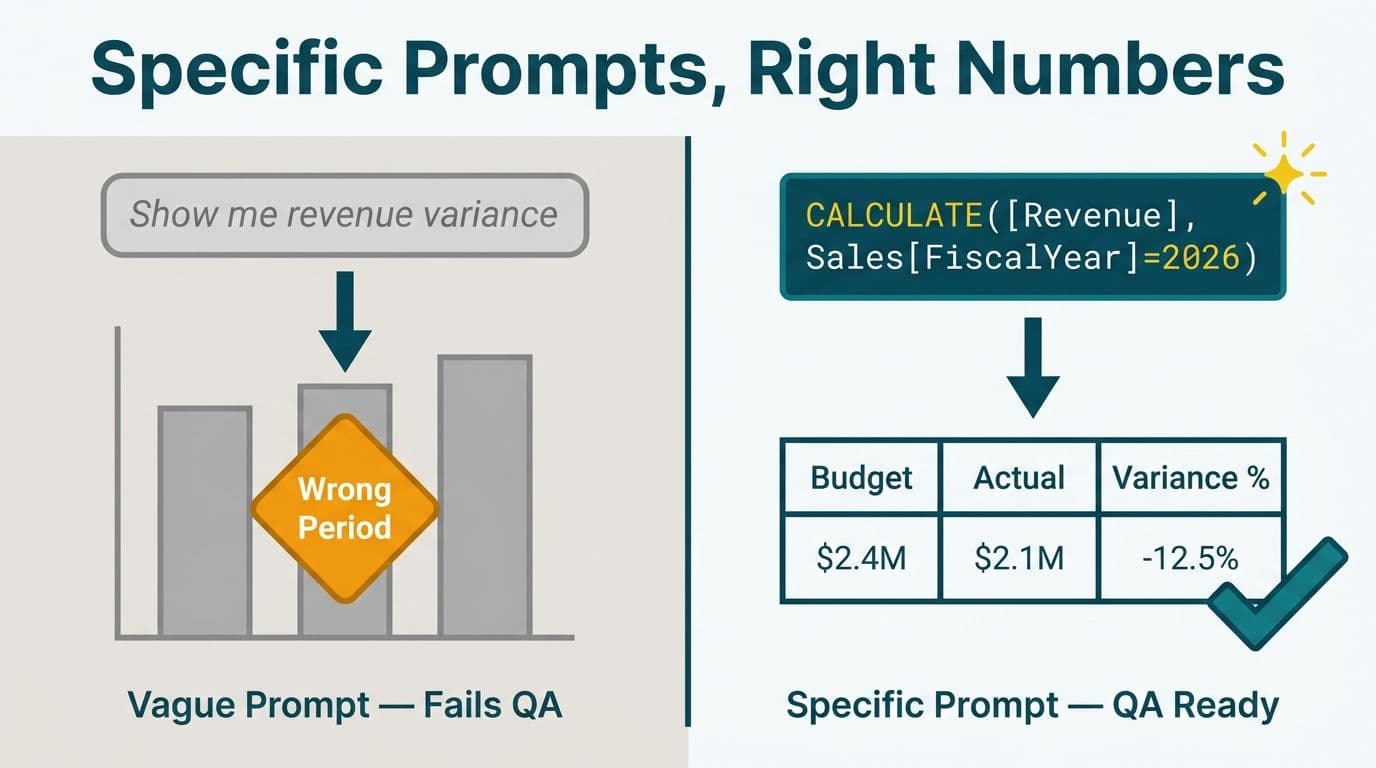
CALCULATE modifies the filter context around a measure expression. CALCULATE([Total Revenue], 'Date'[Year] = 2026) restricts the aggregation to 2026 without iterating rows. CALCULATE does not itself iterate - it delegates aggregation to whatever expression it wraps.
SUMX is required when the expression to aggregate does not exist as a column, or when per-row evaluation order matters - as in weighted-average unit cost calculations.
A common error is replacing SUMX with a calculated column and then SUM-ing that column. Calculated columns are computed at model refresh under no filter context, so they cannot respond to slicer selections on entity, product, or period - producing wrong subtotals on any filtered financial statement.
How Do You Calculate Revenue Aggregation with SUMX in Power BI?
Revenue aggregation is the most direct SUMX Power BI finance aggregation pattern. For a transactional sales model:
```dax
Total Revenue =
SUMX(
Sales,
Sales[UnitPrice] * Sales[Quantity]
)
```
For a SaaS finance model, the fact table is typically a subscription table with a monthly rate and active seat count:
```dax
MRR =
SUMX(
Subscriptions,
Subscriptions[MonthlyRatePerSeat] * Subscriptions[ActiveSeats]
)
```
This computes MRR at the subscription level and rolls up correctly whether the visual filters by customer segment, geography, or product tier.
A US SaaS finance team managing multi-currency bookings - USD, GBP, and CAD - would extend the pattern with a currency conversion step:
```dax
MRR USD =
SUMX(
Subscriptions,
Subscriptions[MonthlyRatePerSeat]
- Subscriptions[ActiveSeats]
- RELATED(ExchangeRates[RateToUSD])
)
```
RELATED traverses the relationship between the Subscriptions fact table and an ExchangeRates dimension, a pattern that scales cleanly across entities without duplicating conversion logic.
For UK fintech firms reporting under IFRS 15 - where performance obligations can span multiple invoices - SUMX over a deferred revenue schedule table produces period-correct revenue recognition figures without manual adjustments to the dataset. Canadian SaaS companies filing under ASPE can apply the same pattern: the DAX aggregation logic is identical; only the underlying schedule table reflects the applicable accounting standard.
How Do You Calculate Gross Margin with SUMX?
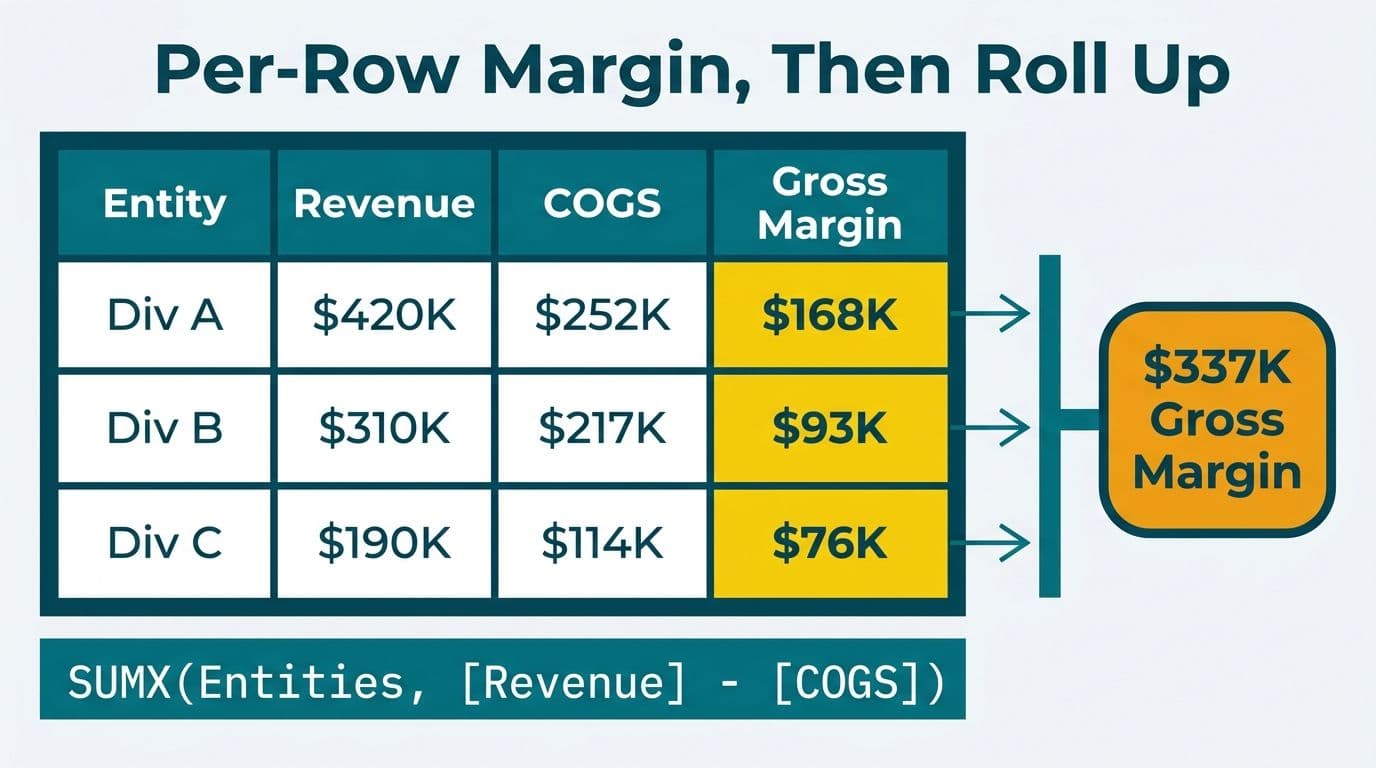
Gross margin requires two SUMX base measures - one for revenue, one for cost of goods sold (COGS) - before dividing. Defining named base measures first is the recommended practice:
```dax
[Total Revenue] =
SUMX(Sales, Sales[UnitPrice] * Sales[Quantity])
[Total COGS] =
SUMX(Sales, Sales[UnitCost] * Sales[Quantity])
[Gross Margin %] =
DIVIDE([Total Revenue] - [Total COGS], [Total Revenue])
```
Composing measures this way - rather than nesting SUMX calls inside a single expression - improves readability and makes the model auditable. Finance teams subject to SOC 2 reviews or GDPR data governance requirements benefit directly: a clean, named measure layer lets auditors trace each KPI to its source formula without decoding deeply nested DAX.
A Canadian manufacturing company applying weighted standard costs can extend this pattern:
```dax
[Gross Margin - Std Cost] =
DIVIDE(
[Total Revenue] - [Total Standard COGS] - [Cost Variance],
[Total Revenue]
)
```
where [Cost Variance] is itself a SUMX measure over a variance detail table. Keeping variance as a separate named measure makes it visible in the model's measure layer - a practice aligned with the governance standards in the Power BI governance best practices checklist.
How Do You Calculate Weighted-Average Unit Cost with SUMX?
Weighted-average unit cost is a scenario where SUMX is the only correct choice. AVERAGEX(Inventory, Inventory[UnitCost]) gives the simple average of unit costs - equal to the weighted average only when all quantities are identical. For any real inventory or COGS model, that assumption fails.
```dax
Weighted Avg Unit Cost =
DIVIDE(
SUMX(Inventory, Inventory[UnitCost] * Inventory[Quantity]),
SUM(Inventory[Quantity])
)
```
For a European enterprise distributing goods across multiple legal entities with different per-unit landed costs, the consolidated weighted average must be computed at the entity-SKU level before rolling up:
```dax
Consolidated WAUC =
DIVIDE(
SUMX(
SUMMARIZE(Inventory, Inventory[EntityID], Inventory[SKU]),
[Total Cost by Entity SKU]
),
[Total Quantity All Entities]
)
```
SUMMARIZE creates a virtual table of unique entity-SKU combinations. SUMX then iterates over that reduced set rather than millions of individual inventory rows - which matters significantly for query performance at enterprise scale. Microsoft's DAX best practices documentation (2025) recommends minimizing the granularity of the iterator table precisely for this reason.
For FP&A teams working in a Fabric lakehouse finance analytics architecture, this SUMMARIZE + SUMX pattern operates identically in DirectLake mode - the query folds efficiently to the underlying Delta table without pulling row-level data into memory.
SUMX in Multi-Entity Finance Models: Best Practices
Multi-entity models - holding companies, roll-ups, and franchise networks - introduce two SUMX-specific challenges: relationship traversal and intercompany elimination.
Relationship traversal: SUMX evaluates its expression in the current filter context. When an Entity dimension is related to a Transactions fact table, a slicer on Entity automatically narrows the iteration to the correct rows. No explicit FILTER inside SUMX is needed. Adding one is a common performance anti-pattern:
```dax
// Anti-pattern: explicit FILTER degrades query performance
Revenue Slow =
SUMX(
FILTER(Sales, Sales[EntityID] = MAX(Entity[EntityID])),
Sales[UnitPrice] * Sales[Quantity]
)
// Correct: the model relationship handles row scoping
Total Revenue =
SUMX(Sales, Sales[UnitPrice] * Sales[Quantity])
```
Intercompany elimination: eliminating intercompany transactions requires SUMX over a filtered elimination table, subtracted from consolidated revenue as a separate named measure. Structuring it this way keeps the elimination logic independently auditable and testable - critical for holding companies subject to consolidated group reporting requirements.
Row-level security (RLS) integrates cleanly with SUMX: the row iteration only touches rows visible to the current user. A UK financial group under GDPR obligations should implement entity-level data access at the RLS layer - not inside measure expressions. SUMX naturally respects those RLS boundaries without additional filter guards in the DAX.
When Should You Use SUMX vs CALCULATE in Complex FP&A Measures?
The decision rule: use CALCULATE when you need to change which rows are in scope; use SUMX when you need to compute something row by row within those rows. They are frequently combined in production FP&A models.
```dax
Prior Year Revenue =
CALCULATE(
[Total Revenue],
SAMEPERIODLASTYEAR('Date'[Date])
)
```
CALCULATE shifts the filter context to the prior year. [Total Revenue] - a SUMX measure - then iterates over that shifted set.
A rolling 12-month gross margin measure - a standard FP&A KPI - combines both functions:
```dax
R12M Gross Margin % =
VAR R12Revenue =
CALCULATE(
[Total Revenue],
DATESINPERIOD('Date'[Date], LASTDATE('Date'[Date]), -12, MONTH)
)
VAR R12COGS =
CALCULATE(
[Total COGS],
DATESINPERIOD('Date'[Date], LASTDATE('Date'[Date]), -12, MONTH)
)
RETURN
DIVIDE(R12Revenue - R12COGS, R12Revenue)
```
VAR/RETURN blocks evaluate each sub-expression once and store the result - preventing repeated formula evaluation and making the logic readable, analogous to named ranges in a financial model spreadsheet. Finance teams at US enterprise companies running SOC 2 audits find VAR-structured measures significantly easier to document and review than deeply nested DAX.
For CFOs and finance directors evaluating whether to build this measure library in-house or with a specialist team, the outsourcing finance analytics guide for CFOs frames that decision in practical terms.
Common SUMX Mistakes in Financial Reporting and How to Avoid Them
Three errors appear consistently in finance model reviews.
1. SUMX on a pre-calculated column. SUMX(Sales, Sales[LineRevenue]) and SUM(Sales[LineRevenue]) produce the same output, but SUMX forces unnecessary row-level iteration. When a column already stores the computed value, SUM is the correct and faster choice.
2. Referencing measures inside SUMX. SUMX establishes row context. If you reference a measure - rather than a column - inside the SUMX expression, that measure evaluates in filter context instead, producing subtotals that do not reconcile correctly. Use column references inside SUMX; compose measures outside it using VAR blocks.
3. Division without DIVIDE. Writing [Revenue] / [COGS] instead of DIVIDE([Revenue], [COGS]) throws an error when COGS is zero for a new product or a period with no activity. In financial statements, blank and zero carry different meanings - DIVIDE handles both correctly. The same principle applies in accounts receivable aging dashboards when computing DSO metrics: a zero-revenue period should surface BLANK(), not an error value.
For iterator function comparisons beyond SUMX, the COUNTX in Power BI DAX guide covers the same row-by-row logic applied to distinct counts - useful when FP&A models need active-customer or headcount metrics alongside revenue aggregations.
---
About Lets Viz: Lets Viz has built Power BI finance models for US SaaS companies, UK fintech firms, Canadian manufacturers, and global enterprise FP&A teams since 2020, earning a 5.0 rating on Clutch. Our DAX measure libraries are designed to withstand SOC 2, GDPR, and PIPEDA audit scrutiny, and we specialize in governed, multi-entity finance models built to scale without rework.
Ready to move your FP&A team from spreadsheet roll-ups to a production-grade Power BI measure library? Power BI for SaaS finance teams explains how we scope and deliver that work.