Accounts Receivable Aging Dashboard in Power BI: Build Guide
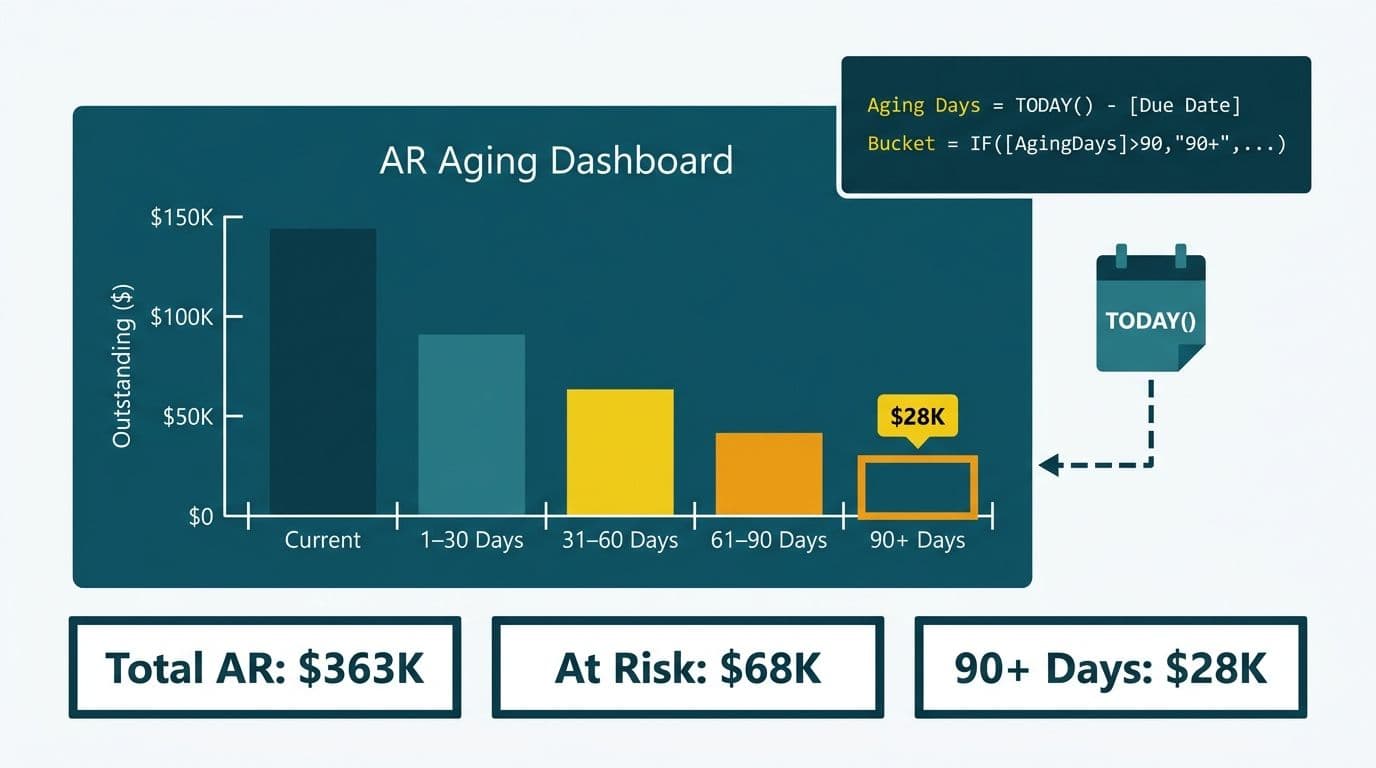
An accounts receivable aging dashboard in Power BI segments outstanding invoices into standardized time buckets - Current, 1-30, 31-60, 61-90, and 90+ days overdue - and surfaces collection risk to finance leadership in real time. With a properly structured data model and DAX measures that calculate aging dynamically against today's date, a CFO sees which customer balances are deteriorating, which payment terms are being violated, and where cash recovery efforts should concentrate.
Key Takeaways
AR aging buckets are driven by a DAX column comparing invoice due date to TODAY(), not a static snapshot embedded at refresh time
Dynamic overdue flags use conditional formatting measures that update on every report open without requiring manual intervention
Payment norms vary significantly: Net 30 is standard in the US and Canada, while UK and EU B2B contracts commonly run Net 30-60 under the Late Payment of Commercial Debts Act 1998
CFO-ready cash views require DSO trend, rolling collection rate, and a top-10 at-risk account table on a dedicated report page
Row-level security restricts regional AR data for GDPR, PIPEDA, and SOC 2 compliance without duplicating the report file
What Is an Accounts Receivable Aging Dashboard in Power BI?
An AR aging dashboard is a finance-facing report that answers one core question: of the money owed to the business, how old is each balance and what is the collection risk? Power BI is well suited to this because its in-memory engine recalculates aging dynamically each time the report opens, so the CFO always sees current-day exposure rather than a stale spreadsheet export.
The dashboard typically operates on two layers. The first is the aging summary - a matrix or stacked bar chart breaking total receivables by bucket across customers, regions, or business units. The second is the collection detail - a drillthrough page showing individual invoice lines, contact names, and days outstanding for any segment the CFO selects. Together, these layers serve both the board-level summary view and the collections team's daily working list.
Finance teams building this report for SaaS or enterprise organizations often connect the AR dashboard to a broader financial reporting stack. The Power BI for SaaS finance teams service covers the full data model architecture for subscription billing, invoicing, and revenue recognition that underpins these AR views - including how to model partial payments and credit notes without inflating the overdue balance.
How Do You Build an Accounts Receivable Aging Dashboard in Power BI?
Aging buckets are calculated, not stored. The most common mistake finance teams make is importing a pre-bucketed field from an ERP export. That produces a frozen snapshot that ages between data refreshes. The correct approach calculates the bucket inside Power BI using a DAX column tied to TODAY().
Step 1: Data Model Requirements
Your invoice fact table needs at minimum four columns:
`InvoiceID` - unique invoice identifier
`CustomerID` - foreign key to a Customer dimension table
`DueDate` - the contractual payment due date (not invoice issue date)
`OutstandingAmount` - balance remaining after partial payments; credit notes must be applied before this field reaches Power BI, not inside DAX. A negative OutstandingAmount from an unapplied credit note will understate overdue totals and misclassify the aging bucket for that invoice line.
Separate `DueDate` from `InvoiceDate`. AR aging is always measured from the due date, not from when the invoice was raised. Confusing these two dates produces flattering but incorrect aging reports.
Step 2: Days Overdue Calculated Column
```dax
Days Overdue =
IF(
Invoices[OutstandingAmount] > 0,
DATEDIFF(Invoices[DueDate], TODAY(), DAY),
0
)
```
This returns a positive number for past-due invoices and zero for settled or not-yet-due invoices. Using DATEDIFF against TODAY() means the column recalculates on each dataset refresh, keeping aging current without manual updates.
Step 3: Aging Bucket Calculated Column
```dax
Aging Bucket =
SWITCH(
TRUE(),
Invoices[Days Overdue] <= 0, "Current",
Invoices[Days Overdue] <= 30, "1-30 Days",
Invoices[Days Overdue] <= 60, "31-60 Days",
Invoices[Days Overdue] <= 90, "61-90 Days",
"90+ Days"
)
```
Always pair this with a `Bucket Sort` column containing the integers 0, 1, 2, 3, 4, and sort `Aging Bucket` by that column. Without this step, Power BI alphabetizes the buckets, placing "31-60 Days" before "90+ Days" and breaking any visual that depends on chronological ordering.
Step 4: Core AR Measures
```dax
Total AR = SUM(Invoices[OutstandingAmount])
% Overdue =
DIVIDE(
CALCULATE([Total AR], Invoices[Days Overdue] > 0),
[Total AR]
)
```
Understanding when to use a column versus a measure matters here. The Power Query vs DAX for calculations in Power BI guide explains why Days Overdue is best as a calculated column while % Overdue must be a measure that responds to filter context. For a deeper look at how SUM and SUMX behave when your invoice table has multiple rows per customer, the SUMX vs SUM in Power BI article covers the row context distinction.
How Do You Write DAX for Dynamic Overdue Flags?
Dynamic overdue flags are measures - not columns - that respond to slicer selections and enable the report to highlight accounts crossing configurable risk thresholds. This distinction separates a static AR report from a live CFO monitoring tool.
Risk Classification Measure
```dax
Risk Flag =
VAR _overdue90 =
CALCULATE([Total AR], Invoices[Days Overdue] > 90)
VAR _totalAR = [Total AR]
RETURN
SWITCH(
TRUE(),
DIVIDE(_overdue90, _totalAR) > 0.3, "High Risk",
DIVIDE(_overdue90, _totalAR) > 0.1, "Medium Risk",
"Low Risk"
)
```
To apply this as a conditional format: select the 90+ Days value field in the matrix → Format pane → Conditional formatting → Background color → set Format style to Field value and the field to `[Risk Flag]`. Map "High Risk" to red (#FF4D4D) and "Medium Risk" to amber (#FFC000). Using Field value mode rather than Rules mode means the color updates automatically as the underlying data changes — no threshold rules to maintain. Accounts where more than 30% of their outstanding balance sits in the 90+ bucket are flagged red; 10-30% flags amber. This turns the aging matrix into an immediate action list without requiring the CFO to interpret every row manually.
Days Sales Outstanding Measure
DSO is the single most-watched AR metric in board-level finance reviews:
```dax
DSO =
DIVIDE(
[Total AR],
CALCULATE(
SUM(Invoices[InvoiceAmount]),
DATESINPERIOD(
Dates[Date],
LASTDATE(Dates[Date]),
-90,
DAY
)
)
) * 90
```
This rolling 90-day DSO divides current AR by revenue recognized over the last 90 days. Publish it as a card visual on the summary page alongside a 13-month trend sparkline so the CFO sees at a glance whether collection performance is improving or deteriorating.
What Should a CFO-Ready Cash Collection View Include?
The cash collection page is a dedicated report page designed for weekly CFO review and board pack exports. Its job is to surface the most critical numbers immediately, without requiring drill-down to interpret.
Top row - KPI cards:
Total AR outstanding
Percentage of AR that is Current
DSO with a trend arrow (month-over-month change)
90+ Days balance with month-over-month change in absolute currency
Middle row - trend charts:
Stacked bar: AR by aging bucket over 12 rolling months. This reveals whether the 90+ bucket is growing as a proportion of total receivables - the most actionable trend signal for a CFO.
Line chart: DSO trend over 13 months (one extra month enables a full prior-year comparison)
Bottom section - at-risk accounts table:
A sorted table showing the top 10 customers by 90+ Days balance. Recommended columns: Customer Name, Total Outstanding, 90+ Balance, Days Overdue (maximum), Primary Contact, and Last Payment Date. Conditional format the 90+ Balance column red above a defined threshold. The collections team can filter and export this table directly, making it a working instrument rather than a passive visual.
GDPR and Compliance Considerations
For UK and EU organizations, customer-level AR data is personal data under GDPR because it identifies individuals or identifiable legal entities. The at-risk accounts table must not be cached in Power BI Service's export history or shared via public embed links. Apply a Confidential sensitivity label at the dataset level and restrict export permissions to authorized finance roles.
A Canadian enterprise handling customer invoice data under PIPEDA faces similar obligations: data minimization means only personnel with a clear business need should access individual customer balances. The GDPR compliant SaaS financial reporting checklist covers the Power BI Service settings applicable to financial reporting in regulated environments across UK, EU, and Canadian markets.
How Do Payment Norms Differ Across US, UK, and Canada?
Payment terms vary significantly by geography, and the aging bucket thresholds in your dashboard should reflect where your customers are. A US SaaS company billing enterprise clients on Net 30 terms will carry a very different risk profile from a UK fintech firm whose B2B contracts run Net 60 under standard UK commercial practice.
| Region | Standard B2B Terms | Legal Framework | Late Payment Statutory Interest |
|---|---|---|---|
| United States | Net 30 (widely expected) | Varies by state; no federal private-contract statute | Contractual, typically 1.5% per month |
| United Kingdom | Net 30-60 | Late Payment of Commercial Debts Act 1998 | 8% above Bank of England base rate |
| European Union | Net 30 (public); Net 60 max (private) | EU Late Payment Directive (2011/7/EU) | 8% above ECB reference rate |
| Canada | Net 30 (common); Net 45-60 in manufacturing | Provincial contract law; no single federal statute | Contractual, often prime rate + 2% |
This table has a direct bearing on bucket configuration. A UK fintech firm operating on Net 60 terms should shift the "Current" bucket boundary to 60 days from due date and treat 1-30 days overdue as a soft warning band rather than an escalation trigger. The cleanest implementation is a Payment Terms parameter using a disconnected slicer on a Terms dimension table (with values such as 30, 45, 60) that feeds into the Days Overdue logic via a `SELECTEDVALUE` measure. Avoid a What-If Parameter for this use case: its default value resets for every user session in Power BI Service, so each user who opens the report sees the wrong bucket thresholds until they manually re-select their terms. The disconnected slicer approach preserves the last selection within a session and behaves consistently across all report viewers.
A Canadian manufacturing company billing in both CAD and USD, and subject to PIPEDA obligations for customer data handling, will also need a currency normalization measure before any cross-region AR total is meaningful. A weekly-refreshed exchange rate table in Power Query is the most common practical approach.
How Do You Secure an AR Aging Dashboard for Multi-Region Teams?
Row-level security (RLS) is the mechanism that makes one AR dashboard safe for a global finance organization. Without it, a regional collections manager in the UK can view North American customer balances, creating both a GDPR exposure and a data governance failure.
RLS Design for AR Aging
Create a `Security` lookup table with two columns: `UserEmail` and `Region`. Then write a DAX RLS role filter on the Customer dimension:
```dax
[Region] = LOOKUPVALUE(
Security[Region],
Security[UserEmail],
USERPRINCIPALNAME()
)
```
Assign this role to all regional finance users. CFOs and the Controller receive an unrestricted role with no row filter applied. Test every role using Power BI Desktop's "View as role" feature before publishing - do not rely on verbal confirmation from report users.
Compliance Mapping
US SaaS (SOC 2 Type II): RLS enforces logical access controls over customer financial data, directly supporting the access control common criteria in SOC 2.
UK and EU (GDPR): RLS restricts processing of customer personal data to users with a legitimate business purpose, satisfying the data minimization and need-to-know principles under Articles 5 and 25.
Canada (PIPEDA): RLS supports the Accountability and Limiting Access principles in PIPEDA Schedule 1, Clause 4.5.
For FP&A teams building a broader financial reporting suite alongside this AR view, the FP&A dashboard in Power BI step-by-step build guide covers the P&L and cash flow model that AR aging data typically feeds into.
Deployment Checklist Before Publishing
Before publishing the AR aging dashboard to Power BI Service, verify each of the following:
[ ] Aging Bucket column has a companion Bucket Sort column and is sorted by it
[ ] Days Overdue uses TODAY() not a hardcoded date field
[ ] DSO measure output matches your ERP's DSO figure for the same period
[ ] RLS roles tested with "View as role" for at least one regional user and one unrestricted admin
[ ] Sensitivity label applied at the dataset level (Confidential - Finance recommended)
[ ] Scheduled refresh set to daily minimum; intraday if your ERP or billing system supports live connections
[ ] At-risk accounts table limited to top 10 or 20 rows to keep page load responsive
---
About Lets Viz: Lets Viz has built financial dashboards and AR reporting models for finance teams across US healthcare, UK fintech, Canadian manufacturing, and global SaaS since 2020. With a 5.0 Clutch rating and Power BI specialization, the team designs AR aging models, FP&A suites, and compliance-ready reporting stacks that withstand SOC 2, GDPR, and PIPEDA scrutiny.
Ready to put a CFO-ready AR aging view in front of your finance team? Explore the Power BI for SaaS finance teams service page for delivery options and engagement models.