Fabric Lakehouse Finance Analytics: Power BI Reporting for FP&A
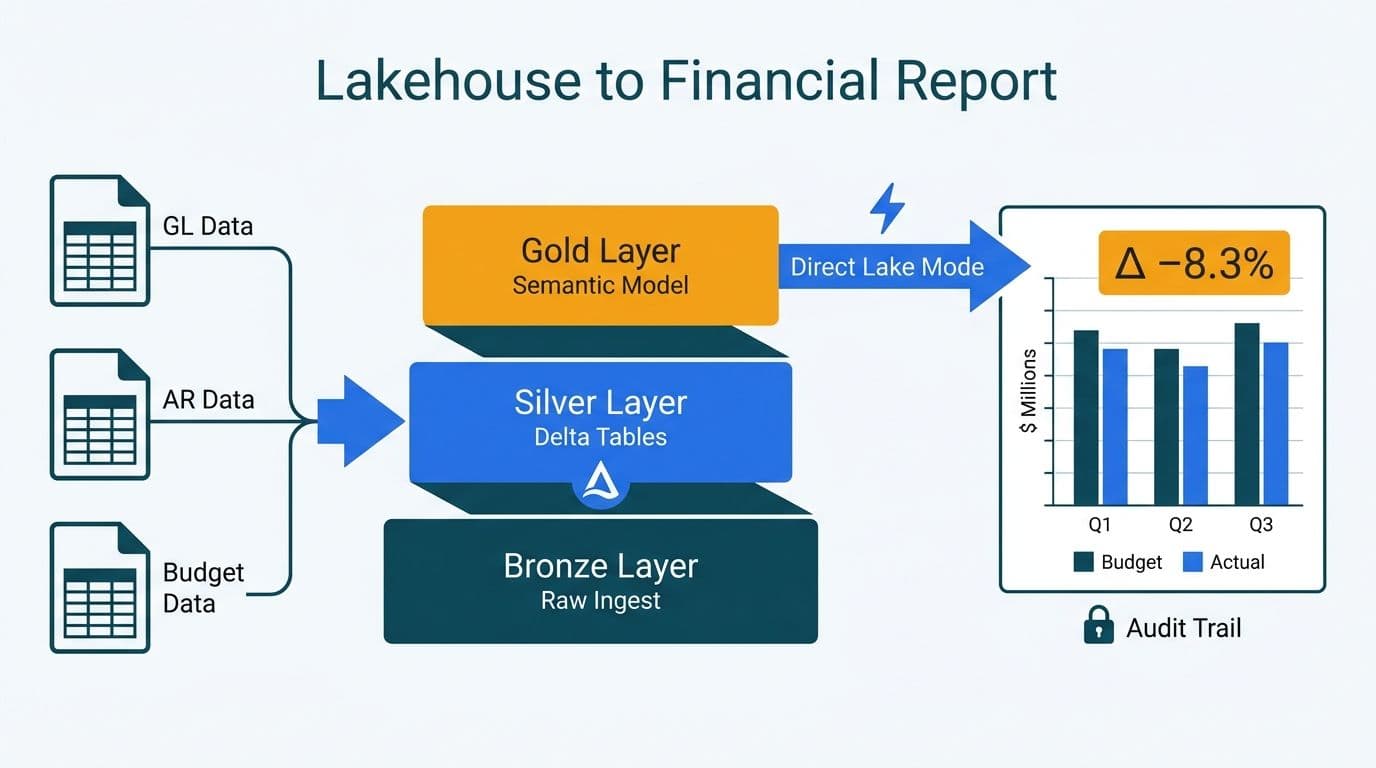
Microsoft Fabric Lakehouse gives FP&A teams a governed platform to land GL, AR, and budget data as open Delta tables, curate a Gold-layer semantic model in Direct Lake mode, and publish Power BI financial reports with a full audit trail from source row to visual. For organizations running monthly close cycles, variance analysis, or regulatory submissions, the medallion architecture replaces fragile spreadsheet handoffs with a version-controlled, auditable pipeline.
Key Takeaways
- Delta tables in the Silver layer store immutable, timestamped GL and AR records that support point-in-time financial reconstruction
- A Gold-layer Direct Lake semantic model serves Power BI without import delays while maintaining a single, auditor-visible version of financial truth
- Row-level security (RLS) and Microsoft Purview sensitivity labels enforce governance from lakehouse storage to report surface
- Fabric's Capacity Units (CUs) model makes compute spending predictable across finance planning cycles
- One Fabric workspace can satisfy HIPAA, GDPR, and PIPEDA obligations through sensitivity labels, private endpoints, and regional data residency settings
What Are the Microsoft Fabric Components and Workloads for Finance Analytics?
Microsoft Fabric is an end-to-end SaaS analytics platform that unifies data engineering, data warehousing, real-time analytics, and business intelligence under a single capacity license (Microsoft documentation, 2025). For finance teams, the relevant workloads are: Data Factory for ingesting ERP and GL exports; the Lakehouse for storing Delta tables in OneLake; Notebooks (PySpark or SQL) for transformation logic; the Semantic Model for the business-rule and metric layer; and Power BI for financial reporting and self-service dashboards.
If your organization is evaluating options for Power BI and Fabric consulting, the component map is the first conversation to have: which workloads you activate determines both your data governance posture and your monthly CU consumption.
The key architectural principle for finance is that OneLake is the single storage layer - every workload reads from the same Delta Parquet files, eliminating data copy proliferation between reporting and warehousing tools. The Fabric Lakehouse Architecture Diagram: Reference Design Guide covers the full medallion topology with ingestion, transformation, and serving layers mapped out.
Fabric Warehouse vs. Lakehouse for Finance: Quick Comparison
| Dimension | Fabric Lakehouse | Fabric Warehouse |
|---|---|---|
| Storage format | Open Delta Parquet (OneLake) | Managed columnar (OneLake) |
| Schema enforcement | Schema-on-read (Silver layer) | Schema-on-write at ingestion |
| Query language | PySpark, Spark SQL, T-SQL | T-SQL only |
| Direct Lake mode | Yes (native) | Yes (via shortcut) |
| Best fit for FP&A | ERP exports, GL journals, AR aging | Pre-aggregated P&L and balance-sheet marts |
| Audit trail mechanism | Delta transaction log | Warehouse audit events |
For most mid-market FP&A implementations, the Lakehouse is the right choice at the Bronze and Silver layers because finance data arrives from ERPs as CSV or Parquet dumps with varying schema versions across fiscal years. The Warehouse becomes the better destination for the Gold layer where finance analysts need strict DDL control and familiar T-SQL tooling.
How Do You Model GL, AR, and Budget Data in Delta Tables?
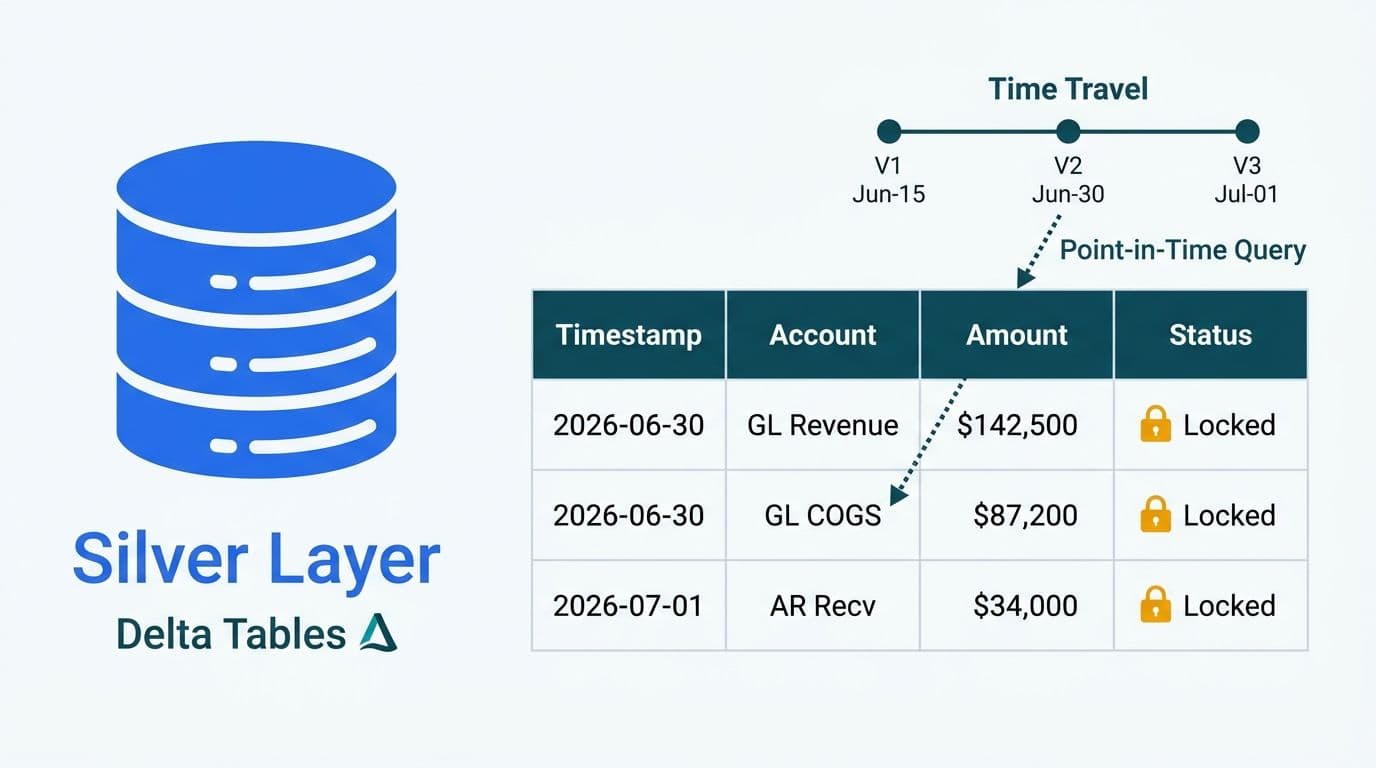
The medallion architecture maps naturally to the three ledger domains that drive FP&A reporting. Each domain lands first in Bronze (raw, unchanged from the source system), is cleansed and enriched in Silver (business keys, deduplication, timestamps, FX rates), and is aggregated in Gold (star-schema fact and dimension tables ready for Direct Lake consumption by the semantic model).
General Ledger - Silver Schema Design
A GL Silver table should carry at minimum: `journal_id`, `account_code`, `cost_centre`, `entity_id`, `fiscal_period`, `transaction_date`, `debit_amount`, `credit_amount`, `currency_code`, `fx_rate_to_usd`, `source_system`, and `ingestion_timestamp`. The Delta transaction log preserves every prior version of this table - auditors can reconstruct the exact GL balance at any point-in-time using a `VERSION AS OF` query without maintaining static month-end CSV snapshots on shared drives.
Accounts Receivable - Silver Schema Design
AR Silver tables should model at the invoice line level: `invoice_id`, `customer_id`, `invoice_date`, `due_date`, `invoice_amount`, `outstanding_amount`, `aging_bucket` (0-30, 31-60, 61-90, 90+), `dispute_flag`, `collector_id`, and `last_payment_date`. Computing aging buckets inside the Silver transformation notebook - rather than in Power BI DAX measures - keeps the aging logic in testable, version-controlled code rather than scattered across individual report files.
Budget and Forecast - Silver Schema Design
Budget tables need a `scenario` column (`Actual`, `Budget`, `Forecast`, `Reforecast`) and a `version` column (for example, `2026_Q1_v2`) so FP&A analysts can compare multiple forecast iterations without overwriting prior versions. Storing all scenarios in a single partitioned Delta table with a composite key on `(account_code, cost_centre, entity_id, fiscal_period, scenario, version)` gives the semantic model a single source for all variance permutations - budget versus actual, or current forecast versus prior forecast.
What Does a Gold-Layer Semantic Model Look Like for Fabric Lakehouse Finance Analytics Power BI Reporting?
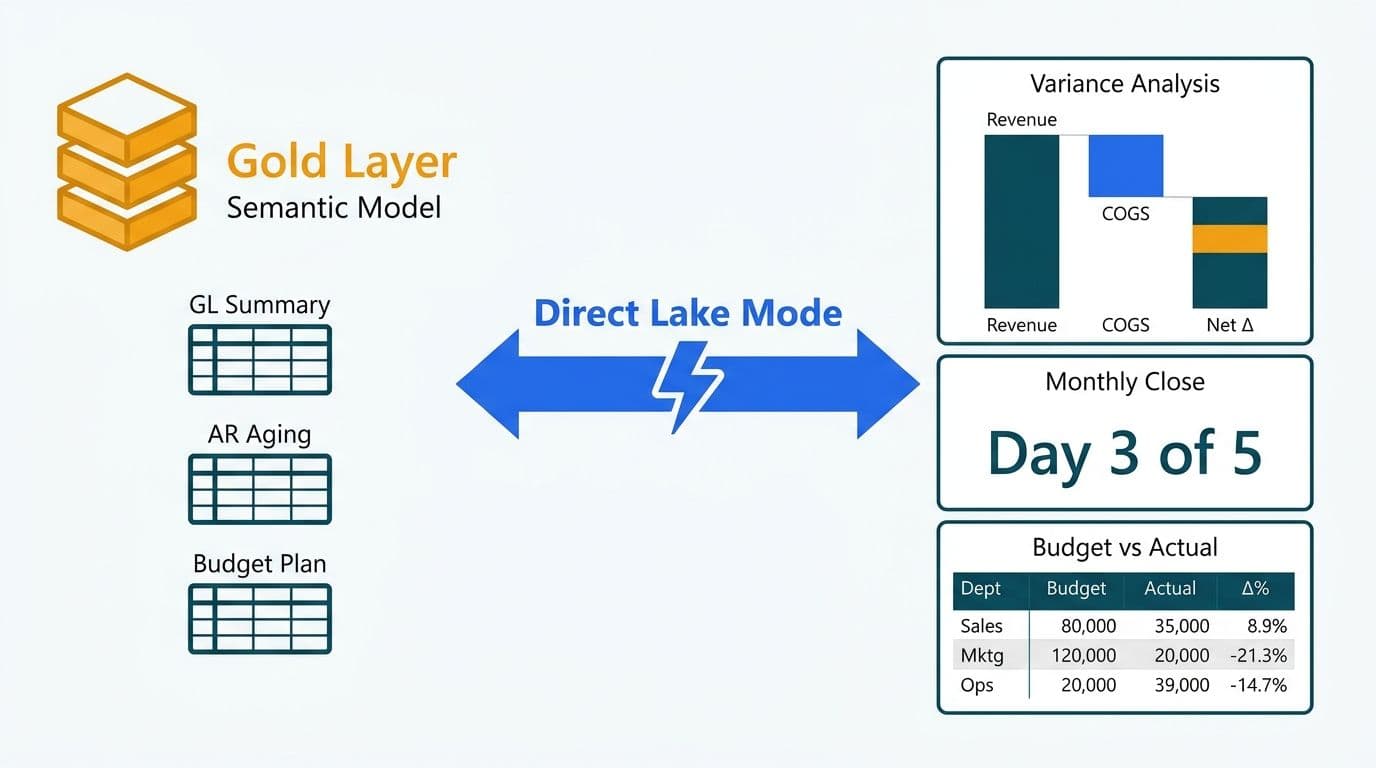
The Gold semantic model is where the medallion pipeline meets the Power BI report canvas. In Direct Lake mode (Microsoft Fabric documentation, 2025), the semantic model reads directly from Delta files in OneLake without importing data into an Analysis Services engine cache. For a finance team with multiple years of GL history, this means data is available in Power BI at near-query-time with no scheduled refresh window disrupting close-week reporting.
The recommended star schema for FP&A reporting:
- Fact_GLTransaction - one row per journal line; foreign keys to all dimensions
- Fact_ARInvoice - one row per invoice line; links to Dim_Customer and Dim_Calendar
- Fact_Budget - scenario and version columns support plan-type and iteration slicing
- Dim_Account - chart of accounts with P&L versus balance-sheet classification flag
- Dim_CostCentre - org hierarchy enabling roll-up from team to division to legal entity
- Dim_Calendar - fiscal periods, ISO weeks, quarter labels, year-to-date flags
- Dim_Entity - legal entity, country code, reporting currency, consolidation group
DAX measures for FP&A - `Revenue Variance %`, `Days Sales Outstanding`, `Budget Attainment %` - live in the semantic model, not in individual report files. This creates a single governed definition shared across every Power BI report, Excel workbook, and API query that connects to the model. Understanding when to push logic upstream into Silver notebooks versus keep it in DAX is covered in the Power Query vs DAX for Calculations in Power BI guide.
How Do You Build Auditable Power BI Financial Reports on Fabric?
Auditability in FP&A reporting means three demonstrable properties: every report number traces to a source row, access is logged and role-restricted, and the report state at any period close can be reproduced on demand. Fabric delivers all three through Delta versioning, RLS, and Microsoft Purview integration.
Row-Level Security for Finance Roles
RLS rules defined on the semantic model restrict which entities, cost centres, or legal entities a user sees. A cost-centre manager sees only their department's GL lines; a CFO sees consolidated P&L across all entities. Because RLS is enforced at the semantic model layer - not in individual report files - the same access boundary applies automatically to every Power BI report, Excel PivotTable, and API connection consuming that model.
Sensitivity Labels and Audit Logging
Microsoft Purview sensitivity labels applied at the lakehouse and semantic-model level flow downstream to every Excel and PDF export - a file labelled "Highly Confidential - Finance" retains that classification after it leaves the Fabric tenant (Microsoft Purview documentation, 2025). For US healthcare finance teams subject to SOC 2 audit requirements, this label-based audit trail provides the access-log evidence that external auditors request during control testing.
Filtering and Exporting Finance Data at Scale
Knowing how to filter data in Microsoft Fabric at the right layer prevents a common governance mistake. At the Silver notebook stage, use Delta `MERGE` statements to reject duplicate journal IDs before data reaches the Gold model. At the semantic model stage, use object-level security to hide raw debit and credit amount columns from non-finance roles. At the report stage, use field parameters and dynamic RLS to let analysts self-serve within their permitted entity scope.
On data volume: Power BI visual table exports are capped at 30,000 rows as CSV - insufficient for a full billing ledger reconciliation. One book distributor that could not extract their full billing history from Power BI reports solved the problem by connecting directly to the semantic model's XMLA endpoint, which streamed all 5,042,721 billing rows at roughly a million rows a minute. Fabric's SQL analytics endpoint on the underlying Delta table provides the same full-volume extraction path for finance teams that need complete GL extracts for external audit packages.
How Does Fabric Handle HIPAA, GDPR, and PIPEDA Compliance for Finance Data?
Finance data in healthcare and regulated industries crosses multiple compliance frameworks simultaneously. A correctly configured Fabric workspace can address all three through data residency controls, encryption at rest and in transit, and access governance - without requiring separate analytics platforms per geography.
US organizations (SOC 2, HIPAA for healthcare finance): Place the Fabric capacity in an East US or West US Azure region and enable private endpoints on OneLake to eliminate public internet routing. For US healthcare finance teams where patient billing data qualifies as PHI-adjacent, Microsoft's Business Associate Agreement under the Products and Services DPA (Microsoft, 2025) covers Fabric workloads. The AI Compliance Requirements for Financial Services: 2026 Regulatory Map maps the full US regulatory overlay for finance analytics teams.
UK and EU organizations (GDPR): Fabric tenants can be pinned to the EU Data Boundary, keeping data at rest and in processing within EU geography (Microsoft EU Data Boundary documentation, 2025). For a UK fintech firm running close-cycle FP&A on Fabric post-Brexit, this means routing data through UK South and West Europe capacity zones for separate data residency. The GDPR Compliant SaaS Financial Reporting: The BI Checklist maps the specific BI controls required under Articles 25 and 32.
Canadian organizations (PIPEDA): Microsoft Azure Canada Central and Canada East regions satisfy PIPEDA's requirement that personal financial data remain subject to comparable privacy protections. A Canadian manufacturing finance team storing accounts-payable vendor data - which may include personal tax identifiers under CRA reporting obligations - can route all Delta table writes through the Canada Central Fabric region and apply sensitivity labels that block cross-border movement at the file level.
What Does Microsoft Fabric Licensing Cost (Capacity Units) for a Finance Team?
Microsoft Fabric uses a Capacity Units (CUs) model where all workloads - Spark notebooks, data pipelines, Power BI Premium reports - draw from a shared CU pool rather than being licensed separately (Microsoft Fabric licensing documentation, 2025). Finance teams can pause capacity outside business hours and pay only for active processing time, making compute costs predictable enough to include in the FP&A team's own technology budget line.
| SKU | CUs | Approx. Monthly Cost (USD) | Best Fit |
|---|---|---|---|
| F2 | 2 | ~$263 | Proof of concept, small team |
| F4 | 4 | ~$526 | Small FP&A team (up to 15 users) |
| F8 | 8 | ~$1,052 | Mid-market finance (15-50 users) |
| F16 | 16 | ~$2,105 | Multi-entity, multi-currency GL |
| F32 | 32 | ~$4,210 | Enterprise finance with heavy Spark |
| F64 | 64 | ~$8,421 | Large FP&A with real-time data streams |
*Source: Microsoft Fabric pricing page, 2025 (USD list price; actual cost varies by region and enterprise agreement discount).*
Monthly close weeks can be temporarily scaled to the next SKU tier and scaled back after, smoothing the cost spike that high-volume Spark transformation jobs create during period-end processing.
Finance data engineers preparing to own a Fabric environment long-term should note that the DP-700 Microsoft Fabric Analytics Engineer certification (Microsoft, 2025) covers the full stack - from Delta table schema design through semantic model governance to Power BI report security - making it the natural qualification for staff taking ownership of a finance lakehouse post-go-live. For organizations migrating from Azure Synapse Analytics, the medallion approach described here can run in parallel with existing Synapse pipelines during a transition window, allowing GL balance validation across both platforms before final cutover.
---
About Lets Viz: Lets Viz has designed and delivered Power BI and Microsoft Fabric implementations for US healthcare systems, UK fintech firms, and Canadian manufacturing companies since 2020, earning a 5.0 rating on Clutch. Our certified analytics engineers combine FP&A domain knowledge with Fabric platform expertise to build financial reporting environments - from Delta table schemas to Gold-layer semantic models - that stand up under external audit and regulatory review across North American and European markets.
Whether you are designing a net-new Fabric finance lakehouse or rearchitecting an existing Power BI estate for auditability and scale, our Power BI and Fabric consulting team can scope the right medallion design, semantic model, and RLS framework for your organization.