COUNTX in Power BI: DAX Guide vs COUNT and DISTINCTCOUNT
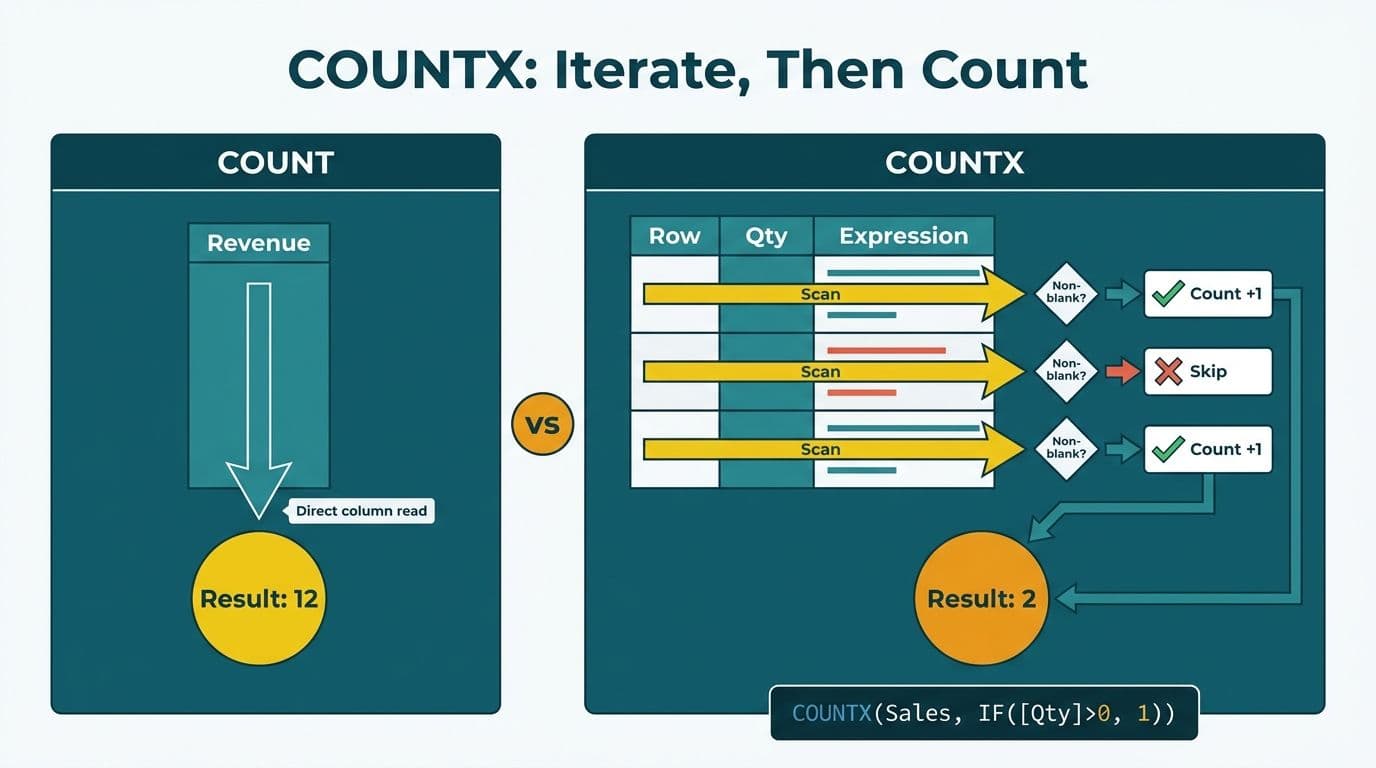
COUNTX is a DAX iterator that evaluates an expression row by row across a table and counts the rows where that expression returns a non-blank result. Unlike COUNT or COUNTA, which aggregate a single column directly, COUNTX lets you embed conditional logic - an IF statement, a date calculation, or a lookup - inside the count itself. That makes it the only native DAX count function suited for conditional or computed counting.
Key Takeaways
COUNTX iterates row by row and counts non-blank expression results; COUNT and COUNTA read a column directly without row-level logic.
Use DISTINCTCOUNT when you need unique values; use COUNTX when the counting condition requires a calculation or multi-column logic.
Returning `0` instead of `BLANK()` inside COUNTX inflates the count silently - every 0 is non-blank and gets counted.
CALCULATE + COUNTROWS is often faster than COUNTX for simple filter conditions; COUNTX wins when the condition is a computed expression or virtual table iteration.
Row context is the mechanism that makes COUNTX work - it evaluates each row independently before aggregating.
What Is COUNTX in Power BI and How Does It Work?
COUNTX belongs to the family of DAX iterator functions - also called X-functions - that traverse a table one row at a time. The function signature is:
```
COUNTX(<table>, <expression>)
```
For each row in the table, DAX evaluates the expression in that row's context. If the result is non-blank, the row is counted. If the result is blank, it is skipped. The final return value is the total count of non-blank rows across the full iteration.
A foundational example using a Sales table:
```
Orders With Discount =
COUNTX(
Sales,
IF(Sales[Discount] > 0, Sales[OrderID], BLANK())
)
```
This measure counts only the rows where a discount was applied. The same result is achievable with CALCULATE + COUNTROWS, but COUNTX is preferable when the logic involves multiple columns or a computed value rather than a static filter - the condition lives self-contained inside the expression.
For organizations running complex enterprise data models, Managed Power BI services include DAX layer design and measure governance - ensuring COUNTX and other iterators are implemented consistently and at the right grain for each report requirement.
Per Microsoft's official DAX reference documentation, COUNTX evaluates the expression in a row context established over the specified table, making it safe to reference any column in that table directly inside the expression without RELATED or CALCULATE wrapping.
COUNTX vs COUNT, COUNTA, and DISTINCTCOUNT: Which Function Should You Use?
These four functions share a common purpose - counting - but they answer different questions. Selecting the wrong one produces silent miscounts that survive QA reviews and mislead board-level dashboards.
| Function | What It Counts | Handles Text Columns? | Counts Distinct Values? | Accepts Expression Logic? |
|---|---|---|---|---|
| **COUNT** | Numeric non-blank values in a column | No (returns 0) | No | No |
| **COUNTA** | Any non-blank value in a column | Yes | No | No |
| **DISTINCTCOUNT** | Unique non-blank values in a column | Yes | Yes | No |
| **COUNTX** | Non-blank results of any expression, row by row | Yes (via expression) | No | Yes |
COUNT is the most restricted: it only counts numeric data types. Pass it a text column of order status codes and it returns zero with no error - a silent failure that is easy to miss in a model with mixed column types. Analysts migrating from Cognos encounter this frequently; the Cognos to Power BI DAX translation guide covers the COUNT-to-COUNTA mapping as a standard migration step.
COUNTA is the safe general-purpose replacement for COUNT. It counts any non-blank value regardless of data type, so it handles numeric columns, text columns, date columns, and boolean columns equally.
DISTINCTCOUNT answers "how many unique X are there?" - for example, how many distinct patients visited a facility, how many unique account numbers appear in a ledger, or how many different product SKUs were sold in a period. It does not accept a filter expression; if you need to count distinct values matching a condition, wrap it: CALCULATE(DISTINCTCOUNT(column), filter).
COUNTX is the only function in the group that accepts an expression containing conditional logic, date arithmetic, or cross-column comparisons. Use it when the counting condition cannot be expressed as a simple filter argument.
How Do You Use COUNTX in Sales Row-Context Examples?
Sales datasets are the most practical training ground for COUNTX because sales data is inherently conditional: deal size thresholds, territory filters, discount tiers, and win/loss status all require expression logic before a count makes business sense.
Count orders above a revenue threshold
A US SaaS finance team tracking enterprise deals for a quarterly pipeline review needs to count orders above $50,000:
```
Enterprise Orders =
COUNTX(
Orders,
IF(Orders[DealValue] >= 50000, 1, BLANK())
)
```
CALCULATE(COUNTROWS(Orders), Orders[DealValue] >= 50000) produces the same result and may execute faster on large tables because it pushes the filter to the storage engine. The COUNTX version is preferable when this threshold condition is embedded inside a larger measure chain.
Count multi-product orders
A UK fintech firm's sales analytics team needs to count orders that include more than one product line - a computed condition requiring a sub-aggregation per order:
```
Multi-Product Orders =
COUNTX(
ADDCOLUMNS(
VALUES(OrderLines[OrderID]),
"LineCount", CALCULATE(COUNTROWS(OrderLines))
),
IF([LineCount] > 1, 1, BLANK())
)
```
Here COUNTX iterates over a virtual table created by ADDCOLUMNS - a pattern where COUNTX has no single-step alternative. The virtual table computes a line count per order, and COUNTX then filters to orders with more than one line. This approach mirrors the SUMX iterator pattern described in the SUMX vs SUM in Power BI article - the X-function mental model is consistent across all aggregation types.
How Do You Apply COUNTX to Finance and Healthcare Data?
Finance and healthcare datasets require precision counts with compliance-grade accuracy. Both domains also impose data governance constraints - PIPEDA in Canada, GDPR for UK and EU operations, and HIPAA for US healthcare - that make aggregation design a compliance concern alongside calculation correctness.
Finance: Count overdue invoices by aging bucket
A Canadian manufacturing company's finance team needs to count invoices overdue by more than 30 days for a weekly cash-flow report. Under PIPEDA, the Power BI model surfaces only the count and amount by bucket - no individual debtor names at the row level:
```
Invoices Overdue 30+ Days =
COUNTX(
AR_Invoices,
IF(
DATEDIFF(AR_Invoices[DueDate], TODAY(), DAY) > 30
&& AR_Invoices[Status] = "Open",
1,
BLANK()
)
)
```
This measure is reusable across aging buckets by changing the threshold. The dual-condition AND (&&) makes COUNTX more readable than CALCULATE here, because CALCULATE does not accept a multi-column boolean expression without wrapping it in FILTER().
For finance directors building the full aging waterfall in Power BI, the FP&A Dashboard in Power BI build guide walks through the complete measure layer including receivables aging, variance analysis, and forecast vs. actuals.
Healthcare: Count patient encounters exceeding a clinical threshold
A US hospital system under HIPAA needs to count emergency department encounters where length of stay exceeded 4 hours - a core throughput metric for bed capacity planning and CMS reporting:
```
ED Encounters Over 4H =
COUNTX(
ED_Encounters,
IF(
ED_Encounters[LOS_Hours] > 4
&& ED_Encounters[DeptCode] = "ED",
1,
BLANK()
)
)
```
The measure aggregates before any visual renders individual patient records, so the report displays only a count - not the underlying rows. This is a standard HIPAA-compliant aggregation pattern for clinical KPI dashboards. The Hospital Patient Flow & Bed Capacity Dashboard in Power BI article covers the full dashboard design including occupancy rate, bed turnaround, and ALOS measures.
For UK NHS trusts and EU healthcare organizations, the same COUNTX aggregation pattern satisfies GDPR Article 5 data minimization requirements - the aggregated count carries no personal data even though the underlying table does.
What Are the Most Common COUNTX Mistakes in DAX?
Mistake 1: Returning 0 instead of BLANK()
This is the most frequent COUNTX error found in production models:
```
-- WRONG: counts every row because 0 is non-blank
Wrong Count = COUNTX(Sales, IF(Sales[Discount] > 0, 1, 0))
-- CORRECT: skips rows where condition is false
Correct Count = COUNTX(Sales, IF(Sales[Discount] > 0, 1, BLANK()))
```
When the condition is false, the expression must return BLANK(). A return of 0 is a non-blank number - COUNTX counts it, and the measure silently returns COUNTROWS(Sales) rather than the intended conditional count.
Mistake 2: Using COUNTX where DISTINCTCOUNT is correct
COUNTX with a column reference counts non-blank values - it is equivalent to COUNTA, not DISTINCTCOUNT:
```
-- Counts non-blank rows, NOT unique customers
Wrong = COUNTX(Sales, Sales[CustomerID])
-- Correct for unique customer count
Correct = DISTINCTCOUNT(Sales[CustomerID])
```
This mistake appears when analysts assume COUNTX is a general-purpose "smart count." It is not - it iterates and counts non-blank expression results. For unique-value requirements, DISTINCTCOUNT is always the right function.
Mistake 3: Ignoring CALCULATE + COUNTROWS performance
For large tables - common in healthcare transaction logs or financial ledgers with tens of millions of rows - CALCULATE + COUNTROWS typically runs 3–8x faster than an equivalent COUNTX on import-mode models because it pushes the filter directly to the VertiPaq storage engine rather than iterating row by row in the formula engine. The gap widens further in DirectQuery mode, where each COUNTX iteration can generate additional SQL round-trips:
```
-- Slower on large tables: row-by-row iteration in formula engine
Slower = COUNTX(Transactions, IF(Transactions[Amount] > 0, 1, BLANK()))
-- Faster: filter pushed to storage engine
Faster = CALCULATE(COUNTROWS(Transactions), Transactions[Amount] > 0)
```
Reserve COUNTX for conditions that genuinely require expression evaluation. Use CALCULATE + COUNTROWS for straightforward column filters.
Mistake 4: Passing ALL() as the table argument unintentionally
Passing ALL(TableName) as the first argument bypasses all report filter context - the count reflects the full table regardless of any slicer or page filter:
```
-- Ignores all report filters - almost always wrong
All Rows = COUNTX(ALL(Sales), IF(Sales[Region] = "North", 1, BLANK()))
```
Understanding the interaction between ALL(), ALLSELECTED(), and filter context is essential for measures that behave correctly under user interaction. The ALLSELECTED DAX function in Power BI article explains this distinction with worked examples.
When Should You Choose COUNTX Over CALCULATE and COUNTROWS?
Choose COUNTX when the counting condition requires a computed expression that cannot be written as a static column filter. The practical decision framework:
1. Static column filter - use CALCULATE + COUNTROWS. Faster, cleaner, storage-engine optimized. On import tables above 1 million rows the performance difference is reliably measurable in Performance Analyzer.
2. Computed value condition (date arithmetic, threshold derived from another column, multi-step logic) - use COUNTX.
3. Virtual table iteration (SUMMARIZE, ADDCOLUMNS, or FILTER result as the table argument) - use COUNTX.
4. Unique value count - use DISTINCTCOUNT, not COUNTX.
5. Any non-blank value count without conditions - use COUNTA or COUNTROWS, not COUNTX.
The X-function pattern - SUMX, AVERAGEX, COUNTX, MAXX, MINX - follows a consistent mental model: the first argument is the table to iterate, the second is the expression to evaluate per row. Once internalized, all iterator functions become predictable. For teams moving from SQL or Cognos to DAX, the Power Query vs DAX for Calculations in Power BI guide maps SQL aggregation patterns to their DAX equivalents and clarifies when transformation logic belongs in the query layer versus the measure layer.
---
About Lets Viz: Lets Viz has delivered Power BI and data analytics solutions since 2020, working with US healthcare systems, UK fintech firms, Canadian manufacturing companies, and global SaaS businesses. The team holds a 5.0 Clutch rating (as of 2026) and specializes in enterprise DAX model design, compliance-grade report architecture, and end-to-end managed analytics delivery.
When DAX complexity is slowing your team's reporting cycle, Managed Power BI services from Lets Viz provides expert model management, measure governance, and ongoing report maintenance so your analysts focus on decisions, not debugging.