Power BI Healthcare Dashboard Templates: 6 Layout Blueprints
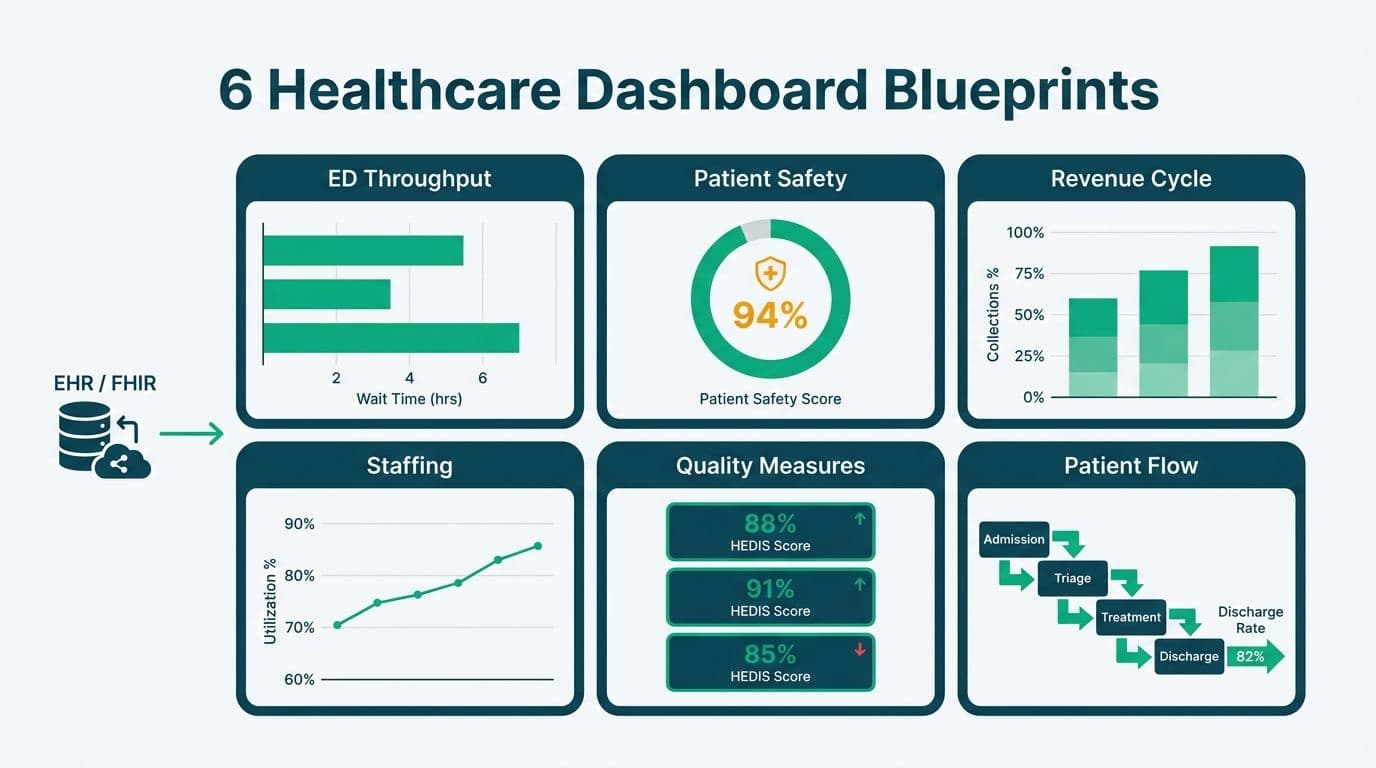
Power BI healthcare dashboard templates are pre-structured .pbix files that map clinical and operational KPIs to purpose-built report canvases - covering areas such as ED throughput, revenue cycle, and patient safety. A hospital or clinic data team can load a template, connect its EHR or FHIR endpoint, and have a compliant, role-secured reporting layer running in days rather than months, without rebuilding a data model from scratch.
Key Takeaways
Six core template layouts cover the full hospital operating model: ED throughput, patient safety, revenue cycle, staffing, quality measures, and population health.
Each .pbix file follows a three-layer structure: data model (tables and relationships), a DAX calculation layer (pre-written measures), and the report canvas.
FHIR R4 endpoints connect directly to Power BI via Power Query's built-in FHIR connector or a REST API custom connector.
Row-level security (RLS) is a mandatory control under HIPAA (US), GDPR (UK/EU), and PIPEDA (Canada).
Power BI Report Server keeps PHI on-premises; Power BI Service, backed by a Microsoft Business Associate Agreement, supports cloud deployment for HIPAA-covered entities.
What Do Power BI Healthcare Dashboard Templates Include?
A healthcare dashboard template is more than a visual skin applied to data. The .pbix file bundles three interdependent layers that together define how data flows from source systems to the clinical user.
Layer 1 - Data model: Fact tables for encounters, patients, providers, diagnoses (ICD-10/11), procedures (CPT), payers, and a date dimension. Star-schema relationships keep DAX calculations fast even across multi-year encounter histories. A US health system ingesting five years of EHR data typically lands this model at 50-200 million rows in the encounter fact table; Import mode with scheduled refresh handles this comfortably for non-real-time use cases.
Layer 2 - DAX calculation layer: Pre-written measures for ALOS (average length of stay), door-to-physician time, CMI-adjusted revenue, nurse-to-patient ratios, 30-day readmission rates, and HEDIS compliance percentages. These measures live in a dedicated hidden Measures table, separate from fact tables, so the model stays clean when clinical leadership requests new KPIs mid-deployment.
Layer 3 - Report canvas: Slicers for date range, facility, department, and payer class. Conditional formatting flags outlier thresholds (such as boarding hours above four, or AR days above 50). Bookmarks toggle between an executive summary view and a drill-through detail page. A quality improvement team at a US academic medical centre can hand this canvas to an attending physician and expect intuitive navigation without formal training.
Our Managed Power BI for healthcare teams service pre-loads these three layers and connects them to Epic, Oracle Health, or any HL7-compliant EHR within a defined onboarding sprint.
Pre-built templates compress the time-to-value curve from months to weeks.
Which Six Template Layouts Cover the Full Hospital Operating Model?
The six layouts below map to the six most common performance conversations in a US hospital boardroom, UK NHS trust board, or Canadian regional health authority. Each is a standalone .pbix that can be deployed independently or linked into a hub-and-spoke workspace architecture.
Template 1: ED Throughput and Bed Capacity
Core KPIs: Door-to-triage time, door-to-physician time, LWBS (left without being seen) rate, ED boarding hours, bed occupancy by unit, and average ED length of stay.
Data sources: ADT (admit/discharge/transfer) feed from the EHR, real-time bed management system, and optional RTLS (real-time location system) data. A hospital patient flow and bed capacity dashboard in Power BI typically refreshes from the ADT system every 15 minutes using DirectQuery or a push dataset to keep the occupancy view current.
Key design element: A live occupancy matrix - rows for nursing units, columns for bed status (available, occupied, cleaning, blocked). Color-coded conditional formatting flags units above 90% occupancy in red. A drill-through page shows individual patient timestamps for root-cause analysis of boarding events.
Template 2: Patient Safety
Core KPIs: Fall rate per 1,000 patient days, CAUTI and CLABSI rates, medication error frequency, harm event index, and near-miss report volume.
Data sources: Event reporting system, EHR nursing flowsheets, and pharmacy dispensing records.
Key design element: A statistical process control (SPC) run chart overlay that plots each safety metric against control limits, distinguishing common-cause variation from special-cause signals. A UK NHS trust using a comparable layout reduced its manual incident review cycle from three weeks to four days by surfacing outlier wards in the dashboard before the patient safety committee meeting.
Template 3: Revenue Cycle
Core KPIs: Gross and net collection rate, days in AR, denial rate by payer, clean claim rate, and cash-on-hand days.
Data sources: EHR billing module or standalone RCM platform. For FHIR-enabled billing pipelines, the ExplanationOfBenefit (EOB) resource maps directly to denial and payment records, eliminating the need for a separate billing extract.
Key design element: A payer waterfall chart that starts at gross charges, applies contractual adjustments, write-offs, and denials, and lands at net collected revenue. Finance leadership at a 200-bed US community hospital can reconcile this view against the general ledger in minutes rather than hours.
Template 4: Staffing and Labor Analytics
Core KPIs: Productive vs non-productive hours, overtime percentage, nurse-to-patient ratio by shift, agency spend as a percentage of total labor, and turnover rate by unit.
Data sources: HRIS (Workday, UKG, or similar), scheduling system, and payroll. Labor data is rarely in the EHR, so this template uses a separate staging table joined to encounter data via a shared facility/department key.
Key design element: A heat map of nurse-to-patient ratios across days and shifts, with a reference line at the regulatory minimum. This is particularly relevant in US states with mandated staffing ratios (California, New York, Oregon). With US hospital systems continuing to carry elevated travel-nurse agency spend in 2026 — averaging 8-12% of total labor budgets at many community hospitals — the agency spend metric has become a board-level KPI rather than a purely operational one. A Canadian regional health authority can substitute provincial staffing benchmarks using a Power Query parameter table without altering the core data model.
Template 5: Quality Measures and Regulatory Reporting
Core KPIs: HEDIS measure compliance rates, HCAHPS domain scores, core measure performance (sepsis bundle, stroke protocol), 30-day all-cause readmission rates, and mortality index.
Data sources: Quality reporting extracts from the EHR, HCAHPS vendor survey data, and CMS quality reporting APIs.
Key design element: A measures scorecard table with measure name, current rate, national benchmark, gap-to-benchmark, and trend arrow. For UK providers, the same layout adapts to CQC (Care Quality Commission) domain scores; for Canadian organizations, provincial quality indicator frameworks apply.
Template 6: Population Health
Core KPIs: Attributed lives by risk tier, care gap closure rate, chronic condition prevalence (diabetes, hypertension, COPD), preventive care utilization, and total cost of care per member.
Data sources: Claims data from payer feeds or all-payer claims databases, care management platforms, and SDOH datasets. FHIR bulk export from an ACO's shared EHR is the preferred modern source for attributed patient populations.
Key design element: An Azure Maps tile layer that plots risk-tier concentration by ZIP code or postal code. A US ACO managing a value-based care contract can identify under-served census tracts and direct outreach resources with this geographic view.
How Do You Connect FHIR and EHR Data to Power BI for Clinical Reporting?
Power BI supports FHIR R4 endpoints natively through Power Query's FHIR connector. The connection sequence: authenticate via OAuth 2.0 using your EHR's registered application credentials, specify the base FHIR URL, select the FHIR resources needed (Patient, Encounter, Observation, Condition, Claim, ExplanationOfBenefit), and load them into Power Query for transformation and shaping.
For Epic on FHIR, Azure Health Data Services, or AWS HealthLake, the connector handles pagination automatically. Larger organizations - a 600-bed US health system pulling three years of encounter history - should use the FHIR bulk export (`$export` operation) and stage the NDJSON output in Azure Data Lake before connecting Power BI. The choice between Import and DirectQuery mode for these volumes carries significant refresh and latency trade-offs; see the guide on Power BI Import vs DirectQuery for a practical decision framework at hospital scale.
For HL7 v2 messages (ADT, ORM, ORU), an integration engine must translate to tabular format before Power BI can consume the feed. Map A01 (admit), A02 (transfer), and A03 (discharge) events to the encounter fact table to power the bed capacity and throughput templates.
Under US ONC regulations implementing the 21st Century Cures Act, certified EHR vendors are required to expose FHIR R4 APIs - meaning most US hospitals now have a compliant FHIR endpoint available and no longer require a custom HL7-to-tabular extraction layer for core clinical resources.
How Do You Configure Power BI Row-Level Security for Healthcare Data?
Row-level security (RLS) in Power BI filters data at the row level based on the authenticated user's identity, ensuring a department head sees only their unit's patient data rather than the entire facility's. This is a compliance requirement in all regulated healthcare environments - not an optional feature.
To configure RLS for a healthcare dataset:
1. In Power BI Desktop, navigate to the Modeling tab and select Manage Roles. Create roles such as "Unit Nurse," "Department Director," and "Executive."
2. Write a DAX filter for each role. For a department-scoped role: `[DepartmentCode] = LOOKUPVALUE(UserDeptMapping[DeptCode], UserDeptMapping[UPN], USERPRINCIPALNAME())` - joining the authenticated user's principal name to a DepartmentAccess mapping table.
3. Publish to Power BI Service (or Report Server), then assign Azure Active Directory groups to each role under Dataset Settings - Security.
4. Test using "View as role" before granting access to any clinical user.
For US organizations, RLS satisfies the HIPAA Security Rule's access control standard (45 CFR §164.312(a)(1)). For UK NHS trusts and EU health organizations, it fulfills GDPR Article 25's data protection by design requirement. Canadian health organizations under PIPEDA - and Quebec's Law 25 - must restrict access to the minimum necessary personal health information, and RLS is the primary technical control that enforces this at the report layer.
The broader compliance framework that RLS fits within - including audit logging, sensitivity labels, and data classification - is covered in the AI analytics data privacy risks healthcare audit guide.
Power BI Report Server vs Power BI Service: Which Is Right for Healthcare?
The deployment decision hinges on PHI residency requirements and your IT governance model. Recent adoption surveys show that the majority of US health systems deploying Power BI after 2025 are choosing Power BI Service with a Microsoft BAA, citing cloud refresh cadence and AI feature access as decisive factors - while air-gapped environments and on-premises EHR deployments continue to favor Report Server.
| Dimension | Power BI Report Server | Power BI Service (cloud) |
|---|---|---|
| PHI residency | On-premises or private cloud | Microsoft-hosted (BAA available) |
| HIPAA compliance path | On-prem security controls | Microsoft BAA plus tenant controls |
| Data refresh frequency | Up to 8 scheduled refreshes/day | Up to 48x/day (Premium) |
| FHIR connector | Available via Power BI Desktop | Available; direct cloud connectors |
| Licensing model | Report Server license or Premium P | Pro, Premium Per User, or Fabric |
| AI visuals and Copilot | Not available | Available on Premium or Fabric |
| Best fit | Air-gapped networks, on-prem EHR | Cloud EHR (Epic on FHIR, Azure) |
Most US academic medical centres and integrated delivery networks are moving toward Power BI Service, treating the Microsoft BAA as sufficient HIPAA coverage. UK NHS trusts operating under NHS England's cloud security framework follow a similar path. Canadian provincial health authorities often require data residency in Canadian Azure regions (Canada Central or Canada East) - a requirement covered by Microsoft's region-specific data residency commitments, making cloud deployment viable under PIPEDA.
What Does Healthcare Power BI Reporting Implementation Cost?
Implementation costs depend on scope, source-system complexity, and whether the organization deploys pre-built templates or commissions a custom build.
Typical cost ranges for a US hospital (as of 2026):
Template deployment (pre-built layouts like the six above): USD 15,000 - 45,000. Covers EHR connector setup, RLS configuration, user acceptance testing, and staff training. Timeline: 4-8 weeks.
Custom build (bespoke data model): USD 65,000 - 160,000+. Includes full data model design, DAX library development, and phased rollout. Timeline: 3-6 months.
Managed service (ongoing operations): USD 3,000 - 9,000/month. Covers refresh monitoring, model updates, new KPI requests, and annual compliance reviews.
UK NHS trusts procuring through Crown Commercial Service frameworks and Canadian regional health authorities using provincial procurement vehicles see comparable ranges in local currency. A free BI readiness self-assessment helps determine which investment tier matches your organization's current data maturity before committing budget.
For real-world benchmarks on what peer organizations have built, see Healthcare KPI Dashboard Examples by Department and Power BI Consulting for Healthcare Organizations.
Ready to deploy compliant, production-grade dashboard templates for your clinical and operational teams? Managed Power BI for healthcare teams from Lets Viz covers template configuration, EHR connectivity, RLS setup, and ongoing model maintenance - so your teams get dashboards that are live, accurate, and trusted from day one. Use the instant project cost calculator to scope your engagement in under two minutes.
---
About Lets Viz: Lets Viz is a specialist analytics consultancy serving US healthcare systems, UK fintech firms, Canadian manufacturing companies, and global SaaS organizations since 2020. Our Power BI and Microsoft Fabric practice holds a 5.0 Clutch rating, with certified engineers delivering compliant, production-grade dashboards across HIPAA, GDPR, and PIPEDA regulatory environments.
---