Tableau vs Power BI for Small Hospitals and Clinics
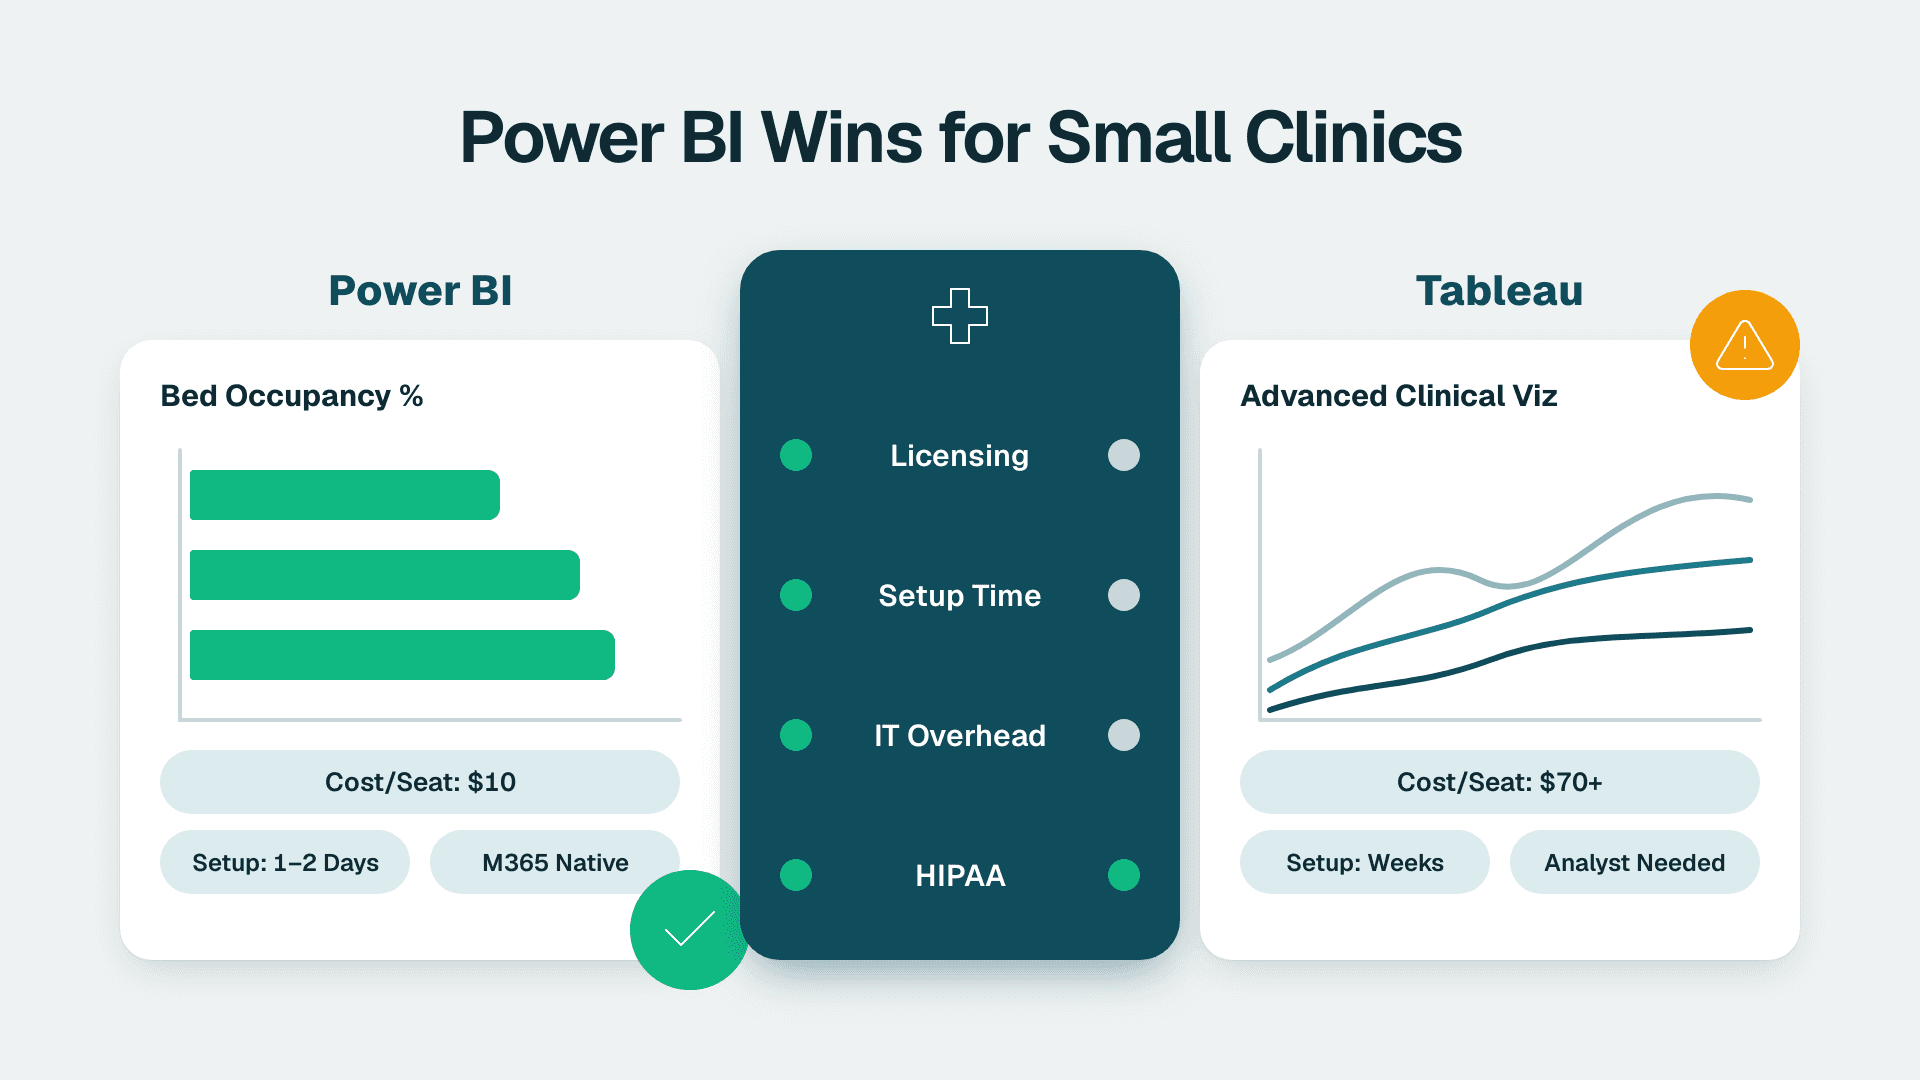
For most small hospitals, independent practices, and community health systems with limited IT staff, Power BI is the stronger starting point. Microsoft's licensing model, native M365 integration, and lower per-seat costs deliver working dashboards faster and cheaper. Tableau's edge in flexible visualization and clinical dashboard storytelling becomes worthwhile only when your organization has dedicated analyst capacity and genuinely complex reporting requirements that the platform's freeform canvas uniquely handles.
Quick Comparison: Tableau vs Power BI for Small Hospitals and Clinics
| Criteria | Power BI | Tableau |
|---|---|---|
| Per-seat cost (typical) | $10/user/month (Pro - create and view) | $15-75/user/month (Viewer to Creator) |
| Free tier | Power BI Desktop (local only, not HIPAA-safe) | Tableau Public (not HIPAA-safe) |
| HIPAA BAA available | Yes - Microsoft cloud BAA | Yes - Tableau Cloud BAA |
| Typical time to first dashboard | 2-4 weeks | 4-8 weeks |
| IT staff requirement | Low - M365 admin sufficient | Medium - dedicated data staff recommended |
| EHR connectivity | Strong - Power Query connectors | Strong - native connectors |
| Setup complexity | Moderate - Excel-adjacent learning curve | Steeper - requires prior Tableau experience |
| Scalability path | Microsoft Fabric | Salesforce Data Cloud |
Licensing and Real Costs for Small Healthcare Organizations
Power BI wins on cost at every tier below 100 seats. A 20-person clinical operations team reviewing dashboards monthly pays roughly $200/month on Power BI Pro versus potentially $300 or more for Tableau Viewer licenses alone - before adding the Creator licenses your analysts need to build those views.
Power BI Pro runs approximately $10 per user per month. If your organization already runs Microsoft 365 E3 or E5, Pro licenses may already be bundled in - check your tenant admin panel before budgeting for new tools. For practices that need paginated, print-ready compliance reports (CMS audit trails, payer reconciliation summaries), Power BI paginated reports for healthcare compliance are available under Premium Per User at roughly $20/month, undercutting equivalent Tableau formatted-output options significantly.
Tableau's licensing is author-centric. Anyone who builds or edits a workbook needs a Creator license at approximately $75/user/month. Viewer licenses (~$15/month) are cheaper, but in a small hospital where department heads often want to adjust filters or drill into their own data, viewer access becomes inadequate quickly and you end up paying Creator rates for more seats than initially planned.
Cost comparison for a five-person analytics setup:
- Power BI: 5 Pro licenses = ~$50/month, or potentially $0 if Microsoft 365 E3 is already in place
- Tableau: 2 Creator + 3 Explorer = roughly $150 + $126 = ~$276/month
For a community clinic managing tight margins, that gap compounds considerably across a three-year contract.
For smaller practices without a dedicated BI engineer, the in-house model may not be the right starting point. Managed Power BI services often cost less than hiring and retaining internal analytics staff when you factor in training, license management, and model refresh maintenance. The managed Power BI service vs in-house BI team cost question deserves a proper model before committing to either platform.
Tableau vs Power BI for Small Hospitals: HIPAA Compliance and Data Security
Both platforms support HIPAA-compliant deployments, but the implementation paths differ meaningfully.
Microsoft provides a Business Associate Agreement covering Power BI Service as part of its Microsoft 365 and Azure compliance umbrella. Row-Level Security restricts which patient cohorts or facilities each user can access - a critical control in multi-department environments. The setup for Power BI RLS for HIPAA PHI data protection is well-documented and achievable by an M365 admin without specialist consulting.
Tableau Cloud also supports a signed HIPAA BAA, and Salesforce's compliance posture is strong. The key distinction is Tableau Server (self-hosted): that deployment model places the full compliance burden on your IT team, covering patching, encryption at rest, audit logging, and access controls. For a small hospital with a two-person IT department, self-hosted Tableau is a liability, not an asset.
AI features require active governance on both platforms. Research from Witness.ai found that organizations with high levels of Shadow AI faced average breach costs of $4.74 million, compared to $4.07 million for organizations with low Shadow AI exposure. Both Power BI Copilot and Tableau's Einstein-based AI capabilities can expose PHI if not properly scoped and governed. Disable AI summarization on any dataset containing patient identifiers until your compliance officer has reviewed the data residency terms in your BAA.
Data residency is a secondary consideration that both platforms handle differently. Microsoft allows Power BI tenant administrators to pin storage to a specific Azure region through the admin portal - relevant if your organization must comply with state-level health data localization requirements that go beyond federal HIPAA rules. Tableau Cloud offers comparable US-region tenancy options. Confirm your region settings before migrating any PHI to either platform's cloud storage.
For audit and access logging, Power BI's Activity Log - accessible via the Microsoft 365 admin center or PowerShell - captures every report view, export, and dataset access. Integration with Microsoft Purview provides a near-complete audit chain for regulated environments with minimal additional configuration. Tableau's Admin Views cover similar ground on Tableau Cloud, but logging depth is less granular by default.
Setup Time and IT Overhead in Clinical Environments
Power BI has a materially shorter runway for Microsoft-aligned organizations. If your EHR exports to SQL Server, Azure SQL, or SharePoint-hosted Excel files, Power BI's Power Query connectors are ready to use without custom development. A practice with an M365 admin already in place can have a working operational dashboard - bed capacity, appointment volumes, lab turnaround times - within two to four weeks without a dedicated BI hire.
Tableau's setup curve is steeper. Its Desktop application is more capable for complex visual layouts, but the learning path is real. A Tableau implementation that goes beyond basic connected worksheets typically requires someone with prior Tableau experience. Training a clinical operations coordinator to build dashboards from scratch adds weeks that Power BI's Excel-adjacent interface does not require.
EHR connectivity is roughly equivalent between the two tools. Epic, Cerner, and athenahealth have documented connection paths for both platforms. The practical differentiator is your existing data infrastructure: SQL Server and Azure environments plug into Power BI with less friction; MySQL, PostgreSQL, and web-based clinical data sources work comparably in both.
For organizations weighing the ongoing power bi in-house vs outsourced managed service question, setup burden is exactly where the math tips. Two to three hours per week of analyst time maintaining refresh schedules, gateway configurations, and workspace permissions is easy to underestimate at procurement time but significant across a twelve-month period.
Reporting Depth: Clinical Dashboards and Operational Output
Tableau has a genuine edge in freeform visual design. Its drag-and-drop canvas gives experienced analysts more control over layout, annotation, and narrative structure. A patient satisfaction or clinical quality dashboard in Tableau can be built to match precisely how a CMO or CNO wants to read it - published patient satisfaction analytics dashboard examples show what is achievable with a skilled analyst behind it.
Power BI's layout is more constrained. Snap-to-grid behavior and limited cross-visual formatting options can frustrate analysts used to Tableau's flexibility. But for operational reporting - scheduled distributions, paginated billing summaries, CMS compliance exports - Power BI's toolset is more complete. Power BI Report Builder handles pixel-perfect paginated reports without requiring separate SSRS infrastructure, and output is format-stable whether viewed on screen or printed for a payer audit.
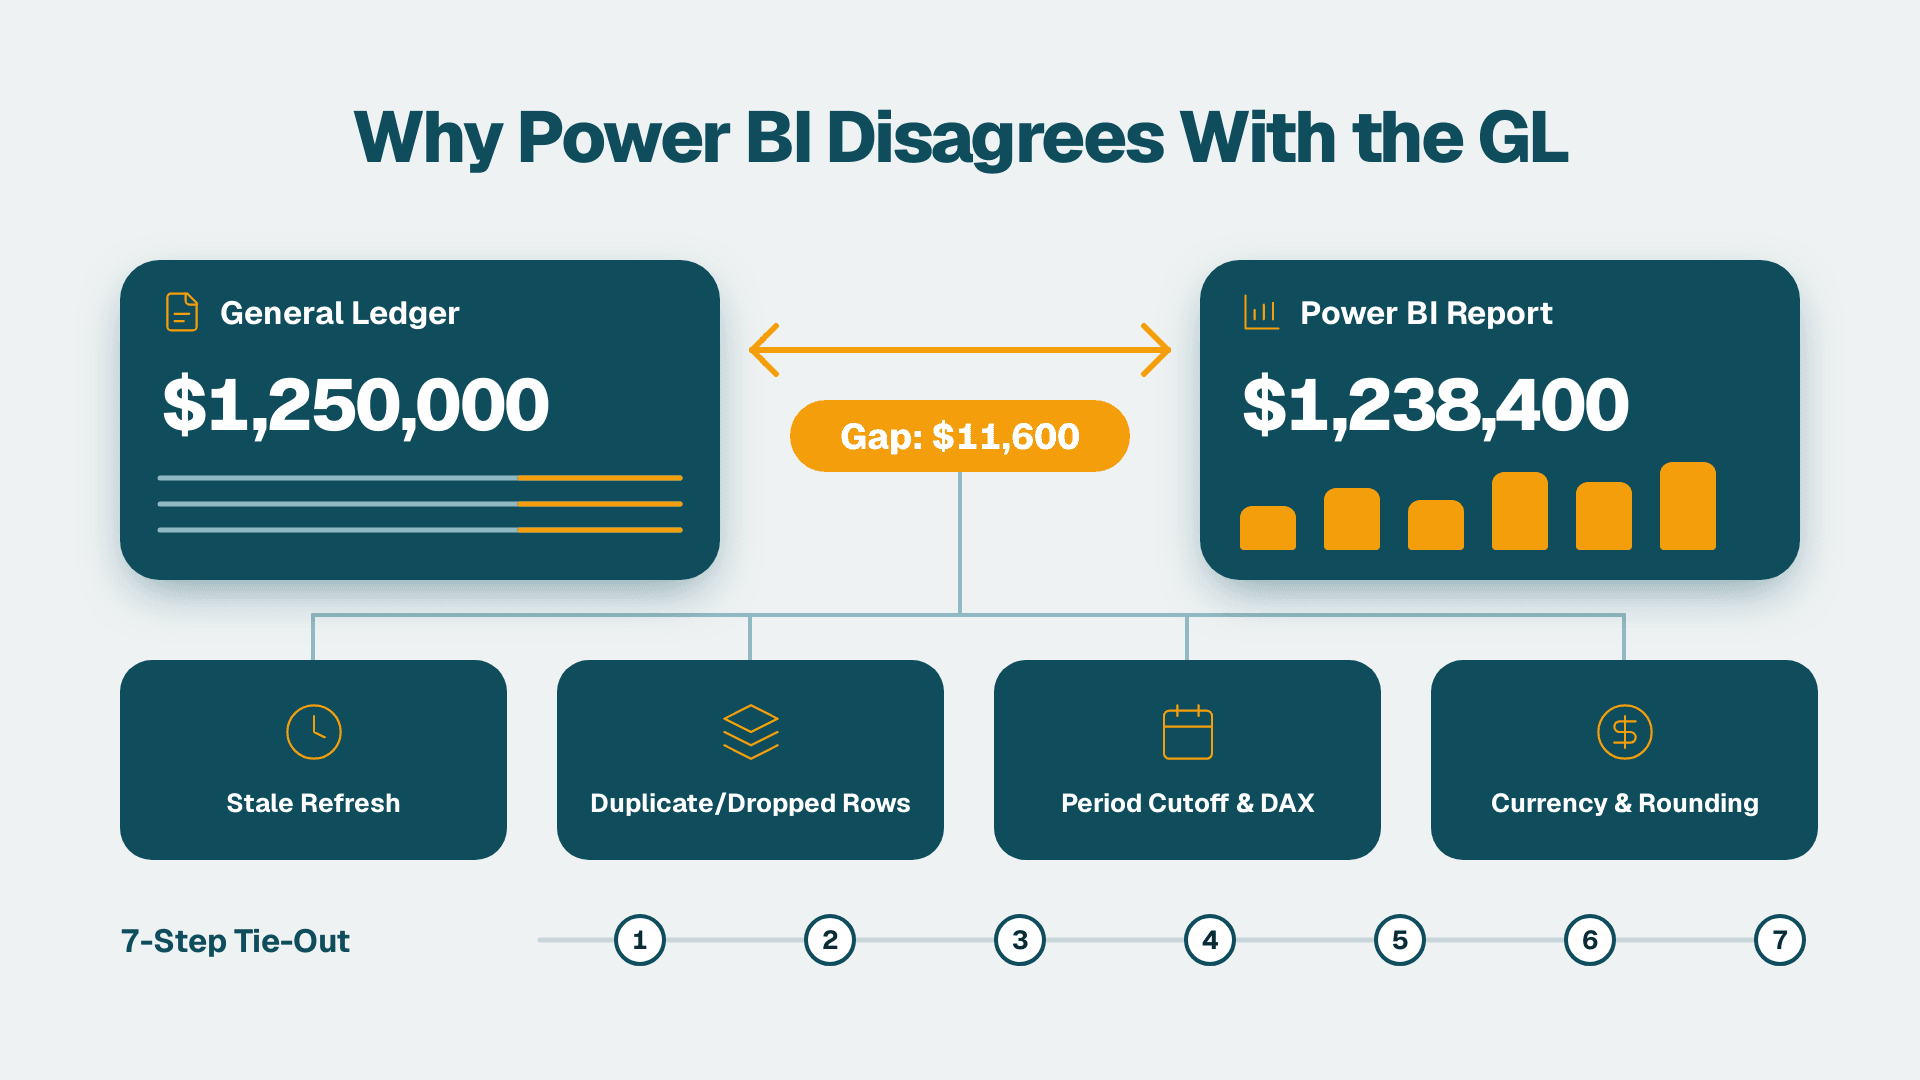
A data trust scenario worth considering: an events production company we worked with had two Tableau reports showing different totals, and nobody knew which to trust. We reconciled the numbers and proved the grand totals matched exactly - the only real difference was 34 filler rows from different date windows. The dispute was never about the data. In a healthcare setting, that kind of silent discrepancy - two department heads looking at different census figures or cost-per-case numbers - carries real clinical and financial weight. Neither platform prevents this; strong data model governance does.
For analysts considering the power bi vs tableau for data analyst career question, Power BI skills are more transferable across mid-market healthcare organizations given Microsoft's position in the sector. Tableau expertise commands a premium at large academic medical centers and health systems with mature analytics functions and complex visualization requirements.
Microsoft Fabric is worth flagging for organizations planning ahead. The Microsoft Fabric architecture for analytics teams consolidates Power BI, data engineering pipelines, and data science workloads into a single governed platform. For a small hospital in 2026, Fabric is premature as a starting point. But it means a Power BI investment has a clear scaling path if the organization grows, merges into a larger system, or needs to move beyond departmental dashboards.
For practices without complex PHI reporting requirements that want a free starting point for non-clinical operational metrics, Looker Studio offers a zero-license option. Looker Studio dashboard examples for business reporting are widely available and illustrate what lightweight reporting looks like before a licensed platform investment. It lacks a formal HIPAA BAA, so it is limited to non-patient data - but it helps validate your team's analytical appetite before committing budget.
When to Choose Power BI
- Your organization already runs Microsoft 365 and wants to leverage existing license entitlements
- IT staff is limited to one or two generalists without dedicated BI expertise
- Primary reporting covers operational metrics: census, appointment utilization, billing reconciliation, scheduling efficiency
- Compliance requirements include paginated, print-stable reports for payer audits or CMS submissions
- Analysts have SQL or Excel backgrounds but limited prior experience with dedicated visualization platforms
- You are evaluating a managed service model and want a platform a third-party provider can run cost-effectively
- Future roadmap may involve Microsoft Fabric, Azure Synapse, or broader Microsoft data infrastructure
When to Choose Tableau
- At least one dedicated data analyst on your team already has hands-on Tableau experience
- Dashboards serve clinical leadership audiences who need narrative-driven, visually distinctive presentations
- Your organization is already in a Salesforce environment where Data Cloud integration is native
- Reporting involves complex multi-source data blending that benefits from Tableau Prep's visual pipeline builder
- Dashboards will be distributed to external partners, referring networks, or payer portals where brand-consistent visual design matters
- Budget is not the primary constraint and your analysts would genuinely be limited by Power BI's canvas structure
The Verdict
For the majority of small hospitals, independent practices, and community health systems, Power BI is the right default choice. The licensing economics are stronger at small seat counts, M365 integration reduces implementation friction, and the compliance infrastructure - signed BAA, Row-Level Security, Activity Log, Purview integration - meets HIPAA requirements without specialist setup. Teams without a dedicated BI hire reach working dashboards faster and at a lower total cost.
Tableau is the right call in one specific scenario: you have an experienced Tableau analyst on staff, leadership expects polished presentation-grade clinical dashboards, and your organization is not embedded in the Microsoft ecosystem. In that situation, Tableau's visualization ceiling justifies the cost premium. For everyone else, the capability gap does not warrant the per-seat price difference or the longer implementation timeline.
---
If you are sizing the investment, our instant project cost calculator gives you a realistic estimate for Power BI or Tableau implementation based on your team size, data sources, and reporting requirements - no sales call required.
---
About Lets Viz: Lets Viz has delivered analytics solutions across healthcare, finance, retail, and professional services since 2020. Our team holds a 5.0 rating on Clutch and works with independent practices, community hospitals, and enterprise health systems on Power BI, Tableau, and Microsoft Fabric implementations - from initial licensing strategy through ongoing managed dashboard services.