Power BI Healthcare Analytics Case Study: EHR to Insight
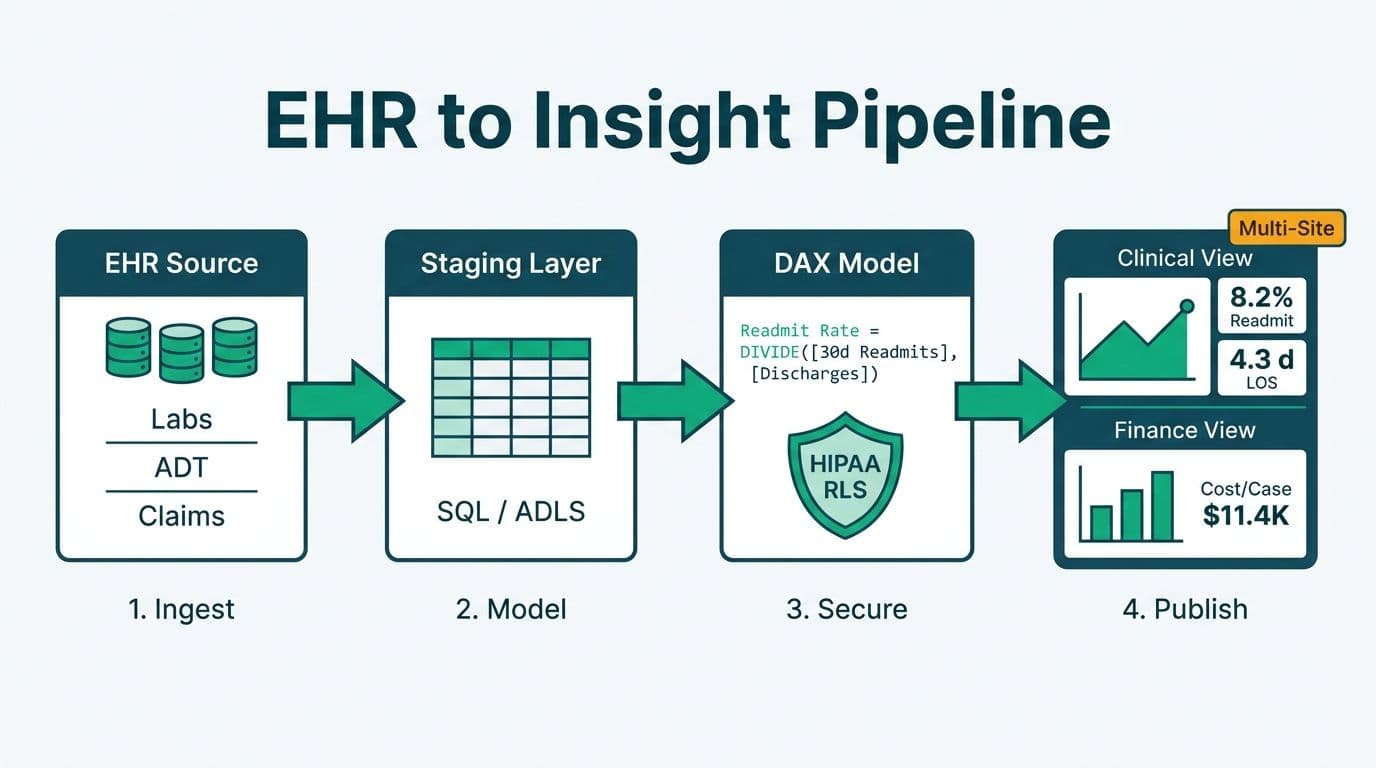
A Power BI healthcare analytics implementation connects raw EHR data to executive and clinical dashboards through a structured pipeline: ingest, model, secure, and publish. The composite walkthrough below covers EHR integration, DAX modeling for clinical and finance views, row-level security for HIPAA compliance, and a Power BI Service rollout across a multi-site health system - the sequence most US, UK, and Canadian health organizations follow in practice.
Key Takeaways
- EHR data should land in a staging layer before Power BI connects to it - querying production EHR systems directly creates performance and security risk
- DAX separates clinical metrics (length of stay, readmissions) from finance metrics (revenue cycle, denial rates) at the model level, not the report level
- Power BI row-level security enforces site- and role-based access so staff at one facility cannot see another site's patient data
- Power BI Service (cloud) is the preferred deployment for multi-site rollout when a HIPAA Business Associate Agreement is in place with Microsoft
- A phased rollout - pilot site, then validation, then enterprise - reduces compliance exposure and change-management risk
What Does a Power BI Healthcare Analytics Case Study Look Like?
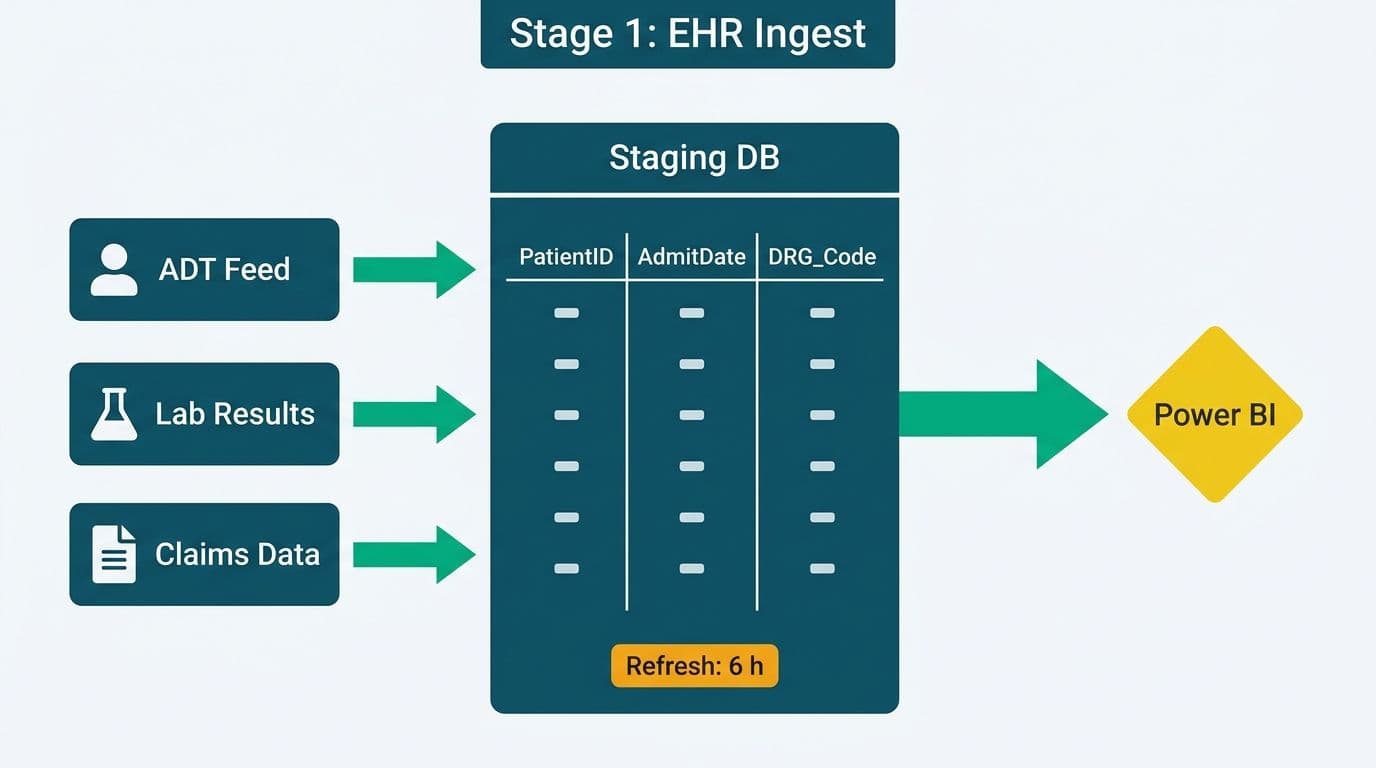
A composite walkthrough based on typical health system delivery covers three layers: EHR and billing data integration, DAX modeling that separates clinical and finance logic, and a governed Power BI Service rollout across facilities. The sequence below reflects the decision path a health system CIO or data team lead would actually follow.
Health systems in the US operate under HIPAA, which classifies most patient data as Protected Health Information (PHI). Any BI platform that processes PHI must be covered by a Business Associate Agreement (BAA). Microsoft offers a BAA for Power BI Premium and Power BI Pro subscriptions, as documented in Microsoft's Online Services Terms (2025). UK NHS trusts face equivalent obligations under the Data Security and Protection Toolkit and UK GDPR; Canadian provincial health authorities must align with PIPEDA and provincial legislation such as Ontario's Personal Health Information Protection Act (PHIPA).
For healthcare teams beginning this journey, our Managed Power BI for healthcare teams service covers the full delivery lifecycle - from EHR connection design to workspace governance across multiple sites.
How Do You Integrate EHR Data into Power BI?
EHR systems do not expose clean, report-ready tables. Integration requires a staging layer between the source system and Power BI to protect live EHR performance and give the analytics team a controlled schema.
The standard four-step pattern:
1. Extract - Pull records via the EHR's FHIR R4 API, HL7 feeds, or a read-replica database where the vendor permits. ADT (Admission, Discharge, Transfer) events and charge records are the two primary streams.
2. Stage - Land records in a cloud data warehouse or on-premise SQL Server. This isolates the EHR from BI query load and enforces a PHI boundary.
3. Transform - Power Query (M language) handles column type normalization, null handling, and joins between clinical and billing tables. Transformation logic belongs here rather than in DAX: Power Query runs at refresh time, DAX at query time. Our Power Query vs DAX for calculations in Power BI article explains where to draw that line.
4. Model - Import the cleaned dataset into Power BI Desktop. For most health system datasets - encounter records, lab results, charge lines - import mode outperforms DirectQuery on report render time.
A typical staging schema for a multi-site system includes:
- `dim_patient` (de-identified or tokenized for PHI control)
- `dim_provider`
- `dim_facility`
- `fact_encounter` (ADT events, length of stay, DRG codes)
- `fact_charge` (CPT codes, billed amounts, payer)
- `fact_claim` (claim status, denial codes, payment received)
This star schema maps directly to Power BI's in-memory engine: one fact table joined to dimension tables, minimizing cross-table DAX complexity.
How Do You Build DAX Models for Clinical and Finance Views?
Clinical and finance teams ask structurally different questions from the same underlying data - the DAX layer must serve both without letting one team's filter context corrupt the other's numbers.
Clinical KPIs:
- Average Length of Stay (ALOS): `ALOS = DIVIDE(SUM(fact_encounter[los_days]), COUNTROWS(fact_encounter))`
- 30-Day Readmission Rate: a calculated column flags whether each patient was readmitted within 30 days of discharge; a measure divides flagged encounters by total discharges in the filter context.
- Bed Occupancy Rate: `Occupancy % = DIVIDE([Occupied Bed Days], [Available Bed Days])`
- Case Mix Index (CMI): average DRG weight across all encounters in the current filter context.
Finance KPIs - Revenue Cycle Management:
- Days in AR: `Days in AR = DIVIDE([Net AR Balance], DIVIDE([Gross Charges], 365))`
- Denial Rate by Payer: `Denial Rate = DIVIDE(CALCULATE([Claim Count], fact_claim[status] = "Denied"), [Claim Count])`
- Net Collection Rate: adjusts gross collection for contractual allowances - a more meaningful revenue cycle indicator than gross collection alone.
The modeling discipline that prevents errors: place clinical measures in a dedicated `_Clinical Measures` table and finance measures in a `_Finance Measures` table inside Power BI Desktop. Report authors in clinical workspaces cannot accidentally cross a readmission rate with a denial code slicer - a combination that carries no clinical meaning.
Note that clinical trial data reporting in Power BI follows a stricter governance path. Trial data from clinical data management systems requires separate workspaces, static import-mode datasets locked at defined data cut dates, and version-controlled PBIX files to meet FDA 21 CFR Part 11 requirements in the US. Build it as a parallel workstream, not an extension of operational dashboards.
For the ADT data layer that feeds both clinical and RCM views, the hospital patient flow and bed capacity dashboard walkthrough covers how ADT events map to operational metrics.
What Is Power BI Row Level Security for Healthcare?
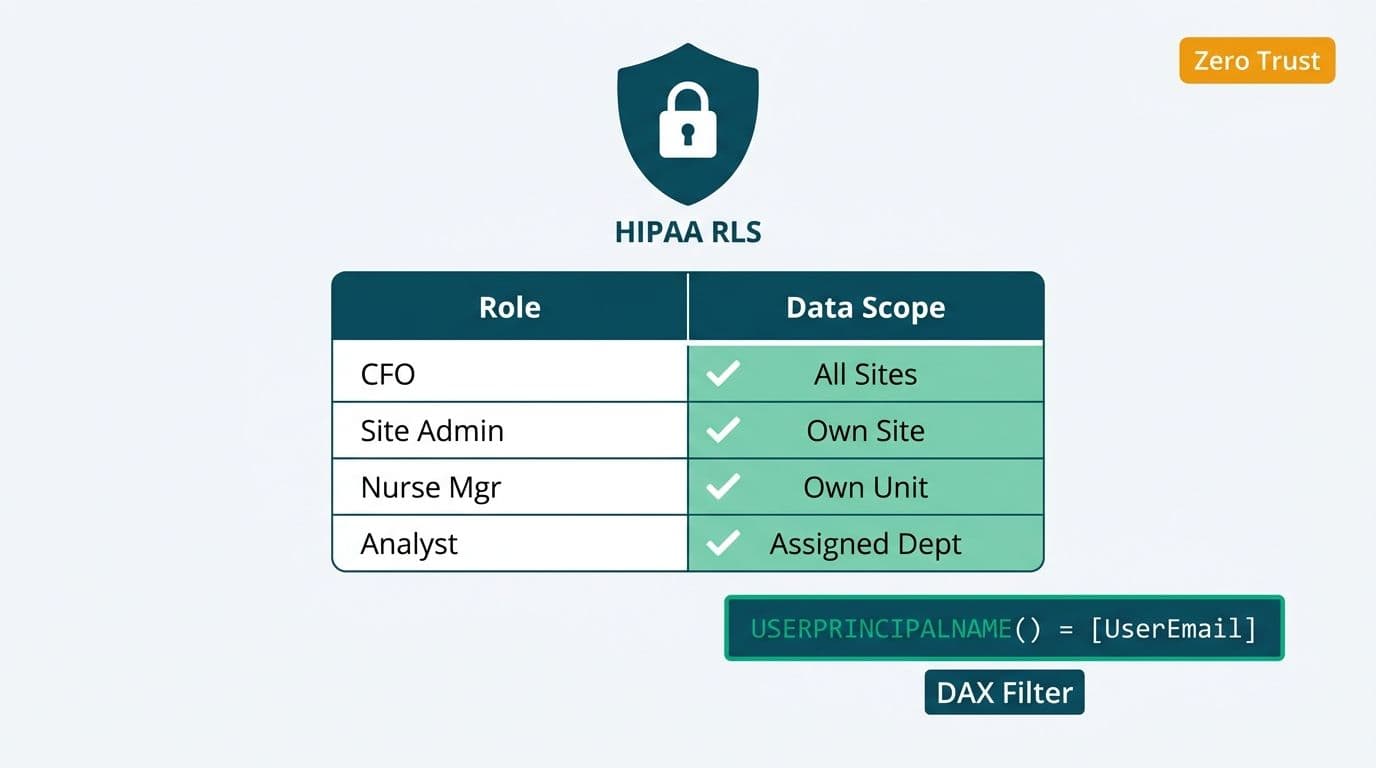
Power BI row-level security (RLS) restricts what data a given user sees at the row level - a ward manager at a facility in Toronto sees only that site's encounters and charges, while the enterprise CFO sees the consolidated multi-site view.
In a multi-site health system, RLS must enforce two orthogonal dimensions simultaneously:
1. Facility access - which sites a user is authorized to view
2. Role access - whether the user can see clinical data, finance data, or both
Implementation pattern:
Create a `dim_user_access` bridge table mapping each user's Azure Entra ID email to their allowed facility codes and role flags. Define a dynamic RLS role in Power BI Desktop:
```
[user_email] = USERPRINCIPALNAME()
```
This filter, applied to `dim_user_access`, cascades through all relationships to `fact_encounter` and `fact_claim`. A user not present in the mapping table sees zero rows - a secure default.
Dynamic RLS using `USERPRINCIPALNAME()` scales without republishing the dataset: adding a new user's row to `dim_user_access` takes effect at the next scheduled refresh.
HIPAA's Minimum Necessary Standard (45 CFR §164.514(d)) requires that access to PHI be limited to what each role requires. Dynamic RLS combined with Entra ID group membership satisfies this requirement and generates an auditable log via the Power BI activity log API. UK NHS trusts can apply the same pattern under the Data Security and Protection Toolkit; Canadian health authorities can align it with PIPEDA's access limitation principle under Principle 4.5.
For teams migrating from IBM Cognos, the Cognos Security Model vs Power BI RLS side-by-side mapping article translates the security architecture directly.
How Does Power BI Service Rollout Work Across a Multi-Site Health System?
The rollout architecture must solve three problems simultaneously: dataset governance (who can alter the semantic model), workspace isolation (which teams see which reports), and refresh reliability (scheduled refreshes that surface failures rather than silently using stale data).
Recommended workspace structure:
| Workspace | Contents | Access |
|---|---|---|
| Health-DataCore (Premium) | Semantic model, gateway config | Data engineering team only |
| Health-Clinical | Clinical reports via live connection | CMOs, nursing directors, ward managers |
| Health-Finance | Finance reports via live connection | CFO, revenue cycle, billing |
| Health-Executive | Executive scorecard via live connection | C-suite, board members |
This "thin reports" architecture versions the semantic model in one place. Report authors in Health-Clinical or Health-Finance connect via a live connection and cannot modify the underlying DAX - only visuals and page filters.
Gateway configuration for on-premise EHR data:
If the staging database is on-premise or in a private VNet, an on-premises data gateway is required. Run gateway clusters with at least two nodes to avoid refresh failure if one node goes offline, as documented in Microsoft's Power BI gateway documentation (2025).
Phased rollout sequence:
1. Pilot site - deploy clinical and RCM dashboards to one facility. Validate RLS, confirm refresh cadence, gather clinician feedback on metric definitions.
2. UAT - finance team reconciles Days in AR and denial rate against existing reports. Clinical team validates ALOS and readmission counts against the source EHR.
3. Enterprise rollout - promote to all sites. Communicate the change through department heads, not IT tickets: clinical adoption depends on trust, not access.
A US hospital system should confirm its Power BI subscription is covered by Microsoft's HIPAA BAA before connecting live PHI. A UK NHS trust should verify that Power BI tenant data residency is set to UK regions via the Microsoft 365 admin center. A Canadian provincial health authority should confirm data residency in Canadian data centers and review Microsoft's PIPEDA commitments in the Online Services Terms (2025).
If your organization has a data sovereignty policy that prevents cloud-hosted PHI, the Power BI Report Server vs Power BI Service for healthcare comparison covers the on-premise vs cloud decision in detail.
What Do Power BI Healthcare Dashboard Examples Cover in Practice?
A mature health system deployment typically surfaces four dashboard layers, each answering a different stakeholder's question.
Executive Scorecard: Designed for the board and C-suite. Metrics include case mix index trend, total discharges, gross vs. net revenue, and payer mix concentration. Drill-through leads to facility level only - no encounter-level detail at this layer.
Clinical Operations Dashboard: The most-requested power bi healthcare dashboard template in enterprise implementations. Metrics: ALOS by DRG, bed occupancy by unit, 30-day readmission rate, and ED throughput time. Slicers cover facility, service line, and period. A single-page canvas with sparkline trends and a DRG drill-down matrix is the standard layout.
Revenue Cycle Management Dashboard: Designed for revenue cycle and billing teams. Core metrics for a power bi revenue cycle management dashboard include Days in AR, denial rate by payer, denial reason distribution by remark code, clean claim rate, and average reimbursement per DRG. Conditional formatting flags payers where denial rate exceeds a defined threshold.
Workforce Analytics Dashboard: Typically the last layer deployed. Metrics: FTE by department, nurse-to-patient ratio by unit, overtime hours, and agency staff ratio. Hospital workforce analytics in Power BI requires joining HR system data (Workday, ADP, or equivalent) to facility and scheduling records - the data integration step routinely takes longer than the DAX build.
Power BI Compliance Reporting for Healthcare: What Auditors Need
Power BI compliance reporting for healthcare is not a single dashboard - it is a set of auditable outputs that satisfy internal audit, HIPAA Privacy Officer review, and external assessor requirements.
The artifacts a HIPAA-covered entity needs from its Power BI environment:
- Workspace access logs - exported from the Power BI activity log API (`Get-PowerBIActivityEvent` in PowerShell), showing who accessed which report and when.
- Dataset refresh history - available in Power BI Service under dataset settings; demonstrates that reports are based on data refreshed within the retention policy window.
- RLS validation documentation - a periodic export showing which users hold which roles, captured at each audit interval.
- Gateway credential audit - confirming that gateway service accounts follow least-privilege and are rotated on a defined schedule.
UK organizations under UK GDPR can use the same activity log exports to satisfy Article 30 Records of Processing Activities obligations. Canadian organizations under PIPEDA can present access logs to demonstrate accountability under Principle 1.
---
About Lets Viz: Lets Viz has delivered Power BI, Looker Studio, and Zoho Analytics solutions to healthcare organizations, UK fintech firms, Canadian manufacturers, and global SaaS businesses since 2020. Our implementations span HIPAA-regulated US hospital systems, GDPR-aligned UK clients, and PIPEDA-compliant Canadian organizations. Lets Viz holds a 5.0 rating on Clutch across verified client engagements.
Ready to move from EHR exports to governed, multi-site Power BI dashboards? Explore our Managed Power BI for healthcare teams service to see how we design the data model, RLS, and rollout sequence for health systems in the US, UK, and Canada.