DAX SWITCH Function: Healthcare KPI Reporting Examples
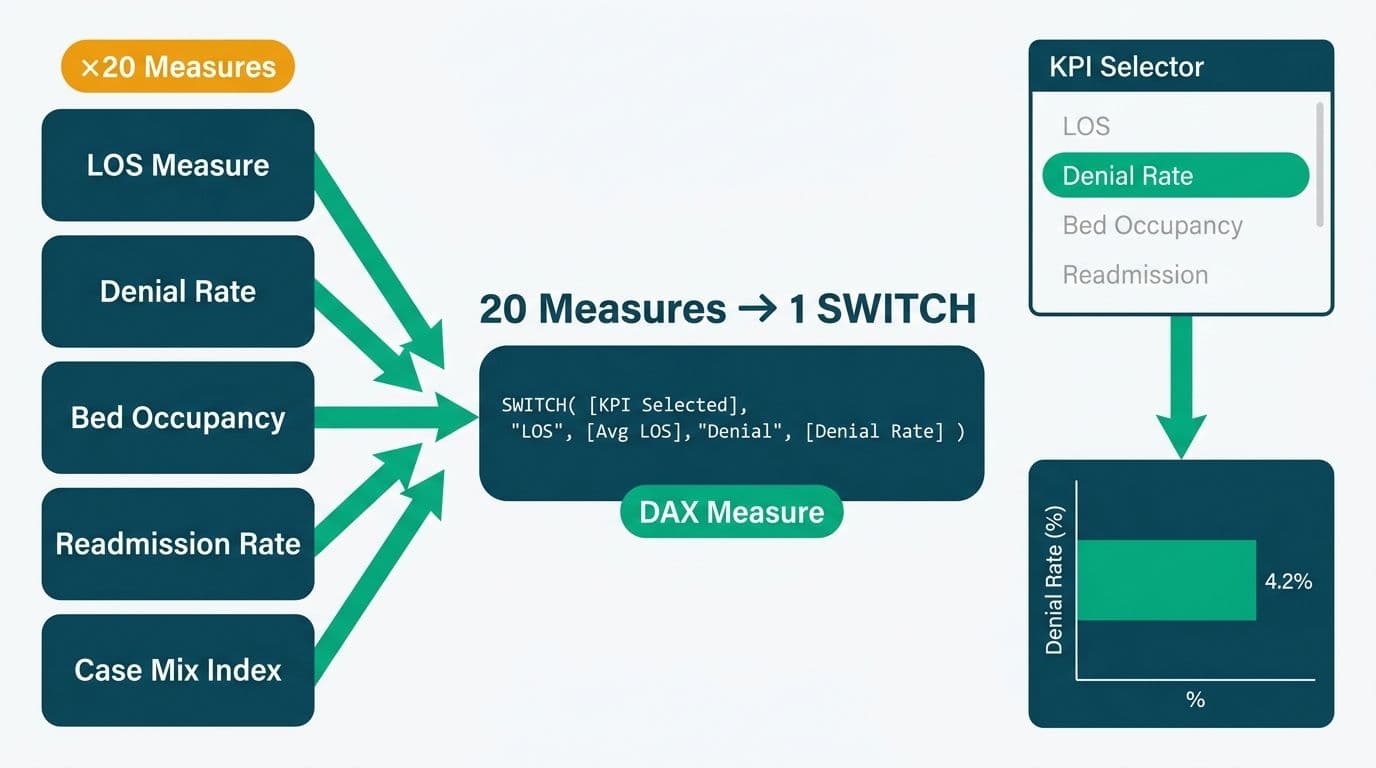
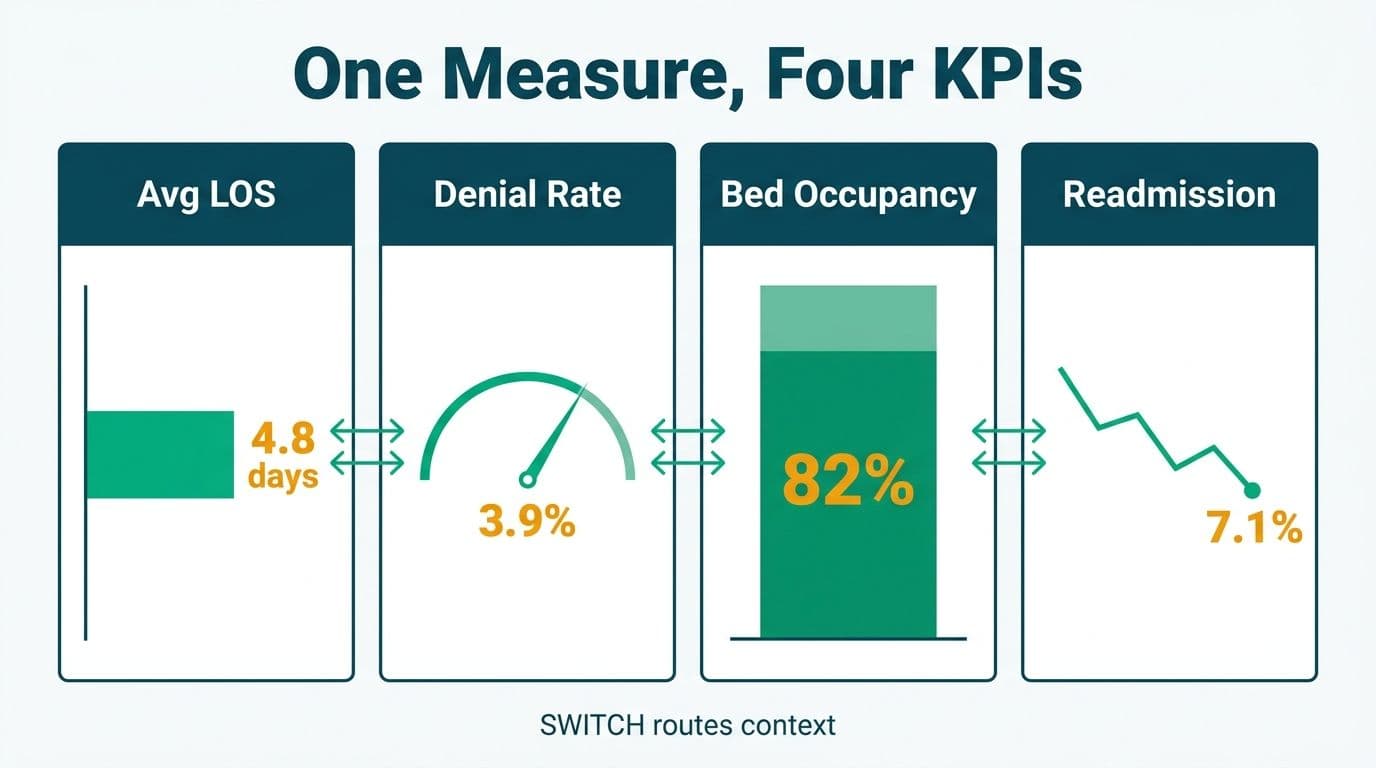
A single DAX SWITCH measure lets healthcare analysts consolidate length of stay (LOS), denial rate, bed occupancy, and readmission rate into one dynamic metric that responds to a slicer selection. Instead of maintaining dozens of separate measures, the pattern uses a disconnected parameter table to drive context-switching, reducing model complexity and making HIPAA-compliant reports far easier to govern and audit.
Key Takeaways
- One DAX SWITCH measure can replace 20 or more individual KPI measures in a healthcare Power BI model.
- A disconnected parameter table drives KPI selection without contaminating existing filter context.
- The same pattern covers LOS, denial rate, bed occupancy, readmission rate, and any future KPI you add.
- Row-level security and audit logging remain intact because SWITCH operates entirely within the measure layer.
- Teams under HIPAA (US), GDPR (UK/EU), or PIPEDA (Canada) can apply the pattern without altering PHI access controls.
What Is the DAX SWITCH Function and Why Does Healthcare Reporting Need It?
SWITCH evaluates an expression against a list of values and returns the corresponding result - much like a lookup table embedded directly in your measure. In healthcare reporting, operations teams track a dozen or more KPIs simultaneously: average length of stay, claim denial rates, bed occupancy percentages, 30-day readmission rates, and more. Without SWITCH, each KPI becomes its own measure, and a dashboard tracking eight KPIs across three service lines can accumulate 40 or more measures - all of which must be updated whenever a business rule changes.
The DAX SWITCH pattern collapses that surface area dramatically. One measure reads the user's slicer selection, branches to the correct calculation, and returns the result. The model stays lean, the report file stays small, and a single version-controlled change covers a rule update that previously required touching a dozen measures.
Healthcare organizations collecting data from EHR systems, claims platforms, bed management tools, and patient satisfaction surveys often find their Power BI semantic models growing faster than they can govern. A model that started with five KPIs in year one routinely reaches 50-plus measures two years later as new service lines, payer contracts, and value-based care programs generate new reporting requirements. The SWITCH pattern imposes structure before that growth becomes unmanageable.
For healthcare analytics teams running Managed Power BI for healthcare teams environments, this translates directly to lower maintenance overhead and faster turnaround on regulatory reporting cycles.
How Do You Build a DAX SWITCH Measure for Healthcare KPIs?
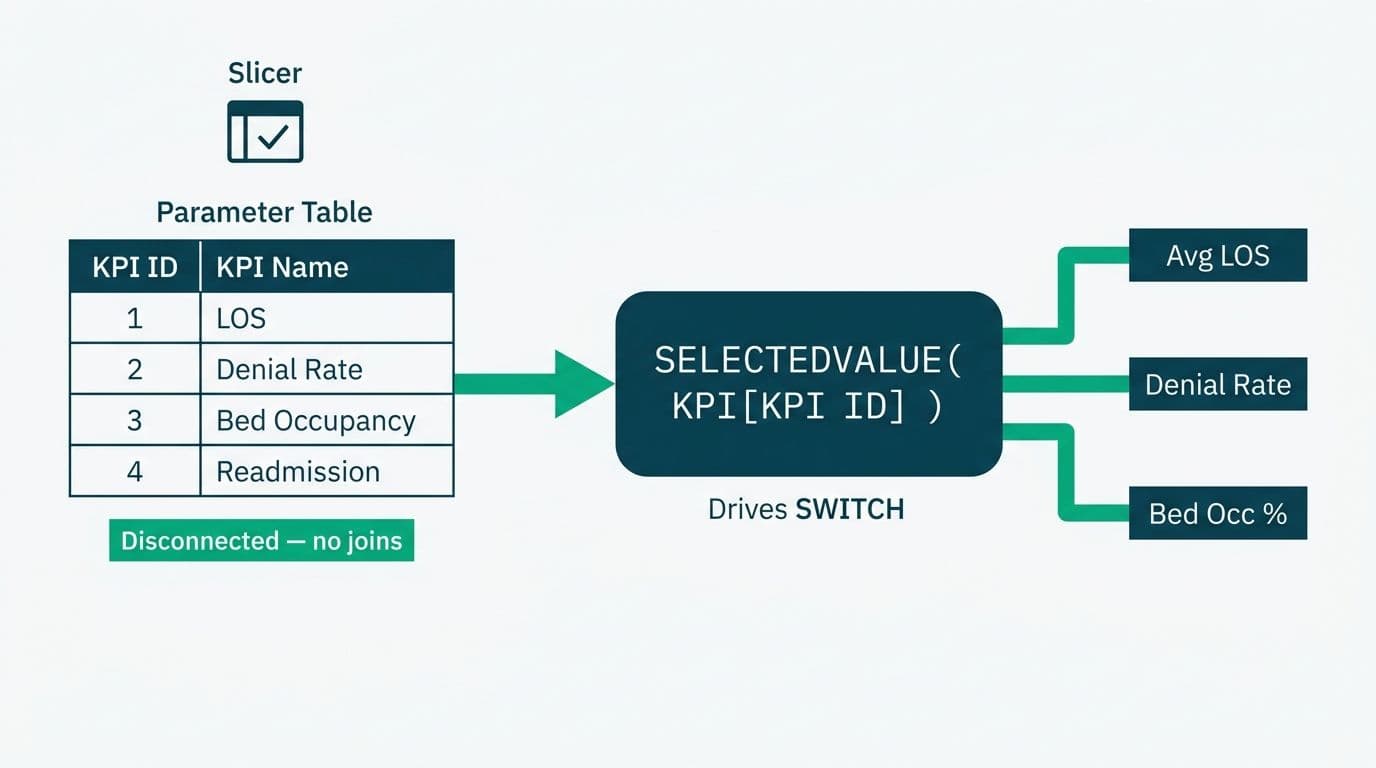
The pattern has three components: a parameter table, a slicer, and the SWITCH measure itself.
Step 1 - Create a Disconnected Parameter Table
In Power BI Desktop, create a new calculated table with no relationship to any fact table. Two columns are sufficient: a display label and an integer key.
```dax
KPI_Selector =
DATATABLE(
"KPI Name", STRING,
"KPI Key", INTEGER,
{
{"Length of Stay (Avg Days)", 1},
{"Denial Rate (%)", 2},
{"Bed Occupancy (%)", 3},
{"30-Day Readmission Rate (%)", 4}
}
)
```
Place a slicer on the report page bound to the KPI Name column. Because this table has no relationship to the fact table, selecting a value does not alter any existing filters on the data - it only changes what the SWITCH measure returns.
Step 2 - Write the SWITCH Measure
```dax
Selected KPI Value =
VAR _selection =
SELECTEDVALUE( KPI_Selector[KPI Key], 0 )
RETURN
SWITCH(
_selection,
1, [Avg Length of Stay],
2, [Denial Rate],
3, [Bed Occupancy Pct],
4, [Readmission Rate 30D],
BLANK()
)
```
SELECTEDVALUE safely returns the default value (0 here) when nothing is selected or when the slicer is in multi-select mode with more than one value active - preventing misleading totals from appearing on the canvas. The trailing BLANK() is the else-branch; always include it to avoid silent errors when an unexpected key value reaches the measure.
Step 3 - Add a Dynamic Title Measure
A report title that reads "Denial Rate - Q3 2026" is far more useful than a static label. A second measure handles this:
```dax
KPI Title =
SELECTEDVALUE( KPI_Selector[KPI Name], "Select a KPI" )
```
Bind this to a card visual and the title updates automatically as the slicer changes - eliminating dozens of manual title edits during iterative report builds, which healthcare IT teams revise frequently during accreditation cycles with bodies such as the Joint Commission in the US or the Care Quality Commission in the UK.
DAX SWITCH Healthcare Reporting Examples: LOS, Denial Rate, Bed Occupancy, and Readmission
Each KPI referenced inside the SWITCH measure is defined as its own base measure first. SWITCH is the router, not the calculator. Here are the four base measures for a typical acute-care hospital data model, along with notes on how each applies across the US, UK, and Canada.
Length of Stay
```dax
Avg Length of Stay =
DIVIDE(
SUMX(
Encounters,
DATEDIFF( Encounters[Admit Date], Encounters[Discharge Date], DAY )
),
COUNTROWS( Encounters )
)
```
LOS is measured in days and is a core efficiency metric for hospitals across all three markets. NHS trusts in the UK and Canadian provincial health authorities use the same formula structure - only source table names and date column conventions differ. For regulatory submissions (CMS in the US, NHS Digital in England, CIHI in Canada), verify whether same-day discharges should be excluded per the submission specification.
Denial Rate
```dax
Denial Rate =
DIVIDE(
CALCULATE( COUNTROWS( Claims ), Claims[Status] = "Denied" ),
COUNTROWS( Claims ),
0
)
```
Denial rate is a top-tier metric in any healthcare revenue cycle analytics dashboard. Keeping it as a standalone base measure means your revenue cycle team can surface it in payer-specific reports without pulling in the full SWITCH context - a separation that also simplifies audit trails under HIPAA.
Bed Occupancy
```dax
Bed Occupancy Pct =
DIVIDE(
SUM( DailyOccupancy[Occupied Beds] ),
SUM( DailyOccupancy[Total Beds] ),
0
)
```
A US health system might track bed occupancy daily at the unit level; an NHS trust in England or a Canadian regional health authority might aggregate it weekly for board-level reporting. The DAX is identical in both cases - date granularity is controlled by the report's date slicer, not the measure itself.
30-Day Readmission Rate
```dax
Readmission Rate 30D =
DIVIDE(
CALCULATE(
COUNTROWS( Encounters ),
Encounters[Is Readmission 30D] = TRUE()
),
CALCULATE(
COUNTROWS( Encounters ),
Encounters[Encounter Type] = "Inpatient"
),
0
)
```
Readmission rate is a CMS core quality measure for US hospitals and a standard indicator in NHS England's outcomes framework. Under PIPEDA in Canada, any patient-level flag such as `Is_Readmission_30D` must be derived from de-identified or appropriately consented records before the dataset reaches Power BI. The SWITCH pattern does not alter that requirement, but it does simplify the audit trail because all PHI-adjacent logic is concentrated in a small set of named base measures.
Extending the pattern to a fifth or sixth KPI requires two steps: add a new row to the KPI_Selector table and add one new branch to the SWITCH measure. Common extensions include average patient satisfaction score (HCAHPS percentile rank), emergency department door-to-provider time, and operating room utilization rate.
KPI Comparison: Base Measure Anatomy at a Glance
| KPI | Numerator | Denominator | Typical Granularity |
|---|---|---|---|
| Length of Stay | Sum of (Discharge - Admit) in days | Count of encounters | Per encounter, by unit or DRG |
| Denial Rate | Count of denied claims | Count of all submitted claims | Per payer, per month |
| Bed Occupancy | Sum of occupied beds per day | Sum of available beds per day | Per unit, per day |
| 30-Day Readmission | Count of readmits within 30 days of discharge | Count of qualifying inpatient discharges | Per DRG, per quarter |
This reference is useful when scoping a new reporting environment. The Power BI Healthcare Reporting: Implementation Cost Guide covers typical project sizing for models ranging from four to twenty-plus KPIs across multiple source systems.
When Should You Use SWITCH vs. IF in a Healthcare Dashboard?
Use SWITCH when you have three or more branches. Reserve IF for binary logic. The practical concern in healthcare analytics is what happens when requirements scale: a nested IF chain for four KPIs is readable, but the same pattern at eight or more KPIs - common in an ACO shared savings performance analytics dashboard tracking quality, utilization, and cost measures simultaneously - becomes difficult to maintain and harder to review in version-controlled .pbix files.
A four-branch nested IF for reference:
```dax
/* Avoid this for 3 or more KPIs - use SWITCH instead */
KPI Nested IF =
IF( _selection = 1, [Avg Length of Stay],
IF( _selection = 2, [Denial Rate],
IF( _selection = 3, [Bed Occupancy Pct],
IF( _selection = 4, [Readmission Rate 30D], BLANK() )
)
)
)
```
DAX evaluates nested IF chains sequentially from the outermost condition inward. At four branches the performance difference is negligible. At eight or more branches, SWITCH is meaningfully faster because the engine can apply more efficient evaluation strategies across the expression tree.
A related pattern, SWITCH(TRUE(), ...), handles range-based conditions rather than exact-value matching - for example, classifying LOS into bands (under 3 days, 3-7 days, over 7 days). For KPI toggling driven by slicer selection, the integer-key pattern shown above is simpler and performs better.
The practical rule: if you will ever add another KPI - and in healthcare analytics, requirements only grow - start with SWITCH. Extending the measure is one new line. Extending a nested IF chain requires careful re-indentation and introduces merge-conflict risk in files shared across a reporting team.
What Governance and Compliance Considerations Apply to Healthcare Power BI Models?
The SWITCH pattern is governance-neutral on its own - it does not move data, alter row-level security, or change any access controls. What compliance teams need to verify is the layer beneath it.
HIPAA (US healthcare): Confirm that base measures do not expose protected health information (PHI) at a grain where a small cell count could re-identify a patient. The standard safeguard is to suppress cell values derived from fewer than 11 records - a threshold implemented in each base measure, not in the SWITCH router.
GDPR (UK and EU): NHS England and EU health systems using Power BI must ensure personal data used to derive KPIs is processed under a valid legal basis and documented in a Data Protection Impact Assessment (DPIA). The SWITCH pattern simplifies DPIA documentation because all calculation logic is traceable to a small set of named base measures rather than scattered across anonymous ad-hoc fields.
PIPEDA (Canada): Health authorities subject to PIPEDA must ensure aggregate reports cannot be reverse-engineered to individual patient records. The control point is the base measure definition and the row-level security model - SWITCH adds no risk and removes no protection.
Our guide on ServiceNow ITSM for Healthcare IT Teams: HIPAA, GDPR & PIPEDA covers how these three regulatory frameworks compare across jurisdictions for healthcare IT teams managing multi-region reporting environments.
For model-level governance, the Power BI Governance Best Practices: 12-Point Checklist is a recommended companion when rolling out a shared SWITCH pattern to multiple report authors.
How Does a Managed Analytics Service Deploy This Pattern at Scale?
A managed analytics service for healthcare providers typically delivers the SWITCH KPI pattern in three phases.
Phase 1 - Measure audit: Catalog every measure in the existing .pbix file. Models with 40-plus measures are common after two or three years of organic report growth. The audit identifies duplicates, deprecated fields, and candidates for consolidation under a SWITCH router.
Phase 2 - Base measure validation: Refactor each KPI into a standalone, testable base measure. Validation tools such as Tabular Editor's Best Practice Analyzer flag common DAX anti-patterns before a measure reaches production - a step that is especially valuable in healthcare, where a miscalculated denial rate or an incorrect LOS figure can affect payer contract negotiations and operational staffing decisions.
Phase 3 - Parameter table deployment: Add the disconnected KPI_Selector table, the SWITCH measure, and the dynamic title measure. Report pages are updated to reference the single SWITCH output instead of individual KPI columns. In teams using the PBIP (Power BI Projects) file format for version control, the entire change appears as a single, reviewable diff - a marked improvement over the 20-plus-diff change set that an equivalent update across individual measures would generate.
Structurally, this pattern replaces N KPIs multiplied by M report scenarios of individual measures with N base measures plus one SWITCH router. The measure-count reduction is a direct function of the arithmetic. For teams evaluating whether to build this capability in-house or engage a managed service, the Power BI Healthcare Reporting: Implementation Cost Guide breaks down the typical cost components for each approach.
---
About Lets Viz: Lets Viz has delivered managed analytics and Power BI implementations for US healthcare networks, UK fintech firms, Canadian manufacturing organizations, and global SaaS teams since 2020. The practice holds a 5.0 rating on Clutch and specialises in HIPAA-compliant data models, GDPR-ready reporting architectures, and DAX performance engineering for regulated industries.
Ready to consolidate your healthcare KPI layer and reduce report maintenance overhead? Explore what a dedicated team can build for your environment through Managed Power BI for healthcare teams.