Power BI for Healthcare Payer Analytics: A Practical Guide
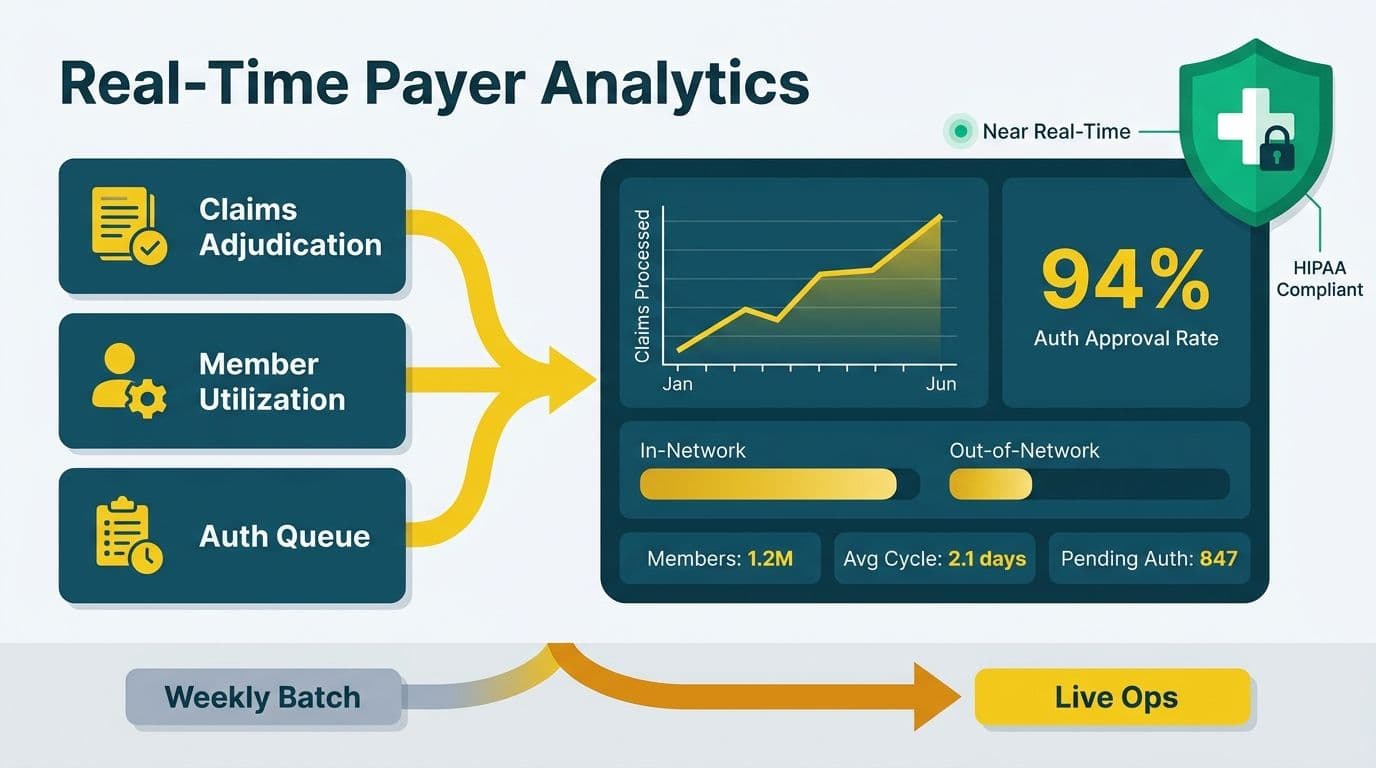
Health insurers and managed care organisations use Power BI for healthcare payer analytics to consolidate claims adjudication data, member utilisation feeds, and prior-authorisation queues into a single governed workspace. Row-level security and Azure AD integration deliver HIPAA-compliant access controls for US payers, with the same architecture satisfying GDPR and PIPEDA requirements for UK NHS bodies and Canadian provincial health plans. Most payer analytics teams move from weekly batch reports to near-real-time operational dashboards within weeks of deployment.
Key Takeaways
Power BI connects directly to payer adjudication systems, eligibility databases, and utilisation feeds, enabling near-real-time dashboard refresh without a separate data warehouse.
HIPAA-aligned security - row-level security, sensitivity labels, and audit logs - is configurable in Power BI Premium without custom development.
Claims denial rate, prior-auth cycle time, and medical loss ratio are the three KPIs payer analytics teams instrument first.
Canadian payers under PIPEDA and UK NHS commissioning groups under GDPR can apply the same Power BI architecture with minimal regional configuration changes.
A managed Power BI service reduces time-to-insight from months to weeks by supplying pre-built healthcare data models and governance guardrails from day one.
What Is Power BI for Healthcare Payer Analytics?
Power BI for healthcare payer analytics is the practice of connecting Microsoft Power BI to the operational data systems that health insurers, managed care organisations (MCOs), and third-party administrators (TPAs) run day-to-day. These systems include claims adjudication engines such as TriZetto Facets or QNXT, eligibility and enrolment databases, pharmacy benefit manager (PBM) feeds, utilisation management platforms, and provider network directories.
The result is a unified analytics layer where a Vice President of Claims can track adjudication turnaround in the same workspace where a Chief Medical Officer monitors high-cost utilisation outliers and a compliance officer reviews HIPAA audit trails.
Managed Power BI for healthcare teams extends the platform's native capabilities with pre-built payer data models, HIPAA-aligned workspace configuration, and ongoing report management - removing the analytical burden from already-stretched internal IT departments. For organisations already invested in Microsoft 365 or Azure, Power BI reuses existing identity management, compliance policies, and storage infrastructure without requiring a separate vendor relationship.
Teams managing healthcare KPI dashboards across departments find that Power BI's pre-built connectors and semantic model framework compress the dashboard build phase significantly compared to custom development - an important consideration when analytics capacity is limited and reporting deadlines are fixed.
How Do Payers Use Power BI to Monitor Claims Adjudication Rates?
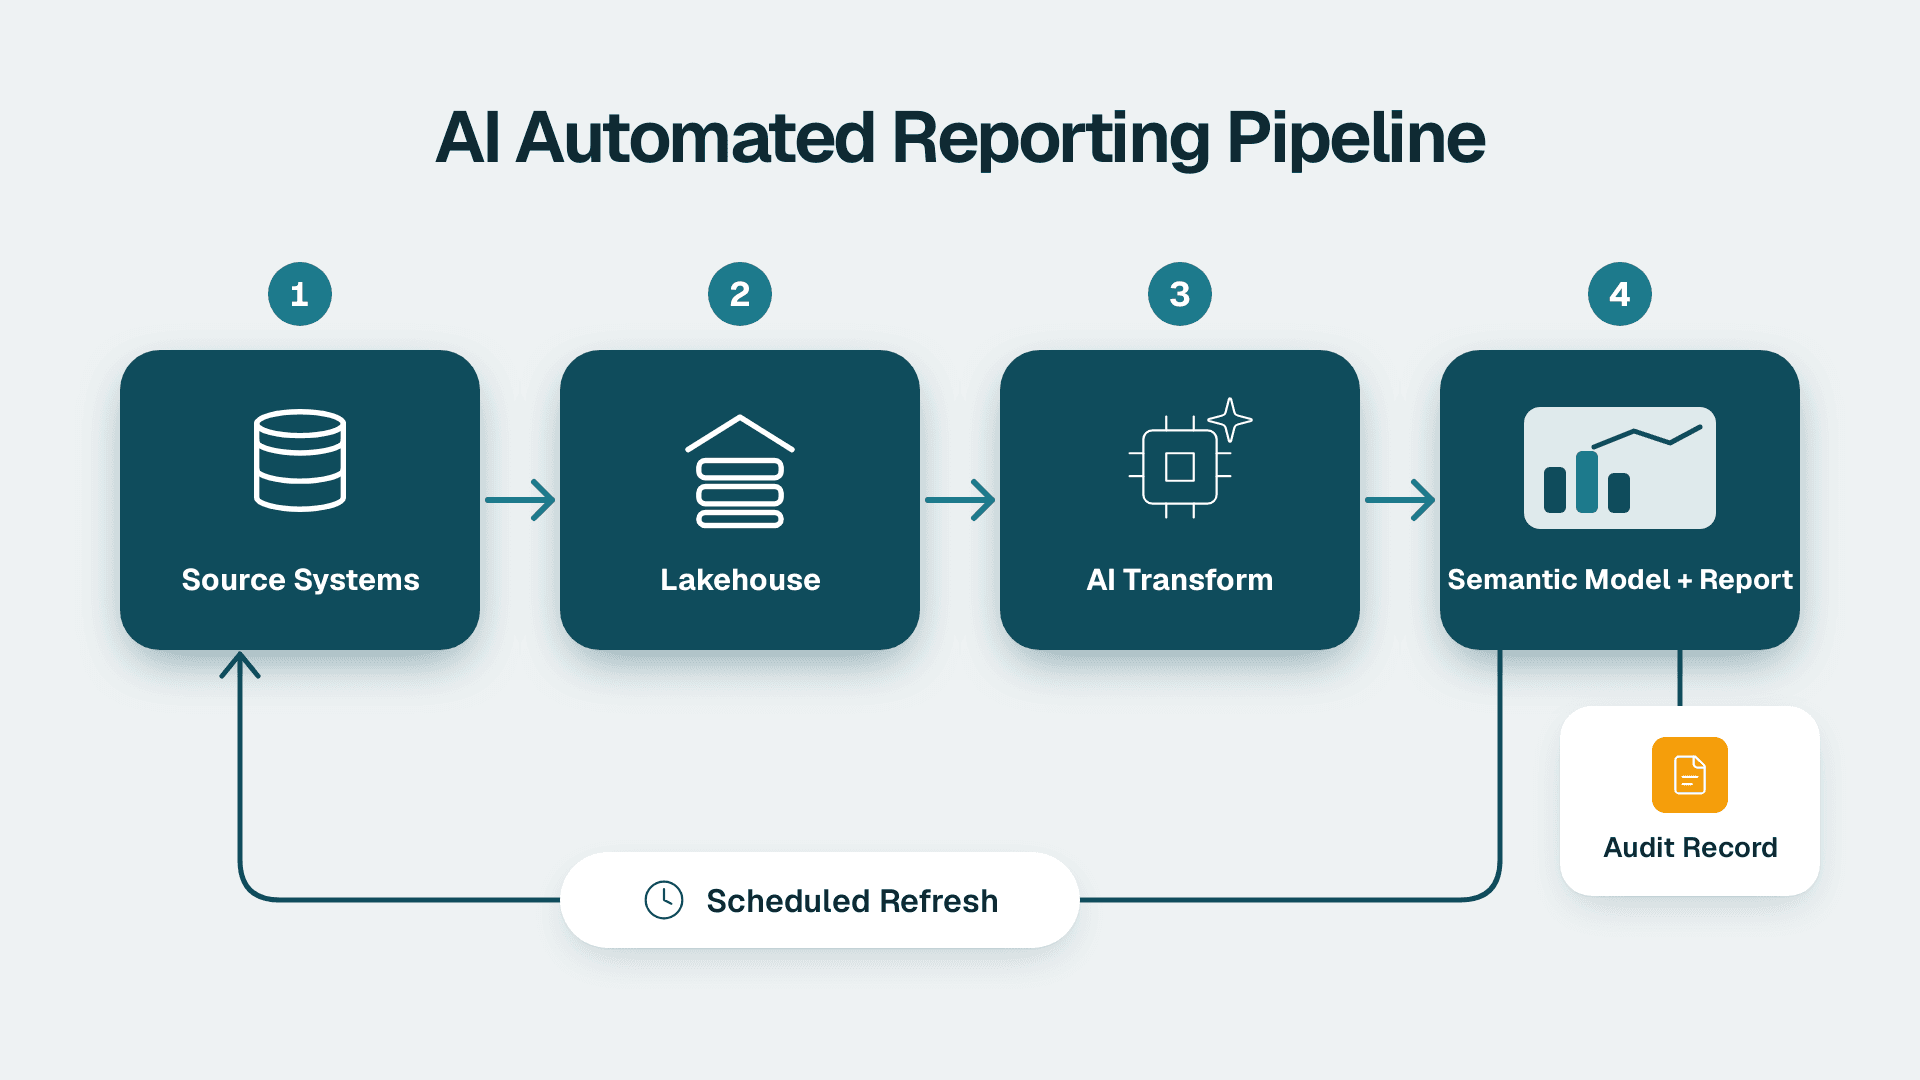
Claims adjudication rate - the percentage of submitted claims processed within a defined window - is the operational heartbeat of any health plan. A US Medicare Advantage plan is contractually required to process 95% of clean claims within 30 days. Power BI surfaces this metric in near-real-time by pulling data from the adjudication engine via DirectQuery or scheduled refresh, flagging emerging backlogs before they breach regulatory thresholds.
A typical claims analytics dashboard for a US regional health plan managing 500,000 member lives includes:
Adjudication rate by payer type (commercial, Medicare, Medicaid, CHIP)
Denial rate by reason code (CO-4, CO-11, CO-22, PR-1)
Average days to adjudication trended over 90 rolling days
Pending claims ageing buckets (0-10, 11-20, 21-30, 30+ days)
First-pass resolution rate - the share of claims requiring no re-adjudication
Remittance variance - the gap between billed, allowed, and paid amounts by provider group
Row-level security (RLS) restricts claims analysts to their assigned provider groups or product lines - a HIPAA administrative safeguard requirement that Power BI handles natively through DAX filter expressions. A large US commercial insurer can configure RLS so that a claims examiner in one region cannot access member-level data from a different region's book of business, satisfying HIPAA's minimum-necessary standard and internal segregation-of-duty policies simultaneously.
For teams building the DAX filter expressions that power RLS-aware KPI calculations, the ALLSELECTED DAX function guide covers the filter-context mechanics that underpin accurate cross-filter calculations in these multi-region payer environments.
How Does Power BI Help Payers Track Member Utilisation Trends?
Member utilisation analytics answers the question health plans care most about: which services are members consuming, at what frequency, and at what cost relative to premium? Power BI lets payers build utilisation dashboards that slice data by member cohort, diagnosis category (ICD-10), network tier, and geography - all within a single workspace accessible to actuarial, medical management, and network teams simultaneously.
Through mid-2026, three themes are dominating healthcare analytics investment decisions across US, UK, and Canadian payer markets: value-based care adoption, AI-driven analytics, and payer analytics platform consolidation - with consolidation accelerating as payers migrate from point solutions to unified semantic model architectures (as of 2026). Power BI sits at the intersection of all three - it can ingest risk-adjusted cost data from value-based contracts, surface AI-generated outlier flags through Azure OpenAI integration, and present results to clinical leadership without manual exports to static reports.
A member utilisation dashboard in Power BI for a US or Canadian health plan typically tracks:
| Metric | Primary Source | Refresh Cadence |
|---|---|---|
| Inpatient admissions per 1,000 members | Claims / ADT feed | Daily |
| Emergency department visit rate | Claims | Daily |
| 30-day hospital readmission rate | Claims + discharge data | Weekly |
| Generic dispensing rate (GDR) | PBM feed | Weekly |
| High-cost claimant flag (top 5% spend) | Claims + risk scores | Monthly |
| HEDIS measure compliance rate | Claims + lab results | Monthly |
| Out-of-network utilisation rate | Claims | Weekly |
A Canadian provincial health benefits administrator can deploy this dashboard with Power BI Premium capacity routed to a Canada Central or Canada East Azure region, satisfying PIPEDA data residency requirements without additional tooling. A UK NHS integrated care system (ICS) ingesting Secondary Uses Service (SUS+) population data applies GDPR pseudonymisation at the Power Query transformation stage before any data reaches the semantic model layer.
For a deeper look at how AI-augmented analytics extend these dashboards, the AI analytics use cases in healthcare finance guide covers the integration patterns most commonly deployed by payer analytics teams.
How Can Power BI Reduce Prior-Authorisation Bottlenecks?
Prior-authorisation (PA) delays are among the most operationally costly friction points in US managed care - and among the most tractable with real-time analytics. CMS rules effective in early 2026 require Medicare Advantage plans to respond to standard PA requests within 7 calendar days and urgent requests within 72 hours; plans that miss these windows face civil monetary penalties and, for persistent non-compliance, potential contract termination - making real-time queue visibility a compliance imperative rather than a reporting nicety. Power BI gives PA operations managers live visibility into queue depth, clinical reviewer workload, and cycle time by service category - making it possible to identify growing backlogs before a regulatory threshold is breached.
A prior-auth analytics dashboard built in Power BI typically tracks the following:
PA request volume by clinical category (musculoskeletal, oncology, specialty pharma, imaging, durable medical equipment)
Average cycle time by request type (standard vs. expedited, first-level vs. peer-to-peer review)
Pend rate - the share of requests returned for additional clinical documentation
Denial rate segmented by clinical reviewer and ICD-10 service category
CMS turnaround compliance rate - the percentage of requests resolved within regulatory windows
Backlog ageing - open requests segmented by days outstanding
By connecting a PA platform to Power BI via REST API or database connector, a US MCO can configure automated alerts that fire when a clinical category's average cycle time approaches the contractual limit. This shifts PA management from reactive - reviewing last week's breach report - to proactive, redirecting reviewer capacity on day two of a growing imaging backlog rather than day ten.
The same architecture applies to a UK private medical insurer managing pre-authorisation commitments under the Association of British Insurers (ABI) code of practice, or a Canadian health benefits administrator managing PA queues under provincial drug benefit programme rules.
Power BI Payer Analytics: US, UK, and Canada Compared
The core Power BI deployment architecture for payer analytics is consistent across markets, but regulatory context, data source formats, and compliance obligations differ in ways that shape workspace configuration decisions from the outset.
| Dimension | US Health Plan | UK NHS / Private Insurer | Canadian Health Plan |
|---|---|---|---|
| Primary regulation | HIPAA (PHI protection) | GDPR + CQC standards | PIPEDA + provincial health acts |
| Claims data format | EDI 837 / TriZetto / QNXT | HES / SUS+ / insurer adjudication | Provincial adjudication files |
| Key operational KPIs | MLR, denial rate, PA cycle time | RTT wait times, IAPT outcomes | Drug plan spend, benefit utilisation |
| Azure data residency | East US / West US | UK South / UK West | Canada Central / Canada East |
| Anonymisation standard | HIPAA Safe Harbour | GDPR pseudonymisation | De-identification per PHIPA |
| Identity provider | Azure Entra ID | NHS Digital Identity / Entra ID | Azure Entra ID |
US Medicare Advantage and commercial plans must configure HIPAA-aligned workspaces - sensitivity labels, audit log retention, and row-level security - before any protected health information (PHI) enters the Power BI environment. UK ICS bodies connecting SUS+ population data should apply GDPR pseudonymisation in Power Query prior to loading. Canadian benefits administrators must confirm that Azure Canada regions are selected in Power BI Premium capacity settings to meet PIPEDA data residency obligations.
Teams preparing a compliant multi-region deployment often use the AI analytics data privacy risks healthcare audit guide to structure their pre-deployment compliance checklist before any PHI is ingested.
How Do Power BI and Tableau Compare for NHS and UK Private Healthcare Buyers?
For NHS trusts, integrated care boards (ICBs), and private medical insurers evaluating tableau vs power bi for NHS healthcare analytics, three compliance obligations govern the shortlisting decision before cost or feature considerations enter the picture: DSP Toolkit alignment, NHS FHIR UK Core interoperability, and UK GDPR data residency.
DSP Toolkit obligations. The NHS Data Security and Protection (DSP) Toolkit requires all health and care organisations handling NHS patient data to complete an annual self-assessment against the National Data Guardian's ten data security standards. For Power BI deployments, Microsoft Purview's built-in audit log exports, sensitivity labels, and access review workflows directly address the evidence requirements under Standard 7 (personal confidential data handling) and Standard 9 (supportive leadership) without additional tooling or custom configuration. Achieving the same audit trail with Tableau requires custom log forwarding from Tableau Server or Tableau Cloud to a SIEM before assessors can review equivalent evidence. NHS organisations already operating Microsoft 365 E5 compliance licences gain the DSP Toolkit evidence layer with no incremental licence cost, since Purview audit capabilities are included in that tier.
NHS FHIR UK Core interoperability. NHS England's FHIR UK Core (R4) is the national implementation guide for HL7 FHIR R4 in England, underpinning GP Connect, NHS Spine interactions, and shared care record platforms. Power BI ingests FHIR R4 REST endpoints directly through Power Query's web connector, allowing ICBs and NHS trusts to pull referral records, patient demographics, and care plan data without a bespoke middleware layer. Tableau connects to the same endpoints via its REST API connector, but the transformation logic for FHIR resources - nested JSON bundles, coded value sets such as SNOMED CT and dm+d, and extension fields - must be built and maintained manually in Tableau Prep or upstream ETL tooling. For NHS analytics teams with limited data engineering capacity, Power BI's in-tool FHIR transformation path reduces delivery time on FHIR-sourced reporting projects and lowers the engineering maintenance burden when NHS England publishes FHIR UK Core updates.
UK GDPR and data residency. Both platforms support UK GDPR-compliant processing, but the implementation path differs. Power BI Premium capacity deployed to Microsoft's UK South or UK West Azure regions keeps all data within the UK geographic boundary, satisfying NHS Data Guardian guidance on data residency under standard Microsoft volume licensing and data processing agreement terms. Tableau Cloud processes data within Salesforce-operated infrastructure; NHS buyers should verify regional data residency options and review the Salesforce data processing addendum against their own data protection impact assessment (DPIA) before deployment. UK GDPR Article 28 requires a documented controller-processor agreement from both vendors regardless of platform - but the residency verification step adds procurement lead time for Tableau deployments that Power BI avoids through its native Azure UK region alignment.
Per-seat licensing at NHS scale. Per-seat cost differences become material at ICB or trust scale. Power BI Pro is listed at $10 per user per month (Microsoft pricing page, 2025), and is included within Microsoft 365 E5 licences that many NHS trusts hold through Crown Commercial Service (CCS) framework agreements - making the marginal Power BI licence cost effectively zero for organisations already on E5. Tableau Creator - the tier required for dashboard development and publishing - is listed at $75 per user per month, with Tableau Viewer at $15 per user per month for read-only access (Salesforce pricing page, 2025). For a mid-sized NHS ICB where multiple analysts need development-level access, the per-seat differential represents a substantial annual licence gap before infrastructure and managed support costs are factored in. Both platforms are available through the G-Cloud 13 procurement framework, which simplifies the commercial process for NHS buyers under public procurement rules.
Decision summary for NHS and UK private healthcare buyers.
| Factor | Power BI | Tableau |
|---|---|---|
| DSP Toolkit evidence (Std 7, 9) | Native via Microsoft Purview | Custom SIEM log forwarding required |
| NHS FHIR UK Core ingestion | Power Query REST connector, in-tool | REST connector + Tableau Prep ETL build |
| UK GDPR data residency | UK South / UK West Azure regions native | Salesforce infrastructure - verify DPIA |
| NHS Digital Identity | Native Entra ID integration | SAML/OIDC - additional IdP configuration |
| Pro/Creator per user/month (2025) | $10, or included in M365 E5 | $75 Creator / $15 Viewer |
| Procurement route | G-Cloud 13 (Microsoft) | G-Cloud 13 (Salesforce) |
For private UK medical insurers - where DSP Toolkit and FHIR UK Core obligations are less central than for NHS bodies - the decision more often turns on existing vendor relationships and visualisation flexibility preferences. For NHS trusts and ICBs where DSP Toolkit evidence trails, FHIR UK Core connectivity, and CCS-framework pricing are the primary evaluation criteria, Power BI's native alignment with NHS England's digital infrastructure makes it the lower-friction deployment path in the majority of cases.
What KPIs Should a Payer Analytics Dashboard Prioritise?
The most effective payer analytics dashboards in Power BI organise metrics across four operational domains: financial performance, clinical quality, operational efficiency, and network performance. Each domain maps to a distinct executive stakeholder and a distinct decision-making cadence.
Financial performance KPIs include medical loss ratio (MLR), cost per member per month (PMPM) by product line, and premium deficiency reserve (PDR) trends. These drive plan design decisions and actuarial reserve adjustments. A US commercial health plan targeting an 85% MLR benchmark uses Power BI to monitor monthly variance and project full-year exposure before the rate filing window closes.
Clinical quality KPIs include HEDIS measure performance (US), Referral-to-Treatment (RTT) wait time compliance (UK), and drug plan utilisation rates by therapeutic category (Canada). Power BI's integration with Azure Machine Learning enables predictive quality flags - identifying members at risk of missing preventive care targets before the HEDIS measurement year closes and corrective outreach becomes infeasible.
Operational efficiency KPIs include claims adjudication rate, first-pass resolution rate, PA cycle time, and member appeals rate. AI-powered anomaly detection modules embedded directly in Power BI payer dashboards surface outlier claim patterns automatically rather than waiting for manual audit cycles.
Network performance KPIs include out-of-network leakage rate, provider quality composite scores, and contract rate compliance. Power BI's filled map and shape map visuals are particularly effective for displaying network adequacy gaps by county or postal district - a metric that CMS, NHS England, and Canadian provincial regulators scrutinise closely during plan accreditation reviews.
When Should a Health Plan Invest in Managed Power BI Services?
Most health plans have internal BI capability - often a combination of legacy reporting tools, Excel-based actuarial models, and disconnected departmental dashboards. Three characteristics of payer analytics make a managed service more compelling than a purely internal build.
Data model complexity. Payer analytics requires joining claims (EDI 837/835), eligibility (EDI 834), pharmacy (NCPDP D.0), and clinical (HL7 FHIR) data in ways that general BI developers encounter infrequently. A pre-built, healthcare-specific Power BI data model compresses months of data engineering into weeks - for a typical 500,000-member plan, this means avoiding 14-18 weeks of data model development before the first governed dashboard goes live - and arrives with the business logic for denial rates, MLR, and HEDIS measures already validated against industry standards.
Regulatory velocity. CMS regulations, state insurance department requirements, and HIPAA guidance evolve continuously. A managed team that monitors these changes updates workspace governance configurations before the next audit cycle - not after a findings letter arrives. The same applies to a UK NHS trust updating GDPR data processing agreements after an ICS restructure, or a Canadian benefits administrator adapting to a provincial formulary change under PIPEDA.
Internal capacity constraints. Payer analytics teams are chronically understaffed. The sprint to build a CMS-compliant PA monitoring dashboard or a quarterly MLR reporting pack competes directly with core IT obligations. A managed Power BI service provides dedicated analytics capacity without the cost and lead time of a full-time senior hire.
For organisations evaluating their current analytics maturity before committing to a build approach, a free BI readiness assessment provides a structured view of the governance, data infrastructure, and capability gaps that determine how quickly a payer analytics deployment can go live and meet compliance requirements.
If your health plan is ready to replace static reports with a governed, HIPAA-compliant payer analytics environment, Managed Power BI for healthcare teams delivers pre-built payer data models, workspace governance, and ongoing report management for US, UK, and Canadian health organisations.
---
About Lets Viz: Lets Viz has delivered data analytics solutions for healthcare, fintech, manufacturing, and global SaaS clients since 2020, earning a 5.0 Clutch rating across engagements spanning US healthcare payer organisations under HIPAA, UK fintech firms under GDPR, Canadian manufacturing companies under PIPEDA, and global SaaS businesses. Our Power BI practice combines deep payer data model expertise with the governance rigour that regulated industries require.
---