LookML vs Power BI Data Modeling: BI Architect's Guide
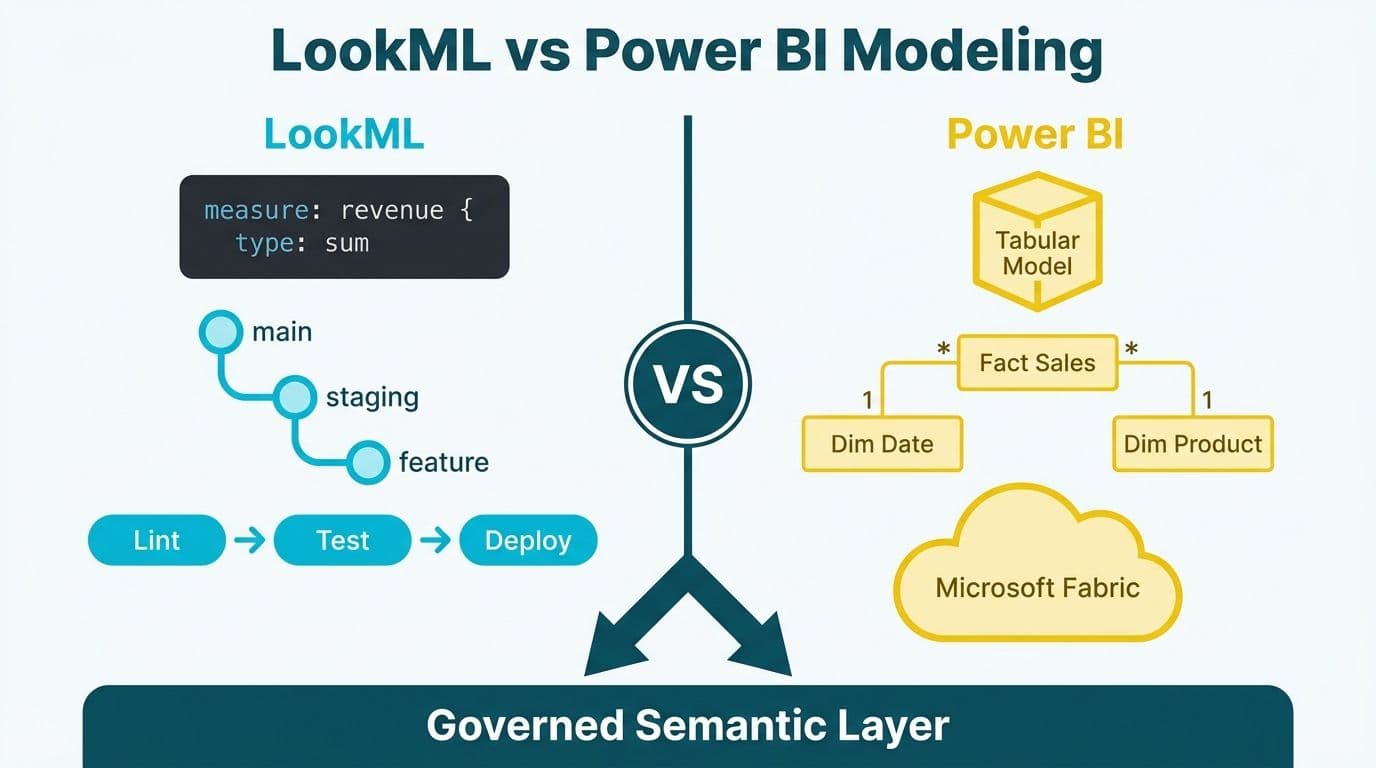
LookML and Power BI's tabular semantic model solve the same core problem - creating a governed, reusable business layer above raw data - but through opposing philosophies. LookML enforces governance through code and Git, while Power BI enforces it through the Tabular Object Model and, increasingly, Microsoft Fabric OneLake. The right choice for a BI architect depends on your team's Git fluency, existing cloud investment, and regulatory context.
Key Takeaways
- LookML defines metrics and dimensions as code files, enabling Git-based version control and CI/CD pipelines not natively available in Power BI's traditional tabular model.
- Power BI's tabular semantic model offers broader analyst adoption, richer DAX expressiveness, and deep Microsoft 365 ecosystem integration.
- Microsoft Fabric OneLake fundamentally changes Power BI's architecture by enabling Direct Lake mode against Delta Parquet storage, closing the data freshness gap with Looker's live-SQL approach.
- For regulated industries - HIPAA in the US, GDPR in Europe, and PIPEDA in Canada - both platforms support row-level security, but LookML's governance is enforced structurally while Power BI's requires deliberate configuration.
- Neither tool is universally superior: LookML wins on governance at enterprise scale; Power BI wins on time-to-insight for mid-market teams and Microsoft-first organizations.
What Is LookML vs Power BI Data Modeling?
LookML is Looker's proprietary modeling language - a YAML-like abstraction layer that defines how SQL tables relate, what metrics mean, and which users can see which fields. Power BI's equivalent is its tabular semantic model (built on the Analysis Services Tabular engine), a column-store in-memory database that stores measures in DAX, relationships as defined in the model, and security rules as RLS row filters.
Both tools sit between raw data and end-user dashboards, acting as a semantic layer that enforces consistent business definitions. A "monthly recurring revenue" metric defined once in LookML means the same thing in every Looker report built on top of it. The same principle applies to a Power BI measure in a certified shared dataset: any analyst who connects to that dataset inherits the approved definition.
The key architectural difference: LookML generates SQL on the fly and pushes execution to the source database (BigQuery, Snowflake, Redshift, or other supported warehouses). Power BI's tabular model traditionally imports data into a compressed in-memory VertiPaq store and refreshes on a schedule. This distinction drives differences in data freshness, cost, and suitability for use cases like power bi ehr integration healthcare analytics, where patient data may not be permitted to leave the source clinical system and refresh latency must be minimized.
If you are scoping a data modeling engagement and need to estimate build cost before committing to either platform, the Instant project cost calculator provides a structured starting point for both LookML and Power BI projects.
How Do LookML and Power BI Differ on Semantic Layer Governance?
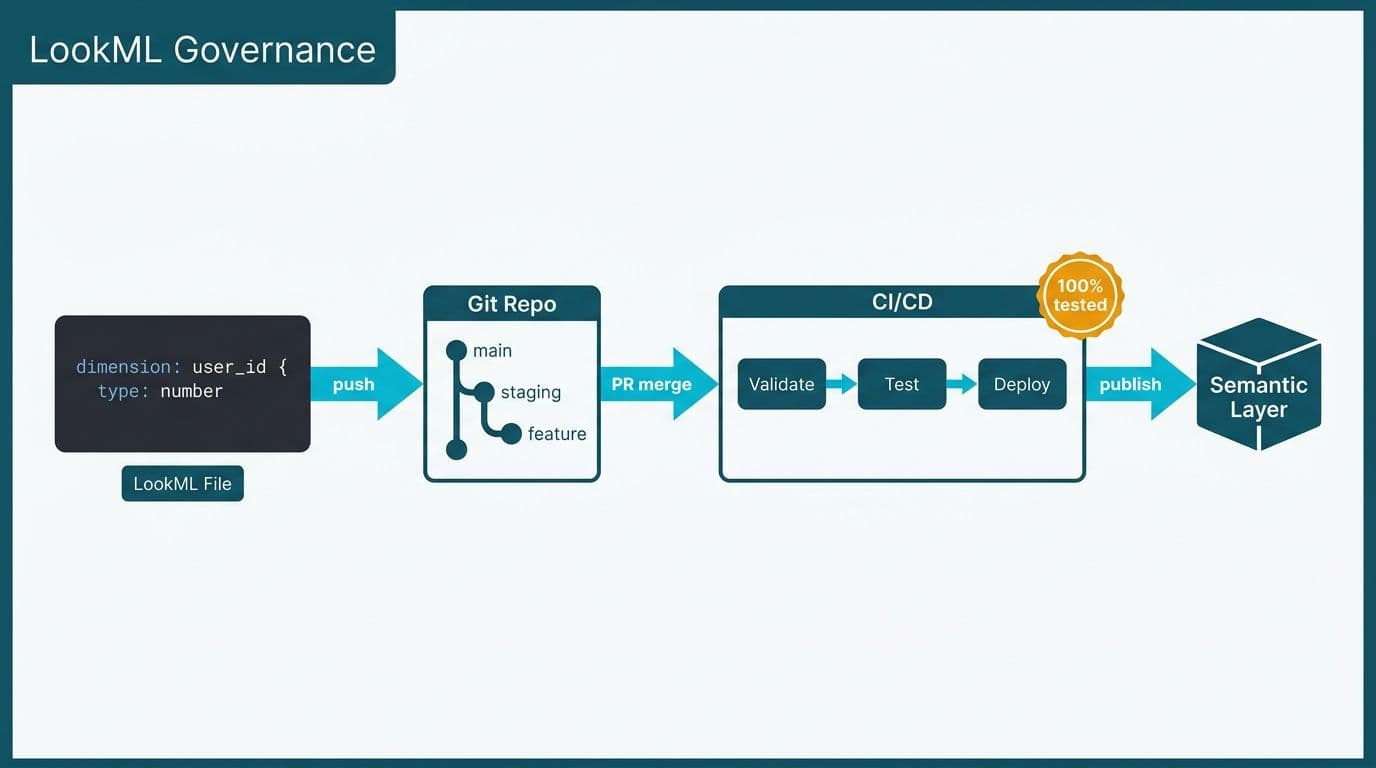
Governance is where the philosophical gap between the two tools is sharpest. LookML governance is structural by design: every dimension, measure, and explore lives in a `.lkml` file that must be committed to a Git repository before it can reach production. Adding a metric requires a pull request, a code review, and a merge - the same workflow a software engineering team uses for application code. There is no mechanism to create an ad hoc measure that bypasses this process.
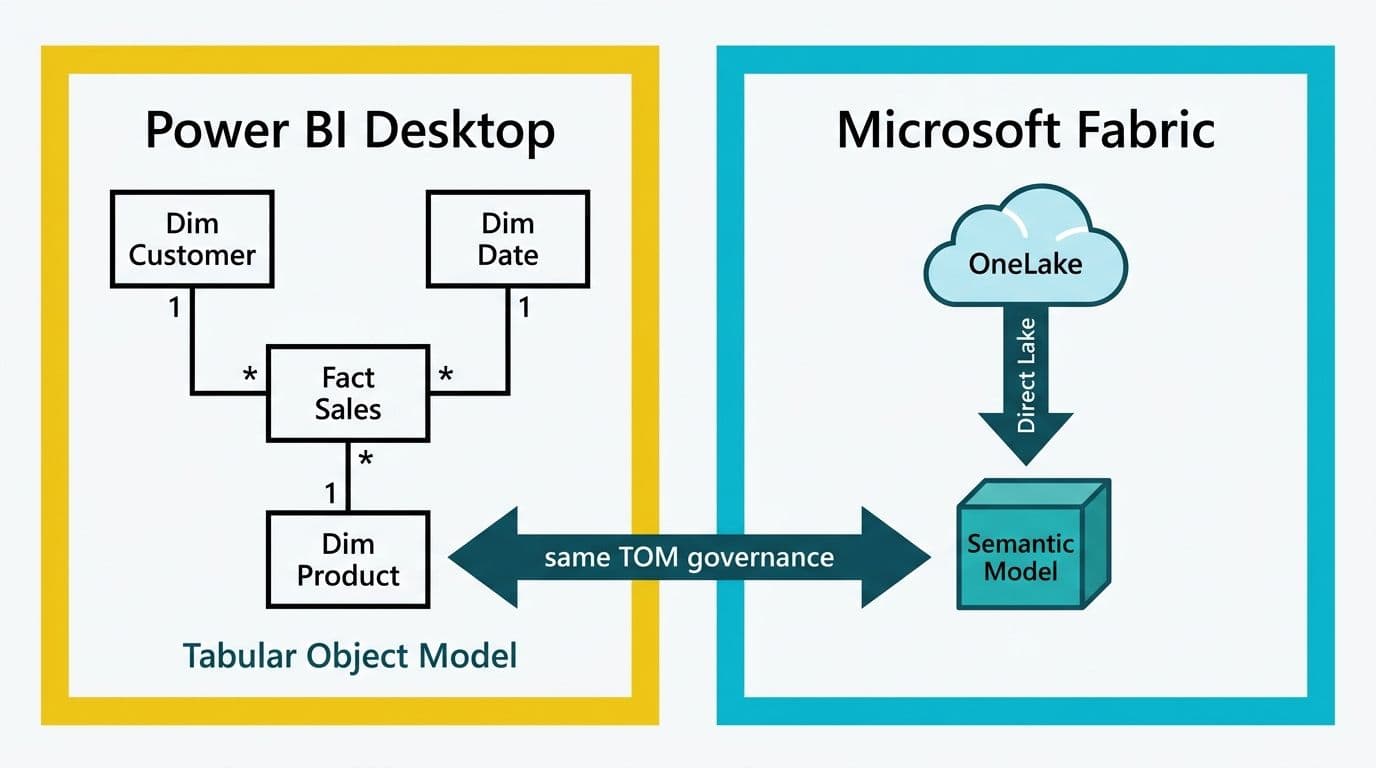
Power BI's governance model is more distributed. Certified datasets and Gen2 dataflows in the Power BI service enforce consistency at the organizational level, but analysts can still create calculated columns inside report-level DAX that never touch the shared certified model. The Power BI Tabular Object Model (TOM) exposes the entire schema programmatically - enabling governance automation through tools like Tabular Editor - but only if your team explicitly builds and maintains that automation pipeline.
For a US healthcare analytics team operating under HIPAA, this distinction is material. PHI field access controlled inside a LookML `access_filter` is version-controlled and auditable by default. The equivalent power bi row level security hipaa phi data protection implementation requires deliberate design, testing, and documentation to pass a compliance audit. Our guide on HIPAA compliant BI tools for hospital data visualization covers the Power BI RLS configuration process for healthcare data in detail.
A UK fintech firm subject to GDPR data minimization requirements faces a similar governance question: which tool makes it structurally harder to accidentally expose PII in a self-serve report? LookML's field-level tagging and `required_access_grants` provide a hard enforcement layer. Power BI's Object Level Security (OLS) for tabular models provides comparable field-level hiding, but configuration lives in the service rather than in version-controlled code.
How Does Version Control Work in LookML vs Power BI?
LookML version control is Git-native and non-optional. Looker connects directly to a hosted Git repository (GitHub, GitLab, or Bitbucket), and every model change is a commit. Development branches, pull requests, and rollback are standard operations familiar to any data engineer. This makes LookML a natural fit for teams already managing infrastructure as code with tools like Terraform or dbt.
Power BI has historically lagged on this front. `.pbix` files are binary blobs that produce meaningless diffs, making a meaningful Git history nearly impossible. Microsoft addressed this with the Power BI Projects (PBIP) file format, which serializes semantic models and report layouts as folders of human-readable JSON and TMDL (Tabular Model Definition Language) files (Microsoft documentation, 2025). PBIP enables proper Git workflows and pull-request reviews for Power BI development for the first time.
However, PBIP adoption requires active effort: teams must opt in at the project level, reconfigure CI/CD pipelines, and often rebuild existing binary reports in the new format. For a Canadian manufacturing company managing dozens of operational dashboards under PIPEDA audit requirements, that migration effort represents real project cost and should appear on any healthcare analytics platform evaluation checklist adapted for manufacturing or financial services contexts.
| Capability | LookML | Power BI (Tabular + PBIP) |
|---|---|---|
| Git-native version control | Native, always required | Optional (PBIP format, 2025) |
| CI/CD pipeline support | Looker CI, standard Git hooks | Azure DevOps, GitHub Actions |
| Branching and dev environments | Built-in developer mode | Deployment pipelines (Premium/Fabric) |
| Rollback | Git revert | Git revert (PBIP) or backup restore |
| Metric reuse across reports | Enforced (single LookML explore) | Certified shared datasets (optional) |
| Field-level access control | `required_access_grants` (code) | Object Level Security (service config) |
| Model testing | LookML tests, Spectacles | Tabular Editor BPA, DAX unit tests |
| Learning curve for data engineers | High (new language paradigm) | Moderate (DAX + familiar GUI) |
When Should You Choose LookML Over Power BI's Tabular Model?
Choose LookML when your organization runs analytics workloads on BigQuery, Snowflake, or Databricks and your data team is comfortable with Git, SQL, and code-review workflows. LookML's generated SQL runs natively on the warehouse, which means you pay for compute only when a query executes - there is no import refresh cost, and data is always current to the last write in the source system.
Choose LookML when governance at scale is non-negotiable. A large US SaaS company with 200 analysts across product, finance, and growth cannot allow each team to define "active user" differently in their own report. Centralizing that definition in a LookML explore means a single reviewed pull request propagates the change everywhere - a consistency that Power BI's certified datasets approximate but do not structurally enforce without additional tooling.
Choose Power BI when your organization is already committed to the Microsoft 365 ecosystem and your analyst population is Excel-fluent. DAX is verbose but extensively documented, and the time from a raw data model to a polished report in Power BI Desktop is typically shorter than the equivalent LookML-to-Looker Explore development cycle. Analysts transitioning from other platforms benefit from the transferable skill path outlined in our guide to learning Power BI from a Tableau background.
Choose Power BI when your data volumes fit comfortably in memory and import refresh latency is acceptable. The columnar compression in VertiPaq delivers sub-second query performance on hundreds of millions of rows on modest hardware. For a UK NHS trust running hospital workforce analytics where clinicians expect dashboards to load in under two seconds on a ward tablet, this storage-mode advantage is decisive. See our hospital workforce analytics dashboard guide for NHS, Canada, and US teams for architecture patterns that apply to both toolchains.
How Does Microsoft Fabric OneLake Change the Power BI Data Modeling Decision?
Microsoft Fabric OneLake, generally available since 2024, is the most architecturally significant change in Power BI's history. It replaces the traditional import-or-DirectQuery binary with Direct Lake mode - a connector that reads Delta Parquet files stored in OneLake directly into the VertiPaq engine without copying data into a separate in-memory store.
The practical implication: Power BI's tabular model can now query petabyte-scale Delta tables with near-import-mode performance, without the scheduled refresh windows that made large healthcare or financial datasets operationally painful. A US hospital system running Power BI against a Fabric Lakehouse gains data freshness that was previously only achievable through Looker's live-SQL architecture - narrowing one of LookML's most compelling architectural advantages.
From a governance standpoint, Fabric introduces OneLake data access roles and a unified workspace security model. For a Canadian manufacturer under PIPEDA, centralizing data access control in OneLake roles rather than maintaining parallel RLS rules across dozens of Power BI datasets reduces audit surface area and simplifies the annual compliance review cycle.
Power BI Fabric workspaces also gain access to Notebooks and Pipelines for model documentation and automated testing - moving the semantic model closer to the code-managed, reproducible workflow that LookML has always provided by default. The Fabric lakehouse architecture reference design guide covers how OneLake integrates with existing Power BI Premium estates and what migration from import mode to Direct Lake actually involves.
What Does LookML vs Power BI Data Modeling Mean for Regulated Industries?
For teams evaluating lookml vs power bi data modeling under compliance obligations, the decision involves legal and operational considerations beyond the technical comparison.
Healthcare (HIPAA / US, PIPEDA / Canada): Power BI's native integration with Microsoft Purview for data lineage tracking and sensitivity label enforcement gives healthcare organizations a compliance-adjacent audit trail within a single vendor stack. Power bi hipaa compliance for healthcare analytics is documented in detail by Microsoft (Microsoft Learn, 2025), but the most sensitive features - Fabric dynamic data masking, Purview sensitivity integration, and workspace-level audit logs - require Fabric capacity or Power BI Premium licensing. LookML's governance controls are stronger at the field level by default, but deploying Looker in a HIPAA-covered environment requires a Google Cloud Business Associate Agreement, adding a procurement step that many healthcare IT teams prefer to avoid if they are not already Google Cloud customers.
Financial services (SOC 2 / US, FCA / UK): Both platforms support SOC 2 controls, but LookML's immutable audit trail via Git is frequently easier to present to external auditors than Power BI activity logs distributed across multiple Microsoft admin portals. UK fintech firms under FCA operational resilience obligations often value LookML's testability specifically: metric definition tests can be written in YAML and run automatically in CI before each model deployment, providing documented evidence that business-critical calculations were validated before reaching production.
Manufacturing (ISO 27001, PIPEDA / Canada): A Canadian plant running shift operations reporting typically favors Power BI for its native Excel connectivity, familiar self-serve UI, and lower LookML learning curve. The total cost of ownership comparison for this segment is covered in our CFO cost guide for in-house BI versus managed reporting.
One concrete example of where the data model's access architecture matters beyond compliance: a book distributor we worked with could not extract their full billing history through the Power BI visual layer, which caps visual-to-CSV export at 30,000 rows. Connecting directly to the underlying model engine allowed streaming all 5,042,721 billing rows at roughly a million rows a minute - a practical reminder that export limits and model access paths are part of the architecture evaluation, not afterthoughts.
LookML vs Power BI: Which Should a BI Architect Recommend?
The decision framework reduces to a few defining factors:
- Git-first data team running BigQuery, Snowflake, or Databricks: LookML
- Microsoft 365 organization with Fabric investment or roadmap: Power BI
- HIPAA environment, Google Cloud BAA already in place: LookML with Looker
- HIPAA environment, Microsoft stack with Purview deployed: Power BI on Fabric
- Mid-market team, limited BI engineering headcount: Power BI (larger talent pool, faster ramp)
- Enterprise scale, 100-plus analysts, metric consistency critical: LookML
For a broader three-way comparison that adds Tableau's semantic layer to the analysis, see the enterprise decision framework for Looker, Power BI, and Tableau. For teams earlier in the evaluation who have not yet established a platform direction, the free BI readiness self-assessment surfaces the organizational and technical factors that most reliably predict which platform fits.
---
About Lets Viz: Lets Viz has delivered data modeling and BI architecture engagements since 2020 for clients in US healthcare, UK fintech, Canadian manufacturing, and global SaaS. Our 5.0 Clutch rating reflects hands-on work across LookML, Power BI tabular models, and Microsoft Fabric deployments - from initial semantic layer design through HIPAA and GDPR compliance validation. We hold partnerships across the major BI platforms and publish independent technical assessments to help architects make tool choices grounded in real implementation experience.
Use the Instant project cost calculator to build a scoped estimate for your LookML or Power BI data modeling project in under five minutes.