Looker vs Power BI vs Tableau: Enterprise Decision Framework
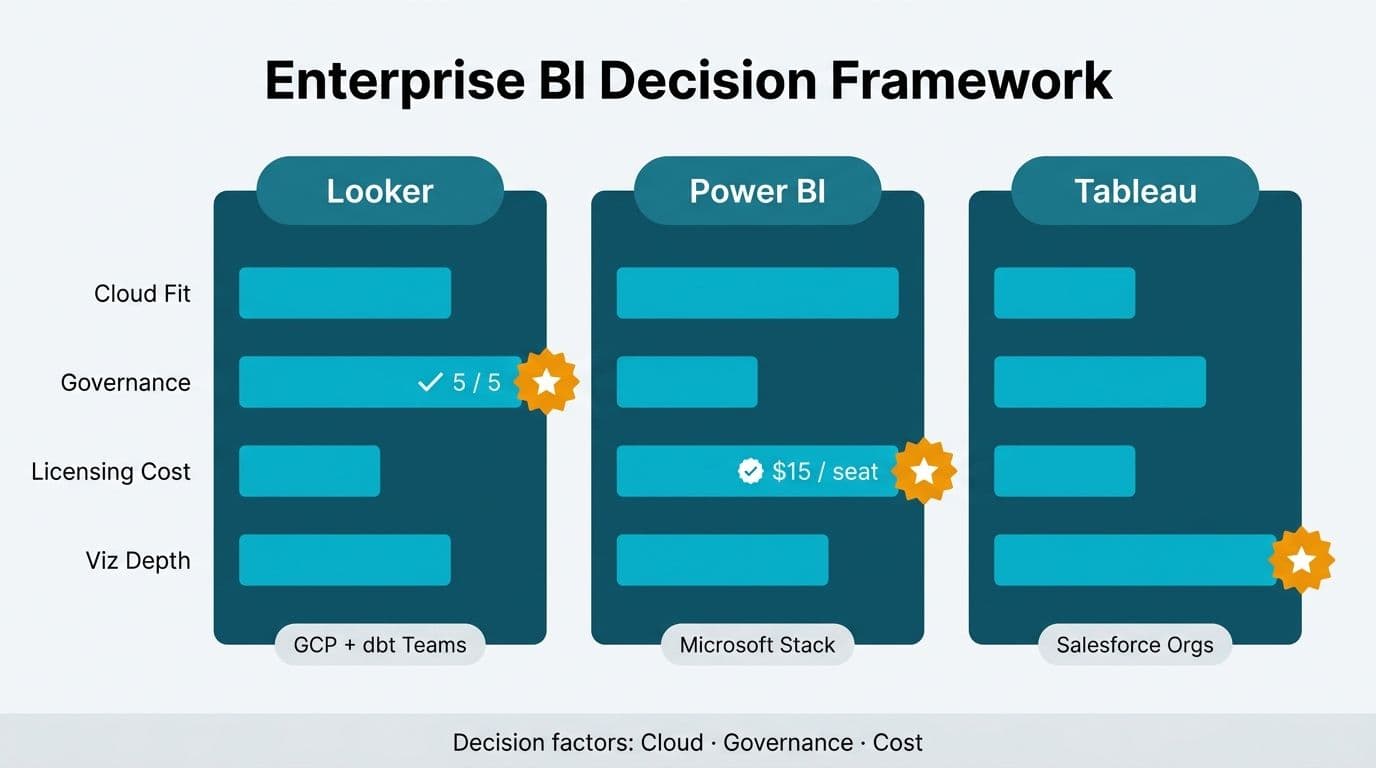
Choosing between Looker, Power BI, and Tableau depends on three factors: your cloud platform, your governance requirements, and your compliance regime. Power BI wins for Microsoft-aligned enterprises on cost and ecosystem fit; Looker wins for data-engineering-led teams on Google Cloud with strict semantic-layer needs; Tableau wins where visualization depth and Salesforce integration outweigh per-user licensing cost. Use our Instant project cost calculator to model three-year total cost of ownership before committing to any of these platforms.
Key Takeaways
Power BI delivers the best value for Microsoft 365 organizations, with per-user pricing from approximately $10 per month and unlimited-viewer Fabric capacity options for larger deployments.
Looker's LookML semantic layer is the most mature governed modeling framework, purpose-built for data-engineering-led teams on Google Cloud.
Tableau's visualization depth and native Salesforce integration are its primary advantages over lower-cost alternatives.
All three platforms carry GDPR, HIPAA, and PIPEDA-eligible certifications, but operationalizing compliance requires different configuration effort with each vendor.
Regional data residency is available across all three platforms - UK, EU, Canadian, and US data centers exist - but must be explicitly confirmed in procurement contracts.
What Separates Looker, Power BI, and Tableau in 2026?
Each platform was built for a different primary buyer. Power BI was designed for business users inside the Microsoft 365 ecosystem, integrating natively with Excel, Teams, SharePoint, and Azure Synapse Analytics. Looker (Google Cloud's enterprise BI platform) targets data-engineering-led organizations that want a single governed semantic layer shared across every downstream tool, dashboard, and API consumer. Tableau, now part of Salesforce, excels at rich interactive visualization and benefits from deep CRM data connectivity.
Enterprise BI platform selection directly shapes whether an organization can capture that value, because the wrong platform choice creates data silos, governance failures, and rework costs that compound over time.
A US healthcare system evaluating tools for clinical and financial analytics must satisfy HIPAA Business Associate Agreement requirements before any other evaluation criterion. A UK fintech firm subject to FCA oversight and GDPR needs confirmed EU data residency and audit-ready access logs. A Canadian manufacturing company under PIPEDA needs contractual guarantees that personal data remains within Canadian borders. All three platforms can satisfy these requirements - the gap is in how much configuration effort each demands.
Looker vs Looker Studio: Understanding the Product Split
Enterprise buyers frequently conflate two distinct Google products: Looker (the enterprise platform) and Looker Studio (the free browser-based reporting tool formerly known as Data Studio).
Looker Studio is a self-service reporting tool aimed at marketing teams and small-scale use cases. It connects to Google Analytics, Google Sheets, BigQuery, and third-party sources via community connectors. It is free, carries no central semantic layer, and is not designed for enterprise governance at scale. Our Looker Studio vs Power BI 2026 guide covers that specific decision for teams evaluating lighter-weight tooling.
Enterprise Looker is a paid platform with LookML-based semantic modeling, role-based access controls, embedded analytics APIs, and enterprise support tiers - a categorically different product with a correspondingly different price point. When scoping an enterprise BI evaluation, ensure your RFP conversations are explicitly limited to the Looker enterprise platform, or your cost comparisons will be meaningless.
The World Economic Forum (2026) documented that over 120 experts from more than 60 financial services organizations are actively building AI and analytics governance frameworks - frameworks that depend on consistent, auditable metric definitions that only a governed enterprise platform can enforce at scale.
How Do Licensing Models Compare: Looker vs Power BI vs Tableau?
Licensing structure is where the three platforms diverge most sharply - and where total cost of ownership calculations can shift a decision by hundreds of thousands of dollars over a three-year contract horizon.
Power BI offers two primary models: per-user (Pro at approximately $10 per user per month; Premium Per User at approximately $20 per user per month) and capacity-based pricing through Microsoft Fabric F-SKUs, which allow unlimited report consumers within a purchased compute capacity. Organizations already on Microsoft 365 E3 or E5 frequently receive Power BI Pro as a bundle component, making Power BI the clear value leader for Microsoft shops with large viewer populations - finance teams, operations managers, and executives who consume pre-built dashboards at scale.
Looker is priced on a platform commitment plus per-user or query-volume increments. Platform fees typically begin in the $30,000-$50,000 annual range before user seats are added, making it cost-prohibitive for teams under 50 active analysts or engineers. The investment payoff is a LookML semantic layer that enforces metric definitions consistently across every report, API call, and embedded consumer - eliminating the "which revenue figure is correct?" problem that financial auditors and regulators increasingly scrutinize.
Tableau uses a Creator/Explorer/Viewer tier model. Creators (workbook authors) carry the highest per-seat cost; Viewers who consume pre-built dashboards are cheaper but still accumulate rapidly at enterprise scale. A 300-user Tableau deployment can reach $200,000-$400,000 annually depending on tier mix and negotiated contract terms. Salesforce enterprise agreements can materially discount this for organizations already invested in the Salesforce ecosystem.
| Dimension | Power BI | Looker | Tableau |
|---|---|---|---|
| Starting user cost | ~$10/user/month (Pro) | $30,000+ platform fee | ~$15/user/month (Viewer) |
| Flat or capacity pricing | Yes (Fabric F-SKUs) | Volume commitment tiers | Limited |
| Microsoft 365 bundle discount | Yes | No | No |
| Salesforce native integration | Moderate | Moderate | Native |
| Google Cloud native depth | Via connectors | Native (BigQuery) | Via connectors |
| LookML semantic layer | No | Yes | No |
| Best entry team size | 5+ users | 50+ data-eng users | 25+ users |
Which Platform Has the Strongest Semantic Layer for Enterprise Governance?
The semantic layer - a governed, reusable definition of business metrics sitting between raw data and end-user consumption - is the highest-stakes architectural decision for multi-team analytics organizations.
Looker built the semantic layer into its architecture via LookML, a version-controlled, code-first modeling language. Every dashboard, embedded report, and API consumer queries the same LookML model, making metric inconsistency structurally impossible at the source. This makes Looker the preferred choice for data product teams, embedded analytics vendors, and any organization where a single definition of gross margin or customer churn must be enforced consistently across dozens of consumer systems.
Power BI semantic models (now a first-class citizen in Microsoft Fabric's Unified Analytics Platform) can be certified and shared across workspaces, with row-level security and column-level encryption for regulated data. The DAX calculation language is powerful but requires deliberate training investment for teams migrating from SQL-centric environments. Our Cognos to Power BI DAX Translation Guide is a practical resource for organizations making that transition from legacy reporting platforms.
Tableau introduced Tableau Semantic Layer to centralize metric definitions, but it remains less opinionated than LookML and less integrated with cloud data platforms than Power BI's Fabric semantic model. Tableau's core competitive advantage remains visualization richness and exploration speed, not semantic governance depth.
How Does Each Tool Handle GDPR, HIPAA, and PIPEDA Compliance?
Compliance is an operational programme, not a vendor certification checkbox. All three platforms carry relevant certifications, but the engineering effort to operationalize them differs meaningfully.
GDPR (UK and EU buyers): Microsoft, Google, and Salesforce all publish Data Processing Agreements under GDPR Article 28. Power BI data can be pinned to Microsoft's UK South, UK West, West Europe, or North Europe Azure regions. Looker runs on Google Cloud with EU-residency options including Frankfurt, London, and Belgium. Tableau operates from Salesforce data centers in Germany and the UK. A UK fintech managing personal financial data will find all three options viable - the practical differentiator is which DPA language your legal team finds acceptable and which regional data center meets your latency profile.
HIPAA (US healthcare and life sciences): Microsoft signs Business Associate Agreements for Power BI Premium and Fabric capacity workspaces with straightforward activation requirements - as of 2026, existing Azure customers typically complete BAA activation in under 48 hours, making it the lowest-friction path for US health systems. Google Cloud signs HIPAA BAAs for Looker deployments on GCP infrastructure. Salesforce signs BAAs for Tableau on Salesforce infrastructure, but activation involves additional configuration steps that typically require a professional services engagement spanning several weeks. A US hospital system moving clinical analytics off spreadsheets will generally find Power BI Premium or Fabric the fastest route to a HIPAA-eligible production environment.
PIPEDA (Canadian organizations): All three vendors offer Canadian data residency: Microsoft provides Canada Central (Toronto) and Canada East (Quebec City) Azure regions; Google Cloud has Montreal; Salesforce maintains Canadian data center pods. Canadian financial institutions and manufacturers subject to PIPEDA should require written contractual confirmation - not marketing-level assurances - that telemetry data, support-access records, and backup replicas do not replicate outside Canada. Our AI Analytics Data Privacy Risks guide provides the end-to-end audit checklist regulated organizations should complete before going live with any platform.
When Should You Migrate from Tableau to Power BI?
Migration decisions are driven by three signals: licensing cost pressure, ecosystem alignment shift, and semantic governance needs that exceed what Tableau provides natively.
Migrate from Tableau to Power BI when:
Your organization has standardized on Microsoft 365 and Azure, making Power BI the natural hub for data flows, identity management through Entra ID, and Fabric compute cost consolidation.
Tableau's per-seat licensing has crossed a cost threshold where Power BI Fabric capacity serves the same viewer population at materially lower annual spend.
Your finance or HR team needs tight Excel interoperability - Power BI's Analyze in Excel and live-connected pivot tables are materially stronger than Tableau's Excel integration.
You require pixel-perfect paginated reports for regulatory filings or statutory accounts - Power BI Report Builder handles this natively; Tableau does not provide an equivalent.
Your data team wants a governed semantic model shared across multiple BI consumers - Power BI certified datasets on Fabric deliver this without the LookML engineering investment Looker requires.
Stay on Tableau when:
Your analytics team performs high-velocity ad hoc exploration where Tableau's drag-and-drop visualization speed is a genuine productivity multiplier.
You operate Salesforce as your primary system of record and the native Tableau-Salesforce connector eliminates meaningful data engineering overhead.
Your published visualization portfolio uses advanced chart types - animated timelines, custom geographic layers, network graphs - that would require significant rebuild effort in Power BI.
The World Economic Forum (2026) documented that more than 60 financial services organizations are actively building AI governance and analytics frameworks - a shift that makes the semantic layer and compliance story increasingly central to BI platform decisions, not just a secondary feature comparison.
Which BI Tool Fits Your Regulated Industry Across US, UK/EU, and Canada?
The right platform depends more on industry vertical and existing cloud infrastructure than on geography alone, though regional compliance requirements sharpen the decision in regulated sectors.
Financial services (US, UK, Canada): Power BI is the strongest fit for mid-market banks, credit unions, and insurance companies already running Microsoft stack. Looker wins for fintechs with a data-engineering culture and Google Cloud as their primary data platform. For teams evaluating the full Microsoft analytics stack, our Microsoft Fabric OneLake guide explains how the unified data lake layer reshapes the Power BI deployment model for financial services organizations.
Healthcare (US primarily; NHS digital transformation in UK): Power BI Premium with a signed Microsoft BAA is the established path for US health systems moving from fragmented spreadsheet reporting to governed analytics. Looker on GCP suits health organizations already invested in Google Cloud Healthcare API and FHIR data standards. MedInsight's 2026 healthcare analytics review identified AI-driven analytics and payer analytics innovation as the two dominant themes shaping platform investment in the sector - both of which favor platforms with mature semantic governance over pure visualization capability.
Manufacturing and supply chain (Canada, UK, US): All three tools connect to major ERP platforms - SAP, Oracle, and Microsoft Dynamics 365. Power BI wins on per-seat economics for large operational dashboard populations: production supervisors, logistics coordinators, and plant managers who need Viewer-only access at Fabric capacity pricing pay a fraction of equivalent per-seat costs on competing platforms. A Canadian manufacturer deploying dashboards to 500 plant-floor supervisors will find Power BI Fabric capacity economics decisively more attractive than Tableau's Creator/Viewer model.
SaaS and technology companies: Looker's embedded analytics APIs and programmatic metric access make it the preferred choice for SaaS vendors that serve analytics inside their own product interface. Power BI Embedded is a viable alternative at lower platform cost for teams already on Azure infrastructure.
---
About Lets Viz: Lets Viz has guided US healthcare organizations, UK fintech firms, Canadian manufacturing companies, and global SaaS businesses through enterprise BI platform selection and implementation since 2020, earning a 5.0 Clutch rating across engagements. Our certified team regularly conducts three-way Looker, Power BI, and Tableau evaluations for regulated industries - combining vendor-neutral assessment with hands-on deployment experience across HIPAA, GDPR, and PIPEDA environments.
If you are ready to model the actual cost and implementation timeline for your BI platform shortlist, use the Instant project cost calculator to generate a tailored estimate calibrated to your team size, data volume, and compliance requirements.