In-House BI vs. Managed Reporting: SaaS CFO Cost Guide
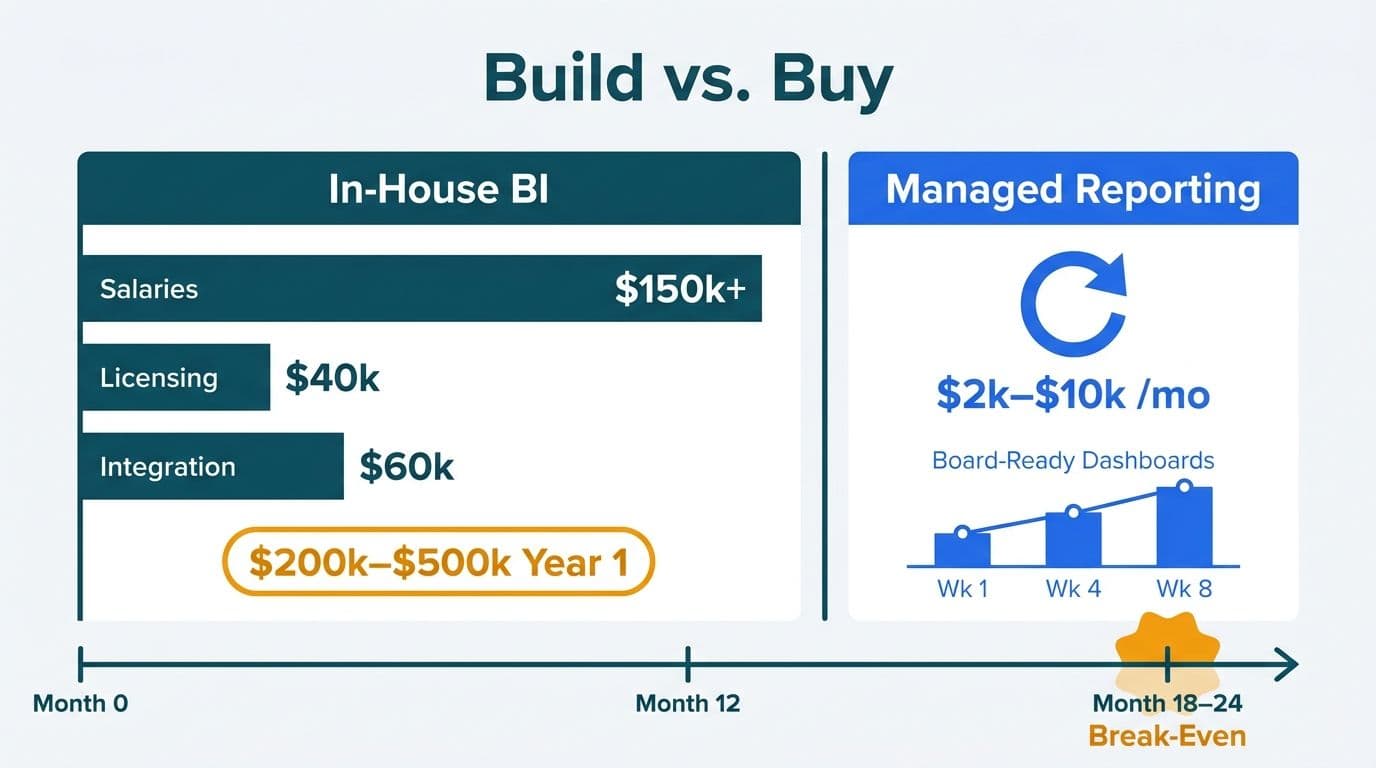
A managed SaaS financial reporting consultant typically costs $2,000-$10,000 per month, while building an equivalent capability in-house carries a first-year total cost of ownership of $200,000-$500,000 once engineering salaries, Power BI licensing, and integration work are included. For most Series A-C SaaS companies, the managed route reaches break-even within 18-24 months - and delivers board-ready dashboards in weeks, not quarters.
Key Takeaways
In-house BI builds cost $200k-$500k in year one; managed reporting retainers run $2k-$10k per month.
The rule of 40 SaaS benchmark, ARR cohort analysis, and net revenue retention are the metrics boards most frequently challenge - each requires precise DAX authoring to calculate correctly.
Trigger signals for engaging a managed partner include a departing BI analyst, a Series B data room request, or consecutive missed board deadlines.
Geographic compliance - SOC 2 for US entities, GDPR for UK and EU operations, PIPEDA for Canadian organizations - adds meaningful scope to any in-house build.
Break-even on a managed retainer versus a full-time hire typically falls between months 14 and 20 for a Series B SaaS company.
What Does a SaaS Financial Reporting Consultant Actually Cost?
SaaS financial reporting consultant costs vary significantly by engagement model. Three structures dominate the market:
Project-based engagements cover one-time builds - a complete Power BI SaaS finance stack typically runs $15,000-$80,000, depending on data source complexity and the number of semantic model measures required. This model suits companies that need a defined deliverable and have internal capacity to maintain the stack afterward.
Managed monthly retainers provide ongoing coverage: maintenance, new report development, model governance, and access management. Costs range from $2,000-$10,000 per month. This is the model most Series A and B CFOs select because the cost is predictable, the scope scales with headcount, and there is no single-person knowledge dependency.
Full-time BI hire: A senior BI engineer or data analyst with SaaS domain expertise commands $140,000-$190,000 in base salary in US markets (as of 2026). With benefits, payroll tax, and on-costs, total annual cost exceeds $215,000. UK and Canadian markets run 15-20% lower but face comparable talent scarcity and a 3-6 month hiring cycle that introduces its own timeline risk.
For CFOs evaluating the analytics landscape, Power BI for SaaS finance teams has become the reference architecture for growth-stage SaaS finance functions across the US, UK, and Canada - combining a competitive licensing floor with the DAX calculation engine that SaaS-specific metrics require.
What Does In-House BI Development Really Cost?
In-house BI development is rarely a single line item. The true cost stack for a Series B SaaS company building a production-ready reporting environment from scratch typically includes:
Engineering salaries: One senior BI engineer plus one data analyst totals $250,000-$350,000 per year in fully loaded cost in US markets. UK and Canadian equivalents are proportionally lower but talent is equally scarce, with average hiring cycles of 90 days or more for senior analytics roles.
Data infrastructure: A cloud warehouse or lakehouse - Microsoft Fabric, Snowflake, or Databricks - adds $18,000-$60,000 annually at typical Series B data volumes. The Microsoft Fabric Data Pipeline tutorial illustrates the engineering overhead involved in pipeline construction alone, which requires a dedicated engineer to build and maintain correctly.
Power BI licensing: Power BI Premium Per User runs approximately $20 per user per month (as of 2026). A 15-person finance team spends roughly $3,600 per year at that rate; Premium capacity for self-service distribution to a broader business audience costs materially more.
Integration and migration: Connecting billing platforms (Stripe, Chargebee, or Zuora), CRM, and ERP to a shared semantic model typically adds $20,000-$80,000 in one-time engineering cost, depending on API quality and data cleanliness.
Ongoing governance: Model updates, access management, and report refresh monitoring account for 20-30% of initial build cost annually - a figure most in-house projections undercount.
Year-one total for a credible in-house SaaS finance BI stack: $200,000-$500,000. Ongoing year-two cost: $150,000-$300,000.
Build vs. Managed Partner: The SaaS CFO Decision Matrix
The table below maps the two paths across the factors that matter most at Series A-C stage. The trigger signal column identifies when the balance tips decisively.
| Factor | In-House Build | Managed Reporting Partner | Trigger Favoring Managed |
|---|---|---|---|
| Year-one cost | $200k-$500k | $24k-$120k | Runway under 18 months |
| Time to first board dashboard | 6-18 months | 4-8 weeks | Board deadline within 60 days |
| SaaS metric depth (ARR, NRR, Rule of 40) | Custom DAX build required | Pre-built SaaS templates | First Series B data room request |
| Compliance scope (SOC 2, GDPR, PIPEDA) | Self-managed | Partner-managed | Operating in 2+ jurisdictions |
| Talent dependency risk | High | Low | BI analyst departure |
| DAX expertise (CROSSFILTER, ALLSELECTED) | Must hire or train | Included | Reports failing QA in board prep |
| Scalability past $50M ARR | Very high | Medium-High | ARR approaching $50M+ |
| Flexibility for bespoke revenue models | Very high | High | Complex usage-based billing |
Three Decisive Trigger Signals
Signal 1 - Board reporting failure. If your team has missed a board deadline or delivered materially incorrect SaaS metrics in consecutive quarters, the cost of that failure already exceeds a year of managed retainer fees. A managed partner typically delivers a corrected, board-ready model within two to four weeks of engagement.
Signal 2 - The Series B data room. Investors conducting Series B due diligence will request cohort waterfall tables, NRR broken down by segment, and a rule of 40 SaaS benchmark reconciliation against prior-period forecasts. In 2026, median Series B deal timelines have compressed to 8-10 weeks from first meeting to term sheet - leaving no runway to build a data model from scratch mid-process. If your team cannot produce these from a live, auditable data model within 48 hours of a request, a managed partner closes that gap materially faster than any new hire.
Signal 3 - A departing BI analyst. When the one person who owns your Power BI semantic model leaves, institutional knowledge of every measure definition, data transformation, and filter context assumption leaves with them. A managed service externalizes that dependency and keeps reporting continuous through any personnel transition.
What SaaS Metrics for Board Reporting Should Your Stack Deliver?
SaaS metrics for board reporting fall into three tiers that investors evaluate sequentially. A production-ready reporting stack must reliably deliver all three.
Tier 1 - Growth metrics: MRR, ARR, ARR growth rate, and new ARR disaggregated by motion (new logo, expansion, reactivation). These are table-stakes for any board pack regardless of stage.
Tier 2 - Efficiency metrics: Net Revenue Retention, gross margin, CAC payback period, and the rule of 40 SaaS benchmark - revenue growth rate plus EBITDA margin, where the combined figure should exceed 40% for a healthy growth-stage SaaS business. A US SaaS finance team that cannot produce a live Rule of 40 reconciliation faces credibility pressure from any institutional investor running a cross-portfolio benchmark.
Tier 3 - Predictive metrics: Pipeline coverage ratio, logo churn waterfall, and expansion revenue cohort analysis by signing period. These require a well-structured DAX model. The DAX CROSSFILTER function in Power BI is specifically needed when managing bi-directional relationships between a contracts table and a billing events table through a shared customer dimension - a common architecture in subscription and usage-based billing models where a single customer can hold multiple active contracts simultaneously.
The FP&A Dashboard in Power BI: A Step-by-Step Build Guide covers the semantic model structure that underpins all three tiers for a SaaS finance team, including the specific DAX measure patterns for ARR waterfall and NRR cohort calculations.
How Does Geography Shape the Build vs. Buy Decision?
Geography affects both cost and compliance scope - two factors that can make an in-house build materially more expensive than a US-only model suggests.
US SaaS companies operating under SOC 2 Type II must ensure their BI environment falls within the audit scope. A managed Power BI partner that holds SOC 2 certification passes that coverage through to the client's audit pack. An in-house build requires dedicated security controls documentation, penetration testing, and continuous evidence collection - typically adding $20,000-$40,000 to year-one cost.
UK and EU SaaS firms face GDPR obligations covering data residency, access logging, and right-to-erasure workflows. A UK fintech firm running Power BI with EU data residency enabled can satisfy Article 44 transfer requirements without additional legal instrumentation. The World Economic Forum (2025) convened over 100 experts from more than 50 financial services organizations specifically to address governance and data challenges in AI-driven financial analytics - underscoring that cross-border compliance is an industry-wide priority, not a niche concern.
Canadian SaaS companies subject to PIPEDA and Quebec's Law 25 face residency and consent-management requirements that add engineering scope to any in-house data pipeline. A managed partner with Canadian data centre coverage typically closes that compliance gap faster and at lower cost than a bespoke internal build.
For a direct licensing cost comparison across markets and tool alternatives, the Google Looker Pricing 2026 analysis illustrates why Power BI's per-user licensing model holds a structural cost advantage in all three geographies.
What Does Best-in-Class Managed SaaS Reporting Deliver in 90 Days?
A well-scoped managed SaaS reporting engagement delivers five outcomes in the first 60-90 days that an in-house build cannot match on the same timeline.
Semantic model audit and rebuild: All source systems catalogued, relationships validated, and a certified Power BI semantic model built with clearly documented SaaS measures covering ARR, NRR, churn, expansion, and Rule of 40.
Board pack template: A board-ready data story covering Tier 1 and Tier 2 metrics, formatted to institutional investor expectations and version-controlled for quarterly updates.
Certified DAX measure library: Measures for each SaaS KPI, with documented filter context assumptions and regression tests that flag when a data source change would break a measure silently. For the DAX patterns involved, the DAX SUMMARIZE vs SUMMARIZECOLUMNS finance reporting guide explains why a single incorrectly scoped filter can produce ARR figures that pass visual inspection but fail investor scrutiny.
Row-level security and access governance: Finance teams operating across US, UK, and Canadian jurisdictions need role-based access aligned with GDPR and SOC 2 requirements. A managed partner configures this as standard, whereas an in-house team must design and audit it manually.
Handoff protocol and review cadence: Monthly governance reviews, plus documentation sufficient for any internal analyst to understand and maintain the model. No knowledge is locked in a single head.
When Does Building In-House Make Sense?
The in-house path wins under a specific and recognizable set of conditions.
Choose in-house if: Your ARR exceeds $50M and a dedicated data team of three or more is already operational; your revenue model is sufficiently bespoke - complex usage-based billing with multi-variable tiering - that pre-built SaaS metric templates require more customization than a managed partner can provide cost-effectively; or you are Series C or later with a permanent head of analytics and a 24-month BI roadmap already ratified by the board.
For all other situations - which accurately describes most Series A and Series B SaaS companies - the managed retainer model delivers faster time-to-value, lower execution risk, and a more predictable cost structure than any in-house build can match in the first 24 months.
If your current data maturity is uncertain before committing to either path, the free BI readiness self-assessment produces a scored readiness report in twelve minutes that maps directly to this build-vs-buy decision.
The Power BI for SaaS finance teams service page outlines how Lets Viz structures managed SaaS reporting engagements for Series A through Series C companies, including scope definitions, delivery timelines, and pricing tiers.
---
About Lets Viz: Lets Viz has delivered analytics and business intelligence engagements since 2020, serving US healthcare providers, UK fintech firms, Canadian manufacturing companies, and global SaaS finance teams. With a 5.0 Clutch rating and certified expertise across Power BI, Microsoft Fabric, and modern SaaS data stacks, the team brings practitioner-level rigor to every board reporting engagement - from first Series A pack to Series C data room readiness.