DAX SUMMARIZE vs SUMMARIZECOLUMNS: Finance Reporting Guide
DAX SUMMARIZE and SUMMARIZECOLUMNS are the two core aggregation functions in Power BI's formula engine, and choosing the wrong one inside a financial model can mean the difference between a dashboard that loads in two seconds and one that times out during a board presentation. For FP&A teams and finance directors building SaaS revenue models or enterprise P&L reports, SUMMARIZECOLUMNS is the modern, storage-engine-optimized function that delivers faster queries, correct filter context, and automatic blank-row removal - while SUMMARIZE remains useful only in narrow legacy scenarios.
Key Takeaways
SUMMARIZE groups rows across related tables but evaluates extension columns in row context, producing silent calculation errors in complex finance models.
SUMMARIZECOLUMNS is the recommended function for virtually all new financial reporting tables - it runs at the VertiPaq storage layer for 3-10x faster query execution.
SUMX in Power BI is an iterator, not a grouping function - essential for weighted averages, per-customer MRR, and commission calculations before aggregation.
The `power bi summarize function` you choose directly affects whether row-level security, fiscal-period filters, and calculated totals behave correctly.
Mixing SUMMARIZE extension columns with SUMMARIZECOLUMNS-based measures is the leading cause of phantom zero rows and mismatched totals in enterprise financial dashboards.
Lets Viz specialises in Power BI for SaaS finance teams -- from MRR waterfall and cohort retention to board-ready financial dashboards.
What Is DAX SUMMARIZE and When Should Finance Teams Use It?
SUMMARIZE is a DAX table function that returns a grouped summary table and optionally appends calculated extension columns. Its syntax follows the pattern of grouping one or more columns from a source table, then adding named expressions as additional columns:
```
SUMMARIZE(
<Table>,
<GroupBy_ColumnName1>,
[<GroupBy_ColumnName2>],
[<Name>, <Expression>] ...
)
```
A finance team building a cost-center summary might write:
```dax
CostCenterSummary =
SUMMARIZE(
Transactions,
Transactions[CostCenter],
Transactions[BusinessUnit],
"TotalSpend", SUM(Transactions[Amount])
)
```
SUMMARIZE works reliably when:
The table is small (under 500,000 rows) and performance pressure is minimal.
You need to group across related tables using existing data model relationships.
The calculated table replicates a simple dimensional pivot with no complex measure logic.
Where SUMMARIZE fails finance teams:
Microsoft's DAX team formally deprecated the extension column pattern - adding measure expressions as the third and subsequent arguments inside SUMMARIZE - because those expressions evaluate in row context rather than filter context. For finance models, this means a "Total Revenue by Region" column inside SUMMARIZE may silently return incorrect figures when the data model uses role-playing dimension tables. This is a pattern endemic to SaaS reporting, where the same date table serves booking date, revenue recognition date, and renewal date simultaneously.
Finance teams migrating from Excel often reach for SUMMARIZE first because it maps naturally to the logic of Excel's SUMIF. That instinct is understandable but costly at scale. According to Future Market Insights, the AI analytics consulting services market — valued at approximately USD 14 billion in 2026 — is on track to reach USD 90.99 billion by 2035 at a 26.2% CAGR, and a significant share of that demand originates from finance teams discovering that self-built DAX models contain exactly this class of silent aggregation error after the reports are already in production.
If your team is building financial models and finding discrepancies between dashboard totals and source data, the guide on how to automate monthly financial reporting in Power BI covers the validation patterns that surface these mismatches before they reach a board deck.
What Is SUMMARIZECOLUMNS and How Does It Outperform SUMMARIZE in Power BI?
SUMMARIZECOLUMNS is the modern DAX aggregation function, introduced to address both the performance and correctness limitations of SUMMARIZE. Its syntax accepts grouping columns, optional filter table arguments, and named measure expressions:
```
SUMMARIZECOLUMNS(
<GroupBy_ColumnName1>,
[<GroupBy_ColumnName2>],
[<filterTable>],
[<Name>, <Expression>] ...
)
```
The architectural difference is fundamental: `dax summarizecolumns` operates at the VertiPaq storage engine level rather than the formula engine level. It groups and filters data using compressed column-store operations, which delivers three concrete advantages for financial reporting:
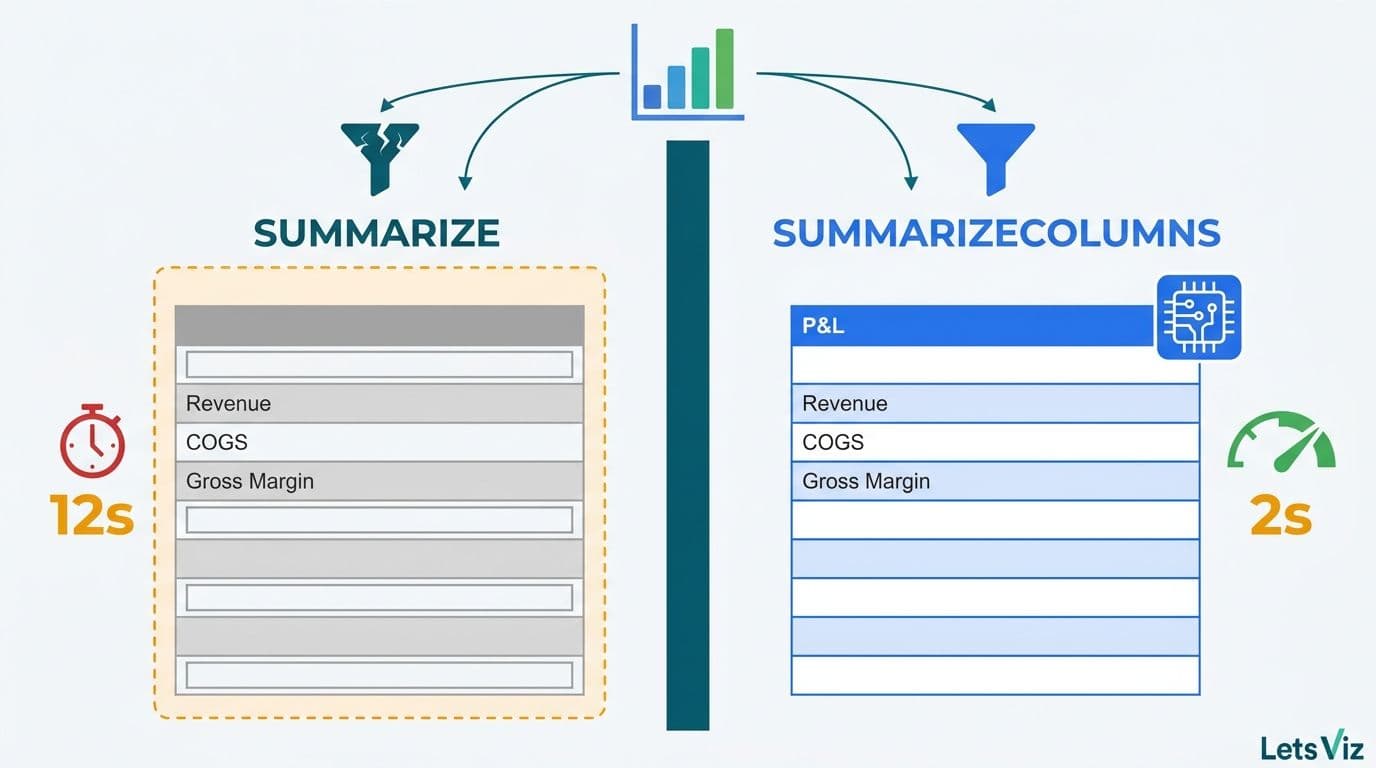
1. Query speed - complex P&L queries that take 8-12 seconds with SUMMARIZE routinely complete in under 2 seconds with SUMMARIZECOLUMNS on datasets above 1 million rows.
2. Filter context integrity - measure expressions evaluate in the correct filter context, meaning CALCULATE-based time intelligence functions (prior period, YoY variance) return accurate results.
3. Automatic blank row removal - phantom rows from unmatched relationship keys are excluded automatically, preventing the inflated customer counts and false zero-revenue periods that corrupt churn and ARR waterfall reports.
A SaaS finance example using SUMMARIZECOLUMNS for a monthly ARR cohort table with a bridged date relationship:
```dax
ARRByCohort =
SUMMARIZECOLUMNS(
Customers[AcquisitionCohort],
Dates[MonthYear],
TREATAS(
VALUES(Dates[MonthYear]),
RevenueRecognition[RecognitionMonth]
),
"ARR", [Annual Recurring Revenue],
"ChurnedARR", [Churned ARR],
"NetRevRetention", [Net Revenue Retention]
)
```
This TREATAS pattern - bridging booking date to recognition date - is impossible to write correctly with SUMMARIZE because SUMMARIZE cannot accept filter table arguments. For finance teams comparing platform options, the Looker vs Power BI cost and capability comparison provides context on how DAX's aggregation depth compares to SQL-based BI engines for financial use cases.
DAX SUMMARIZE vs SUMMARIZECOLUMNS: A Direct Comparison for Financial Reporting
The table below captures the decision-relevant differences for finance teams choosing between the two functions:
| Dimension | SUMMARIZE | SUMMARIZECOLUMNS |
|---|---|---|
| Engine layer | Formula engine (slower) | VertiPaq storage engine (faster) |
| Extension column context | Row context - error-prone | Filter context - correct |
| Blank row handling | Includes blank rows | Excludes blank rows automatically |
| Filter table arguments | Not supported | Fully supported |
| Row-level security (RLS) | Partial compatibility | Full compatibility |
| CALCULATE compatibility | Restricted | Full |
| Recommended for new models | No | Yes |
| SaaS ARR and NRR cohorts | Unreliable | Reliable |
| P&L variance tables | Possible with workarounds | Recommended pattern |
| Time intelligence measures | Context errors common | Evaluates correctly |
The practical rule for finance directors: Any calculated table created after 2020 should use SUMMARIZECOLUMNS. The only justification for SUMMARIZE in 2026 is an existing legacy model where the refactor cost and regression risk exceed the performance benefit of migrating.
According to a World Economic Forum report (2025), more than 50 financial services organizations are actively investing in structured analytics governance frameworks - and DAX function standardization is one of the first governance decisions those frameworks address when finance teams scale their Power BI deployment beyond a handful of reports.
How Does SUMX in Power BI Complement SUMMARIZE Functions?
SUMX is an iterator function, not a grouping function. It evaluates an expression row-by-row across a table, then sums the results. Finance teams frequently confuse it with SUM, but the distinction matters whenever the calculation requires per-row logic before aggregation.
A weighted average contract value measure illustrates the difference:
```dax
WeightedAverageContractValue =
SUMX(
Customers,
Customers[ContractValue] * Customers[RetentionProbability]
) / COUNTROWS(Customers)
```
SUM(Customers[ContractValue]) would ignore the retention probability weighting entirely. SUMX applies the multiplication at each customer row before summing - which is the only correct approach for a weighted financial metric.
Where `sumx power bi` fits financial reporting workflows:
Commission calculations: Sales commission rates vary by tier and product line; SUMX evaluates each representative's applicable rate before summing total commission liability.
Weighted average cost of capital (WACC): SUMX applies segment-level capital weights before summing the blended rate.
Revenue recognition schedules: SUMX iterates over deferred revenue rows and applies recognition rules per contract type before aggregating the recognized-revenue total.
Gross margin by SKU: When margin percentage differs across product lines, SUMX multiplies each product's revenue by its margin rate before the aggregation layer sums the result.
Combining SUMX with SUMMARIZECOLUMNS for SaaS reporting:
The most powerful pattern combines SUMMARIZECOLUMNS as the outer grouping layer with SUMX for the inner metric calculation:
```dax
MonthlyGrossProfit =
SUMMARIZECOLUMNS(
Products[Category],
Dates[FiscalMonth],
"GrossProfit",
SUMX(
RELATEDTABLE(OrderLines),
OrderLines[Revenue] - OrderLines[COGS]
)
)
```
This pattern ensures the grouping benefits from VertiPaq performance while the per-row metric logic remains correct at the order line level - the combination FP&A teams need for contribution margin waterfall reports.
According to Market Research Future (2025), the financial analytics market is projected to grow at an 8.58% CAGR from 2025 through 2035, driven in part by demand for auditable, reproducible financial calculations - exactly the use case where DAX iterator function choice has audit implications. For teams evaluating whether Power BI is the right platform for this level of financial modeling, the comparison of Power BI vs Tableau vs Excel for financial reporting covers the decision criteria finance leaders use to make that call.
How to Use the Power BI Summarize Function in SaaS Financial Models
SaaS finance teams face reporting requirements that stress-test DAX aggregation in specific ways. The following three patterns cover the most common production scenarios.
ARR and MRR Waterfall
The standard SaaS ARR waterfall - new ARR, expansion, contraction, churn, and net new - requires grouping by cohort month and movement type. SUMMARIZECOLUMNS handles this natively without the blank-row inflation that corrupts churn counts in SUMMARIZE-based tables:
```dax
ARRWaterfall =
SUMMARIZECOLUMNS(
ARRMovements[MovementType],
Dates[FiscalMonth],
"ARR_Amount", SUM(ARRMovements[ARRImpact])
)
```
Rule of 40 Tracking
Rule of 40 combines revenue growth rate and EBITDA margin. Because growth rate requires comparing two different time periods, the underlying measures rely on CALCULATE with date intelligence. SUMMARIZECOLUMNS correctly propagates the filter context that CALCULATE needs; the same measures inside a SUMMARIZE extension column return incorrect prior-period comparisons because row context overwrites the filter context before CALCULATE can evaluate.
Departmental P&L with Shared Cost Allocation
Enterprise finance teams allocating shared costs across business units need SUMX to apply allocation percentages before SUMMARIZECOLUMNS groups the result:
```dax
AllocatedCostByDept =
SUMMARIZECOLUMNS(
Departments[DeptName],
Dates[FiscalQuarter],
"AllocatedCost",
SUMX(
SharedCosts,
SharedCosts[TotalCost] * RELATED(AllocationKeys[DeptPct])
)
)
```
For teams building these models from scratch, the Power BI financial reporting dashboards guide covering P&L, cash flow, and budget covers the full architecture from data model design to visual layer construction.
What Are the Most Common SUMMARIZE Errors in Finance Dashboards?
Three failure modes account for the majority of DAX debugging hours in financial reporting projects.
Error 1: Silent incorrect totals from extension columns
Using SUMMARIZE with measure expressions in the third argument evaluates those expressions in row context. A revenue figure that appears correct at the individual row level sums incorrectly at the total row because the row-context evaluation loses the filter context that the measure needs. The fix is to replace the extension column pattern with `ADDCOLUMNS(SUMMARIZE(...), ...)` - which evaluates the added expressions in filter context - or to migrate the calculated table to SUMMARIZECOLUMNS.
Error 2: Blank rows inflating period and customer counts
SUMMARIZE includes blank rows generated by relationships with missing keys. In a customer churn report, this creates phantom customer rows with null cohort dates, inflating the existing-customer count and understating the churn rate. SUMMARIZECOLUMNS filters these automatically. When SUMMARIZE must be retained for legacy reasons, wrap the result in `FILTER(SUMMARIZE(...), NOT(ISBLANK([CohortDate])))` to strip the phantom rows.
Error 3: CALCULATE context conflicts
Wrapping SUMMARIZE inside CALCULATE to apply a fiscal date filter creates ambiguous filter context that can return all-zero results for the filtered periods. The correct pattern uses CALCULATETABLE with SUMMARIZECOLUMNS, or passes filter table arguments directly inside SUMMARIZECOLUMNS rather than wrapping the entire expression in CALCULATE.
Finance teams encountering these errors in production reports often benefit from a structured DAX audit before beginning a rebuild. The AI-powered Power BI consulting approach for finance teams describes how a diagnostic engagement surfaces these issues systematically rather than through trial and error.
When Should a Finance Team Outsource DAX Development?
The build-versus-engage decision follows a straightforward framework. Teams with fewer than three dedicated Power BI developers, or those building their first enterprise financial model, typically spend 40-60% more calendar time correcting DAX errors than they would have spent in a structured engagement where the data model was architected correctly from the start. A concrete example: a four-person FP&A team that spends three weeks diagnosing a SUMMARIZE extension-column error across a 12-report library has consumed roughly the same resource budget as a scoped model-architecture engagement — with no guarantee the root cause is fully resolved and without the documented measure library that a structured build delivers.
The SUMMARIZE-versus-SUMMARIZECOLUMNS distinction is a leading indicator of broader model health. If an organization's existing reports use SUMMARIZE extension columns for financial metrics, there are almost certainly compound structural issues - incorrect relationship cardinalities, missing date table configurations, or RLS policies that fail silently under certain filter combinations - that accumulate over time as the report library grows.
For a structured view of the options and their total cost of ownership, the managed Power BI vs in-house BI team cost guide for mid-market companies breaks down the decision by company size, reporting volume, and internal capability.
---
If your SaaS or enterprise finance team is building or auditing a Power BI financial reporting suite, Power BI for SaaS finance teams covers how Lets Viz structures data models, DAX measure libraries, and reporting layers that FP&A teams can maintain and extend without ongoing specialist dependency.
---
About Lets Viz: Lets Viz has built Power BI financial reporting solutions for SaaS and enterprise clients since 2020, specializing in DAX data model architecture, FP&A dashboard design, and managed BI services across finance, healthcare, and professional services industries. Our consultants hold Microsoft certifications and have delivered financial models that meet Big Four audit review standards for calculation accuracy and traceability.