Managed Power BI vs In-House BI Team: Mid-Market Cost Guide
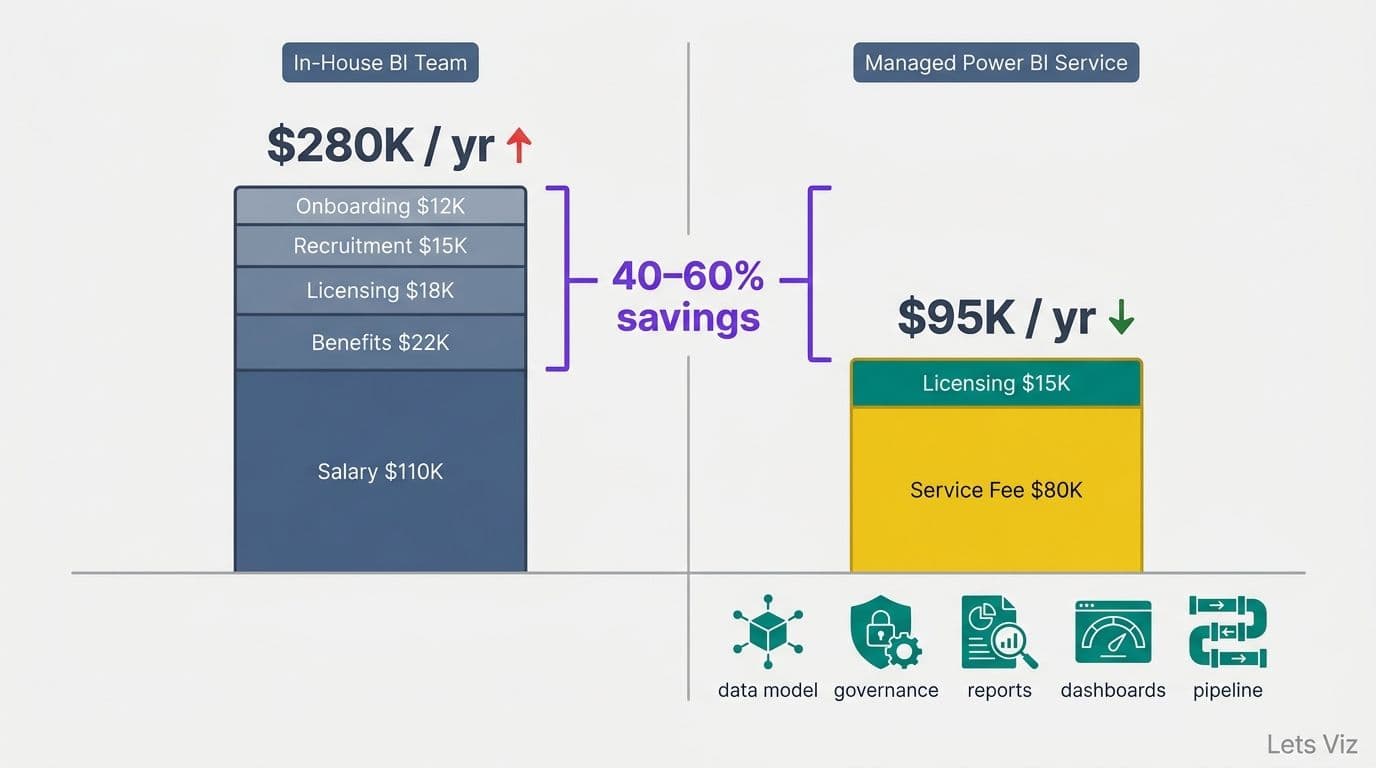
For mid-market companies, managed Power BI services typically cost 40–60% less than an equivalent in-house BI team, with in-house Year 1 costs running $170,000–$280,000 versus managed service fees that eliminate recruiting, benefits, and licensing overhead. The cost gap is driven primarily by senior developer salaries ($90,000–$130,000 base) plus employer overhead, making managed services the more cost-effective choice unless your organization requires dedicated full-time BI capacity.
For most mid-market companies, a managed Power BI service delivers comparable analytics capability at 40-60% of the total cost of an equivalent in-house BI team. The primary driver is staffing: a single senior Power BI developer commands $90,000-$130,000 annually in base salary, before employer benefits, recruitment, and licensing overhead. Managed services compress that spend while providing broader expertise across data modelling, governance, and report delivery simultaneously.
Key Takeaways
In-house BI teams cost mid-market companies $170,000-$280,000 per year in Year 1 once salary, employer benefits, recruitment, and tooling are tallied
A managed Power BI service retainer typically runs $3,500-$8,000 per month, delivering positive ROI within 6-12 months for most mid-market buyers
Regulated industries such as healthcare finance and financial services carry compliance overhead that widens the cost gap further in favour of managed services
Power BI's total cost of ownership advantages are amplified when licences are already bundled inside an existing Microsoft 365 agreement
Build-vs-buy decisions hinge on three variables: analytics maturity, staff retention risk, and dashboard throughput requirements
For a complete primer on how analytics programmes typically evolve, see the business intelligence overview from Lets Viz
Managed Power BI Service vs In-House BI Team: What Are the Real Costs?
For a 300-600 employee mid-market company, a managed Power BI service costs $42,000-$96,000 per year compared to $255,000-$350,000 in Year 1 for a comparable in-house BI team. The primary drivers of that gap are staffing costs, recruiting fees, and the rarely-budgeted expense of developer attrition and knowledge loss.
A realistic in-house build at a 500-person company requires at minimum one senior Power BI developer and one BI analyst. In 2026, total compensation for that pairing - salary plus employer-side benefits and payroll taxes, which typically add 28-32% above base - lands between $175,000 and $270,000 per year. Layer on recruiting costs of $15,000-$30,000 per hire and an onboarding ramp of 60-90 days before the team reaches full productivity, and Year 1 costs routinely exceed $220,000 before a single executive dashboard ships.
A managed Power BI service replaces that structural overhead with a predictable monthly retainer. Mid-market engagements typically fall between $3,500 and $8,000 per month ($42,000-$96,000 annually), depending on dashboard complexity, user count, and whether the scope includes semantic model governance and data pipeline management.
The table below uses conservative estimates for a 300-600 employee company requiring 8-12 production dashboards per year:
| Cost Category | In-House BI Team (Year 1) | Managed Power BI Service (Year 1) |
|---|---|---|
| Senior BI Developer base salary | $100,000-$125,000 | Included |
| BI Analyst base salary | $65,000-$85,000 | Included |
| Employer benefits and payroll overhead (30%) | $49,500-$63,000 | Included |
| Power BI Pro licences (15 users) | $1,800/yr | Included |
| Premium Per User licences (optional, 5 users) | $4,800/yr | Included |
| Recruitment and onboarding costs | $30,000-$60,000 one-time | $0 |
| Training and professional certifications | $4,000-$10,000/yr | $0 |
| Managed service retainer | N/A | $42,000-$96,000 |
| Estimated Year 1 total | $255,100-$348,800 | $42,000-$96,000 |
| Estimated Year 2+ total | $224,100-$287,800 | $42,000-$96,000 |
Year 2 in-house figures remove the one-time recruiting cost but reflect 3-5% annual compensation growth. The gap narrows slightly in later years but rarely closes for sub-1,000 employee companies within a 5-year planning horizon.
According to Microsoft's 2026 commercial licensing documentation, Power BI Pro is included at no incremental per-seat cost in Microsoft 365 E3 and E5 subscriptions. For a 50-user deployment already on Microsoft 365, analytics licences may already be covered - further improving the managed service's cost position relative to platforms requiring separate per-seat analytics contracts.
For a broader view on outsourced financial analytics as a strategy - including how managed providers structure data governance and pipeline maintenance across finance functions - the linked guide covers the full decision framework.
How Does Building an In-House BI Team Really Work for Mid-Market Companies?
In-house Power BI teams typically take 6-9 months to deliver the first executive-grade dashboard and cost significantly more in Year 1 than most mid-market budgets anticipate. The gap between planned and actual cost spans three distinct phases: hiring, foundational build, and ongoing maintenance.
Phase 1: Hiring (months 1-4). The talent market for certified Power BI developers tightened further through 2025 and into 2026 as demand for AI-integrated analytics roles compressed the supply of candidates combining strong DAX modelling experience with fluency in enterprise data sources such as Dynamics 365, Azure SQL, and Salesforce. Time-to-hire for a senior Power BI developer now typically runs 10-16 weeks in competitive markets — up from the 8-14 week baseline seen in prior years — extending further when the role requires regulated-industry experience. Organisations that budgeted for a 90-day hire-to-productivity window are routinely finding themselves six months in before the first production report ships.
Phase 2: Onboarding and foundational build (months 3-8). A new hire spends the first 60-90 days mapping the data landscape, establishing naming conventions, documenting source system schemas, and constructing the foundational semantic model. Business stakeholder interviews, data quality remediation, and access control configuration all precede the first production report.
Phase 3: Maintenance and scaling (ongoing). This is where in-house models face their steepest persistent cost. Once dashboards are live, business users generate a continuous stream of modification requests: new dimensions, additional filters, updated date ranges, and refresh-schedule changes. A single Power BI developer managing 12 production reports spends an estimated 40-50% of their available hours on maintenance rather than net-new development. That ratio worsens as the report estate grows.
Staff retention is the most underpriced risk in the build model. BI developer attrition in mid-market companies runs at approximately 18-22% per year (as of 2026 workforce surveys), meaning a two-person BI team can expect to lose at least one member every two to three years. Replacing a developer who designed your core semantic model is not simply a hiring problem - it is a knowledge recovery problem with an all-in cost of $45,000–$70,000 when recruiting fees, contractor cover during the gap, and the productivity ramp of a replacement hire are combined. Without comprehensive documentation (rarely prioritised during delivery pressure), a replacement hire may spend 3-6 months reverse-engineering what their predecessor built, during which production dashboards stall or degrade in reliability.
The documentation risk extends further than technical schemas. Business logic embedded in DAX measures, row-level security configurations tied to HR system attributes, and refresh credentials stored only in the departing developer's workflow represent operational exposure that is difficult to quantify until the moment of departure. Organisations that have cycled through two or more BI developers without enforcing documentation standards consistently report that switching to a managed service represents not just a cost saving, but a meaningful improvement in delivery stability.
Finance leaders scoping initial BI requirements will find the 5 Key Financial KPIs Every CFO Should Track a useful framework for communicating analytical priorities to both in-house developers and managed service teams during onboarding.
When Should a Mid-Market Company Choose Managed Power BI Over Building In-House?
The managed model wins on total cost in the majority of mid-market scenarios. But total cost is not the only variable. Understanding which factors genuinely favour each model avoids over-simplifying a decision with long-term strategic consequences.
Choose a managed Power BI service when:
You need production dashboards live within 60 days, not 6-9 months
Your active Power BI user base is under 40-50 people across all business units
Your data stack is Microsoft-native: Azure SQL, Dynamics 365, SharePoint, Teams, or Fabric
You have experienced BI developer attrition before and cannot absorb another knowledge-loss cycle
Compliance documentation, audit trails, and access-control governance are firm requirements rather than optional enhancements
Your analytics workload is project-based and variable rather than a constant high-volume stream of ad-hoc requests
Choose an in-house team when:
Your Power BI user base exceeds 80 active users and daily ad-hoc volume justifies dedicated internal support
Your data environment involves on-premises sources that a remote provider cannot access securely
Your organisation is building a proprietary analytics product rather than operational reporting dashboards
You have budget for 2+ senior FTEs and a BI programme manager to coordinate roadmap governance
A third option worth considering is the hybrid model: an internal data analyst or BI lead managing stakeholder relationships and business requirements, paired with a managed service handling technical delivery - data modelling, pipeline management, and report engineering. This arrangement typically costs $180,000-$240,000 per year, above the pure managed model but preserving in-house capability development over time. A concrete example: a 450-person professional services firm retaining one internal BI analyst at $80,000 base (roughly $104,000 total compensation including overhead) alongside a $5,000/month managed service retainer spends approximately $164,000 annually — a middle path that keeps institutional knowledge and stakeholder relationships in-house without the full cost and attrition risk of a dedicated two-person technical team. Many mid-market companies use the hybrid model as a transitional arrangement while building internal analytics maturity before making a permanent build-or-buy decision.
For most companies in the 200-1,000 employee range, the fully managed model maintains a clear cost advantage through Year 3 unless active user count grows substantially above 80 and dashboard complexity reaches enterprise scale.
What Are the Hidden Costs of In-House BI in Regulated Industries?
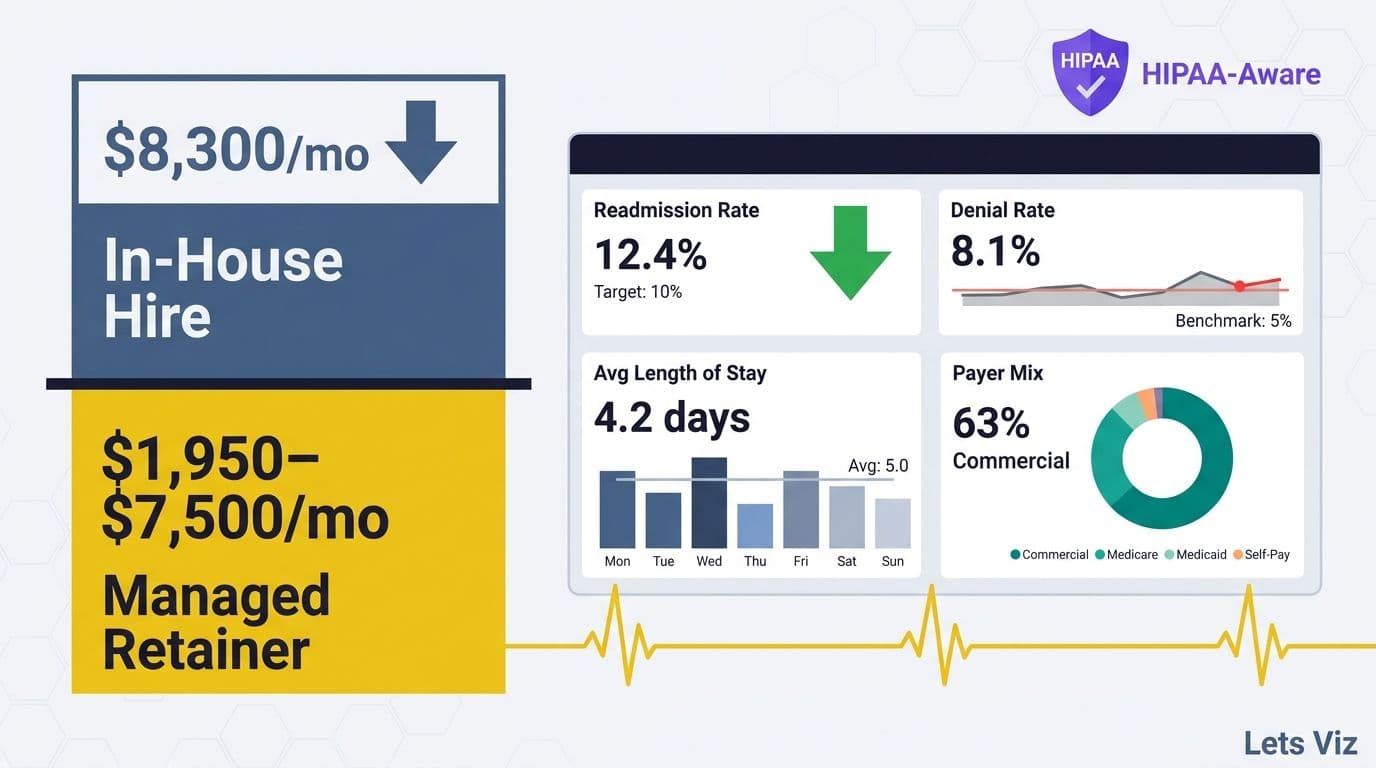
Regulated industries - healthcare finance, banking, insurance, and public sector - face compliance requirements that inflate in-house BI costs significantly beyond the baseline figures in the comparison table above.
The Healthcare Financial Analytics Market is projected to grow at an 8.58% CAGR from 2026 to 2035, according to Market Research Future (2026), driven by regulatory pressure, payer analytics complexity, and demand for real-time financial visibility across provider and health system organisations. That sustained growth intensifies competition for analysts who simultaneously understand data infrastructure and compliance requirements - a combination commanding a material salary premium above standard Power BI developer market rates.
In healthcare finance specifically, row-level security configuration in Power BI must align with HIPAA data-access policies for any report touching patient financial data. Documented access logs, role-based control mapping, and formal audit trail maintenance add an estimated 15-25% to the time cost of every dashboard project. This overhead is rarely captured in initial hiring budgets and is not adequately addressed by a general Power BI developer without specialist governance training.
Financial services organisations face equivalent compliance pressures. Regulators increasingly require firms to demonstrate that analytics outputs are reproducible, auditable, and formally documented. A Power BI developer without data governance experience represents a measurable risk in a regulatory review — a gap that typically surfaces at the least convenient point in an examination cycle. Post-examination remediation of BI governance deficiencies — rewriting undocumented DAX logic, reconstructing access logs, and engaging external data governance consultants — routinely costs $40,000–$90,000 and is rarely budgeted in the original BI hiring plan.
For organisations approaching a regulatory review, a CFO's AI risk checklist for Power BI covers six specific questions that auditors are likely to raise about Power BI implementations in 2026. Most relate directly to governance practices that managed service providers with regulated-industry specialisation include as standard deliverables rather than billable project extras.
How Does Power BI Total Cost of Ownership Compare Across BI Platforms?
Power BI offers the lowest total cost of ownership among major enterprise BI platforms for most mid-market companies, primarily through Microsoft 365 licence bundling and the largest certified developer talent pool of any comparable analytics platform. These structural advantages compound materially over a 3-5 year programme horizon.
Mid-market finance and operations teams evaluating Power BI total cost of ownership against alternative enterprise BI platforms should assess more than headline licence fees. Integration depth, developer availability, partner ecosystem reach, and vendor roadmap alignment all affect the real cost of running a BI programme over time.
Power BI holds three structural cost advantages in the mid-market:
1. Licence bundling. Power BI Pro is included at no incremental cost in Microsoft 365 E3 and E5 subscriptions. For a 50-user deployment, this represents an annual saving of $12,000-$48,000 relative to alternative platforms that bill separately for each analytics user - a structural advantage that compounds over a multi-year programme.
2. Developer supply and hiring cost. Microsoft's certification ecosystem has produced the largest global pool of credentialed Power BI practitioners of any comparable analytics platform. Greater developer supply means shorter time-to-hire, lower contractor day rates, and more competitive managed service pricing - all of which reduce total programme cost for mid-market buyers making multi-year commitments.
3. Ecosystem integration depth. Native connectors to Excel, SharePoint, Teams, Azure SQL, Dynamics 365, and Microsoft Fabric eliminate professional services fees or premium connector charges that alternative platforms apply to equivalent integrations. For hospital finance reporting teams whose data spans ERP systems, billing platforms, and population health databases, connector breadth directly determines pipeline build time and the specialist headcount required.
According to Future Market Insights (2026), the AI consulting and analytics services market is tracking from approximately USD 14 billion in 2026 toward USD 90.99 billion by 2035 at a 26.2% CAGR, reflecting a sustained mid-market shift toward specialist managed services over internal capability build-out across technology disciplines. BI and analytics managed services are tracking an identical trajectory as organisations recognise that maintaining deep platform expertise in-house carries a higher opportunity cost than directing that internal capacity toward business decision-making instead.
For a tested assessment of which AI-assisted Power BI features deliver genuine analyst time savings in 2026, the Power BI AI features worth using analysis benchmarks Copilot and smart narrative tools on a realistic finance dataset - directly relevant to the question of whether platform AI capabilities reduce the headcount a given analytics programme requires.
---
Ready to model the build-vs-buy numbers for your specific headcount and dashboard requirements? Our Managed Power BI services team builds and maintains production-grade Power BI environments for mid-market companies in financial services, healthcare, and operations-intensive sectors - typically at 40-60% of the cost of an equivalent in-house hire. Request a scoping call to receive a tailored cost comparison for your organisation.
---
About Lets Viz: Lets Viz is a data analytics consulting firm with over eight years of experience delivering Power BI, cloud data, and analytics solutions to mid-market clients across financial services, healthcare, and retail. Our consultants hold Microsoft Power BI certifications and have deployed governance-grade reporting environments in regulated sectors including HIPAA-compliant healthcare finance and FCA-regulated financial services organisations.