Looker Studio Data Blending Limitations: What Leaders Must Know
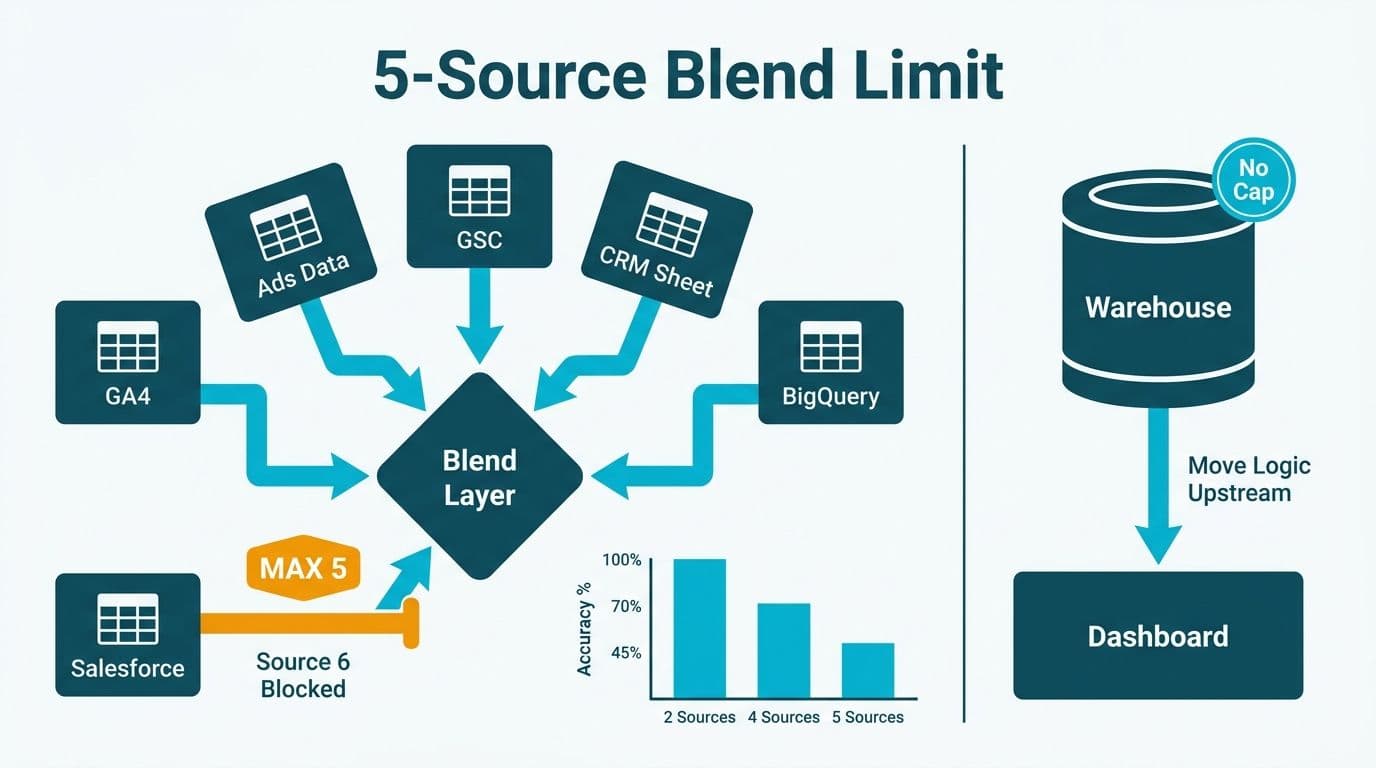
Looker Studio data blending limitations - the 5-source cap, join-key constraints, and sampling degradation - are enforced at the report layer and cannot be configured away. As your data stack grows, these constraints quietly break report accuracy and slow dashboard performance. Knowing when to move blending logic upstream into a warehouse is the most consequential architectural decision for any scaling team.
Key Takeaways
Looker Studio caps blends at five data sources per chart; a sixth source requires upstream consolidation or a separate report.
Join keys must exist identically across all participating sources - mismatched formats or missing keys cause silent data omissions, not visible errors.
Sampling activates at roughly 500,000 rows per source, compressing blended results in ways that fail healthcare and finance accuracy requirements.
Pre-aggregating sources in BigQuery views and normalizing join keys upstream are the highest-leverage workarounds before a full warehouse migration.
Multi-region teams subject to HIPAA, GDPR, or PIPEDA should treat complex blending as a warehouse responsibility, not a reporting-layer task.
What Are Looker Studio Data Blending Limitations?
Looker Studio's data blending feature joins up to five data sources on a single chart or table using a shared dimension - a concept borrowed from SQL JOIN logic but executed entirely inside the reporting layer. The appeal is real: no ETL pipeline, no engineering ticket, no warehouse dependency. A finance director can blend Google Analytics 4 traffic data with a CRM export and a budget sheet in under an hour.
The problem is that the blending engine was designed for convenience, not scale. Its constraints are fixed by the platform and apply equally whether you are a two-person startup or a 5,000-seat hospital system. Teams that encounter these walls mid-project - often during a board-level dashboard build or a regulatory reporting cycle - face a disruptive choice: redesign the data architecture or accept degraded output.
Working with a Certified Looker Studio consulting partner before dashboard construction begins is the most reliable way to identify which of your planned blends will hit these limits and design the data layer accordingly.
What Is the 5-Source Blend Cap and How Does It Constrain Reports?
The 5-source cap is Looker Studio's hard limit on how many data connectors can participate in a single blend. Each unique connection - a BigQuery table, a Google Sheet, a Salesforce connector, a PostgreSQL query - counts as one source. When a finance team needs to combine revenue figures, headcount data, budget targets, FX rates, and a marketing attribution model into a unified P&L view, all five slots are consumed before any additional context can be added.
The cap produces two common failure modes in mid-market organizations.
Silent exclusion. A report editor adds a sixth source to an existing blend, and Studio either ignores it or throws a non-descriptive error. Report consumers reviewing the output may not notice that an entire dimension has been dropped from the analysis.
Report proliferation. Teams work around the cap by building multiple overlapping reports, each with its own five-source blend. Governance erodes as metric definitions diverge across reports and different stakeholders cite different numbers from different dashboards.
A US SaaS finance team building a unified revenue dashboard - combining payment data, CRM pipeline, an ERP general ledger, a headcount export, and a currency-conversion reference sheet - hits the cap exactly. Adding a sixth source forces either a BigQuery consolidation step or a second parallel report that finance directors must reconcile every time they prepare board materials.
The architectural response is to pre-join sources in a BigQuery view or a Snowflake model before they reach Looker Studio. The blend then draws from one or two consolidated sources, and the cap becomes irrelevant to the end-user experience.
How Do Join Key Restrictions Cause Silent Data Loss in Blends?
Looker Studio's blending model requires every participating source to share at least one join key - a dimension that appears identically across sources and on which the engine performs a LEFT OUTER JOIN from the primary source to each secondary source.
This sounds simple but produces three classes of errors in real deployments.
Mismatched key formats
If your primary source stores dates as `YYYYMMDD` integers (common in GA4 exports) and your secondary source stores them as `YYYY-MM-DD` strings (common in CRM exports), the join produces zero matches. The chart renders with primary-source data only and empty secondary columns. No error is displayed. A CFO reviewing the report sees traffic figures alongside blank revenue cells and may attribute the gap to a data availability issue rather than a format mismatch.
Missing keys in some sources
If one of five blended sources lacks the join key entirely - for example, a budget spreadsheet that aggregates by quarter while all other sources use daily granularity - that source is silently excluded from any chart filtered to a sub-quarter date range. The report appears complete while an entire data dimension is missing.
Cardinality collisions
When a join key is not unique in a secondary source, Studio duplicates rows from the primary source. A healthcare system blending patient encounter records with a billing feed on `patient_id` will multiply encounter rows for any patient with multiple open claims, inflating encounter counts and distorting per-patient cost metrics. Under HIPAA, inflated patient-level counts feeding compliance reports represent a material audit risk, and the absence of an in-platform audit log makes it difficult to demonstrate that the error has been corrected.
For UK fintech firms operating under GDPR and for Canadian healthcare organizations subject to PIPEDA, any join key that passes personally identifiable information - even a hashed patient or account identifier - requires documented data flows. Studio's blending layer provides no native lineage or audit log for these flows. The GDPR Compliant SaaS Financial Reporting checklist outlines how to document BI data flows in a regulator-friendly format.
The practical fix is to resolve key-format mismatches in the source system or in a transformation layer such as dbt or Dataform, not inside Studio. Cardinality issues require pre-aggregating secondary sources to the correct grain before they enter the blend.
How Does Sampling Degradation Affect Blended Data Accuracy?
Sampling is the most operationally dangerous of Looker Studio's blending limitations because it degrades output without a visible warning at the chart level. When a blended source exceeds roughly 500,000 rows — a platform threshold unchanged as of 2026 — Studio applies statistical sampling to return results within its rendering timeout. The sampled figures are presented alongside exact figures from smaller sources with no visual distinction between them.
For a marketing team analyzing campaign-click volumes, a 3-5% sampling variance may be acceptable noise — translating to roughly 15,000–25,000 misattributed sessions on a 500,000-row dataset, a magnitude that most campaign teams absorb without material impact on decisions. For a hospital finance team reconciling daily claim submissions against payer reimbursements, sampling is not an acceptable rounding tolerance; it is a control failure that can mask material discrepancies in regulated financial reporting.
Sampling intensity increases when multiple large sources participate simultaneously. A three-source blend where each source exceeds 500,000 rows does not sample each source independently and then combine accurate samples. The sampling decisions interact at the join layer, and the effective accuracy of aggregated metrics at the intersection of all three sources can fall substantially below any single-source sample rate.
Detecting sampling in a blended report
Looker Studio displays a yellow "partial data" indicator in the report's top bar when sampling has been applied - but this indicator fires at the report level, not the chart level. A 20-chart dashboard with one heavily sampled blended chart shows the indicator once, leaving users to investigate which chart is affected and by how much.
Healthcare and finance teams should treat any report displaying the sampling indicator as unsuitable for regulatory filings, board presentations, or audit evidence. The correct response is to narrow the date filter as a temporary measure and to materialize pre-aggregated tables upstream as a permanent fix.
What Are the Best Practical Workarounds for Looker Studio Data Blending Limitations?
Teams that cannot immediately migrate to a warehouse-first architecture have several effective interim strategies, ranked here by impact.
| Limitation | Interim Workaround | Upstream Fix |
|---|---|---|
| 5-source cap | Split reports by data domain; link via dashboard navigation | Pre-join in BigQuery or Snowflake view |
| Join key format mismatch | Add calculated field to normalize key in each source | Transform keys in dbt, Dataform, or ETL |
| Cardinality collision | Pre-aggregate secondary sources to match primary grain | Model at correct grain in source or warehouse |
| Sampling degradation | Filter date range to keep row count under 500k per source | Materialize aggregated daily or weekly tables upstream |
| Missing join keys | Create a bridge table as a Google Sheet or BigQuery view | Add key in source system or transformation layer |
Pre-aggregation delivers the highest return per engineering hour. Instead of blending raw event-level tables in Studio, schedule a BigQuery query to aggregate each source to the daily or weekly grain the report actually requires. Row counts drop from millions to thousands. Sampling disappears. Chart load times fall from seconds to milliseconds.
Community Connectors can reduce effective source count. A custom connector that merges two closely related data sources before they enter Studio occupies only one of the five blend slots, effectively doubling the available capacity for a given report without any change to the Studio dashboard itself. A connector that pre-joins GA4 session data with campaign spend, for example, collapses two slots into one — freeing room for three additional sources where only two would otherwise fit, without any visible change to the dashboard experience.
For teams weighing whether to invest in a Looker Studio workaround versus migrating to a different reporting tool, the Looker Studio vs Power BI 2026 decision guide maps these limitations against comparable constraints in alternative platforms. Scoping the cost of a blending-architecture review is straightforward; the Looker Studio consultant cost guide for 2026 outlines what a structured engagement typically requires.
When Should Multi-Region Teams Move Blending Logic into a Data Warehouse?
Moving blending logic upstream is not always the right call, but three conditions make it the clearly correct answer.
1. Row volumes consistently exceed 500,000 per source. A Canadian financial services organization running daily reconciliation between a trading platform, a custody system, and a general ledger feed will cross this threshold on any active trading day. PIPEDA-compliant handling of account-level records demands a level of precision that report-layer sampling cannot guarantee.
2. The blend spans multiple regulatory jurisdictions. A US healthcare system with UK operations and Canadian subsidiaries faces HIPAA, GDPR, and PIPEDA obligations simultaneously. Managing data residency, lineage, and access control at the Studio blending layer - which has no native audit log, no column-level access control, and no data-residency configuration - is operationally untenable. A certified warehouse with row-level security and structured audit logging moves these controls to a layer where they can be independently verified and documented for regulators. For cost modeling across warehouse options, the Microsoft Fabric vs Synapse vs Databricks TCO breakdown provides a useful framework.
3. The blend logic is reused across multiple reports. When the same five-source blend appears in eight different dashboards with slight variations, each copy diverges over time as sources change and report editors apply local fixes. A single warehouse model - a dbt-managed view or a Dataform pipeline - becomes the authoritative source of truth. Looker Studio reports draw from it through a simple single-source connector with no blending at all.
The migration from a blended-report architecture to a warehouse-first architecture does not have to be a single large-scale replacement. In most mid-market deployments, it proceeds source by source: identify the source most likely to trigger sampling or cardinality issues, push it into a BigQuery materialized view, replace the blend slot with the materialized-view connector, and verify that chart output is unchanged. Repeat for each remaining source. The end-user experience in Studio stays consistent throughout; the data layer becomes progressively more auditable, scalable, and compliant.
A UK fintech firm operating under GDPR's data-minimization principle benefits from this architecture for an additional reason: a warehouse view can be scoped to return only the columns the report actually consumes, reducing the personal data surface area processed at the report layer. That scoping is not possible in Studio's native blending interface, where the full source schema is available to any report editor with connector access.
---
About Lets Viz: Lets Viz is a data analytics consultancy serving US healthcare systems, UK fintech firms, Canadian manufacturing organizations, and global SaaS companies since 2020. With a 5.0 Clutch rating, our team designs production-grade Looker Studio architectures, warehouse-first data models, and regulated reporting environments built to withstand HIPAA, GDPR, and PIPEDA scrutiny.
When Looker Studio's native blending layer has reached its limits, our Certified Looker Studio consulting team can assess your current blend architecture, identify sampling and join risks, and design a warehouse-first migration path that keeps your dashboards intact while making the data layer auditable and scalable.