Power BI vs Tableau vs Excel for Financial Reporting: 2026 Guide
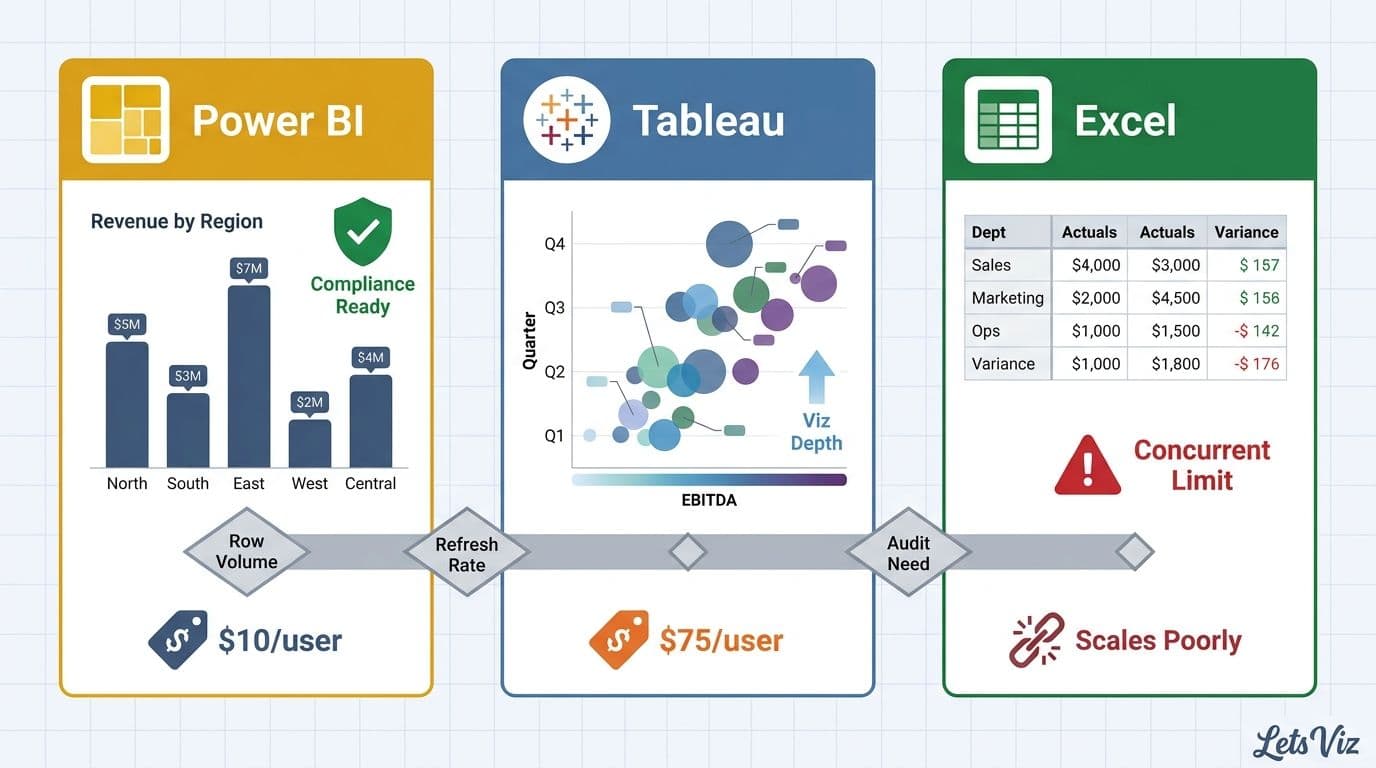
Power BI is the strongest default for Microsoft-centric finance teams — it covers compliance, live data refresh, and scalable reporting at the lowest license cost. Tableau earns its premium only if your team needs advanced visualization or works outside the Microsoft ecosystem, while Excel should stay as a complement, not a foundation, once your data exceeds a few thousand rows or multiple users need simultaneous access.
For finance organizations choosing their first BI platform, Power BI delivers the best value in Microsoft-centric environments with native compliance tooling, Tableau offers deeper visualization flexibility at a higher license cost, and Excel is essential for ad-hoc analysis but breaks down under concurrent use and growing data volumes. The right choice depends on row volume, refresh frequency, audit obligations, and how deeply your team operates within the Microsoft 365 ecosystem.
Key Takeaways
Power BI is the most cost-effective entry point for Microsoft 365 finance teams, with native audit logging via Microsoft Purview and row-level security built in at no extra cost
Tableau delivers superior visualization flexibility, favored in Salesforce environments or diverse data stacks, at roughly seven times the per-user cost of Power BI Pro
Excel hits a hard ceiling of 1,048,576 rows per worksheet and produces no user-level audit trail - factors that disqualify it from regulated financial reporting environments
Finance teams in healthcare and financial services should prioritize audit trail depth and governance controls over raw feature count when making this platform decision
Before selecting a platform, define which financial KPIs your reporting must surface - that list determines refresh frequency, row volume needs, and compliance requirements upfront
Power BI vs Tableau vs Excel: The Full Capability Matrix for Financial Reporting
Across refresh cadence, row limits, audit trail, and collaboration, Power BI and Tableau outperform Excel decisively - with Power BI winning on cost and compliance integration, Tableau on visualization depth, and Excel on accessibility for standalone ad-hoc work. The table below maps each dimension to a concrete capability across all three platforms.
| Dimension | Power BI Pro / Premium | Tableau Creator | Excel (Microsoft 365) |
|---|---|---|---|
| Refresh cadence | 8x/day (Pro); up to 48x/day + DirectQuery real-time (Premium) | Hourly scheduled extracts (Cloud); live database connections supported | Manual, or Power Automate trigger; no native scheduler |
| Row limit | ~10M rows typical (Pro, 1 GB compressed); billions of rows with Premium and aggregations | No hard limit; constrained by available RAM and extract file size | 1,048,576 rows per worksheet; no cross-sheet aggregation at query time |
| Audit trail | Microsoft Purview integration; Activity Log API; sensitivity labels; row-level security | Site Activity Admin Views; data lineage requires Data Management Add-on (extra cost) | SharePoint/OneDrive version history only; no user-level data access logging |
| Collaboration | Shared workspaces; role-based access; Teams embedding; governed app distribution | Tableau Server/Cloud shared workbooks; Slack integration; embedded views | SharePoint co-authoring; limited concurrent editing; file-based sharing creates version risk |
| Data governance | Azure AD groups; certified datasets; sensitivity label inheritance across downstream reports | Content certification; governance policies via Data Management Add-on | Manual governance; no enforced data definitions or certified datasets |
| License cost (2026) | $10/user/month (Pro); $20/user/month (PPU) | ~$75/user/month (Creator tier) | Included in Microsoft 365 Business plans |
The Healthcare Financial Analytics Market is projected to grow at an 8.58% CAGR from 2025 to 2035 (Market Research Future, 2026), reflecting demand from regulated finance teams for real-time data refresh and audit-grade data lineage that spreadsheet-based reporting cannot deliver at scale.
Consider a finance team running a monthly board pack from Excel on 8 million rows of transactional data: they will exceed the row limit, distribute files by email with no version control, and produce no audit log of who altered which figure before the report reached the board. The same workflow in Power BI runs as an automated scheduled refresh, distributes through a governed workspace, and logs every access event to Microsoft Purview.
How Does Refresh Cadence Differ Across Power BI, Tableau, and Excel?
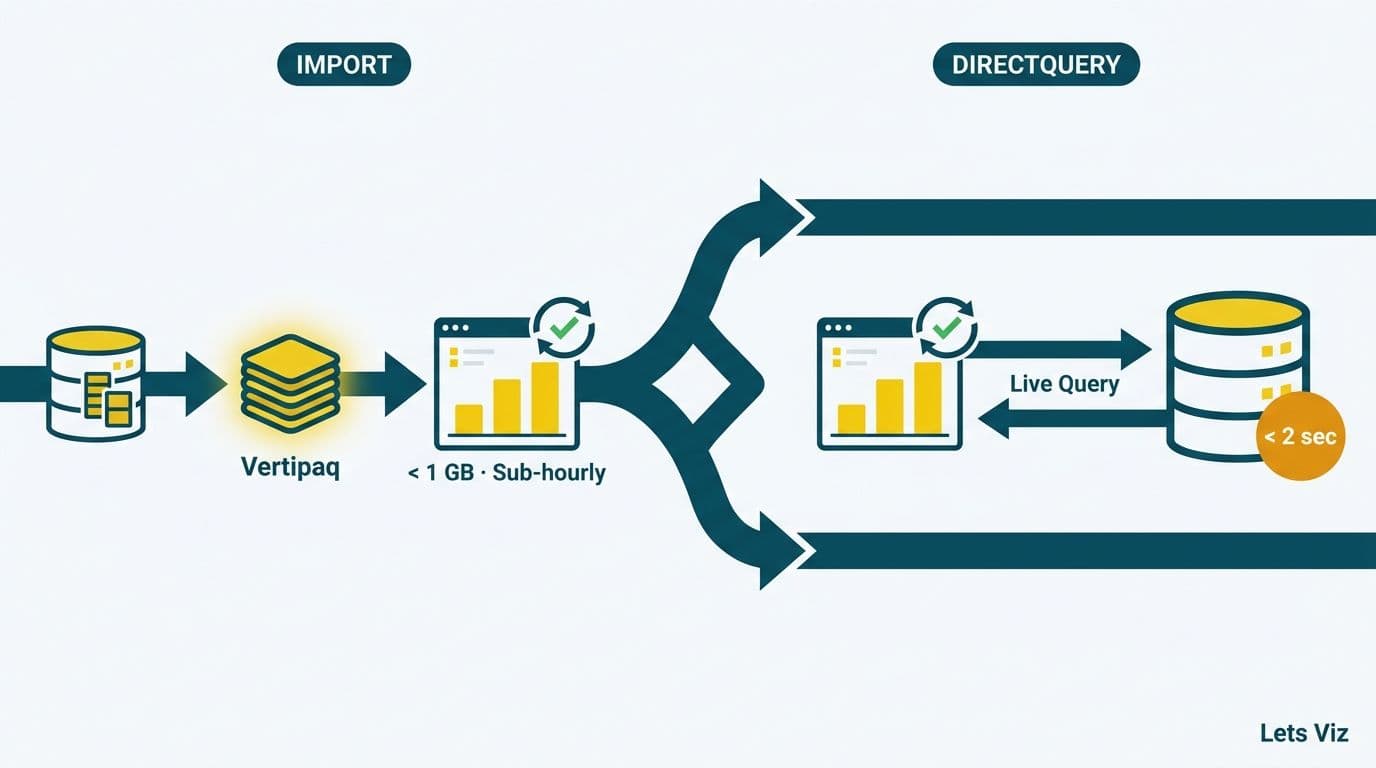
Power BI Premium supports near-real-time data currency through DirectQuery and incremental refresh policies, Tableau Cloud's minimum extract schedule is one hour on standard plans, and Excel depends entirely on manual intervention or external automation for any scheduled refresh at all.
Refresh cadence is the most operationally consequential dimension of this comparison for finance teams running daily closes, rolling forecasts, or intraday treasury positions.
Power BI offers three distinct refresh modes. Scheduled refresh on the Pro tier runs up to eight times per day - sufficient for most end-of-day finance reporting. Premium Per User (PPU) and Premium capacity support up to 48 scheduled refreshes daily, plus DirectQuery, which queries the source database live on every report load, and incremental refresh, which processes only new or changed records rather than reloading the full dataset. For a finance team managing a 50-million-row general ledger, incremental refresh can reduce dataset processing time from several hours to under ten minutes by updating only the current-period partition rather than the entire history.
Tableau supports live connections directly to databases and scheduled extract refreshes on Tableau Cloud, with a minimum interval of one hour on standard plans. Tableau's Hyper engine processes extracts efficiently, and live connections perform well against indexed relational databases - but the hourly minimum creates a latency floor for organizations needing sub-hourly data currency in treasury or cash management operations.
Excel has no built-in refresh scheduler. Power Query connections can be set to refresh on file open, and Power Automate can trigger a scheduled refresh via the Excel Online connector - but this requires a separate Power Automate license and meaningful configuration overhead that adds operational complexity rather than reducing it. In practice, Excel-based finance teams refresh manually before distribution, creating version control risk and the near-certainty that multiple copies of the same report will circulate simultaneously with different underlying figures.
According to Future Market Insights (2026), the global AI analytics and consulting services market is projected to expand from USD 12.4 billion in 2026 to USD 98 billion by 2035, driven in part by finance organizations investing in automated data pipelines that replace the manual refresh cycles spreadsheets cannot sustain as data volumes grow.
Scoping your refresh requirements starts with knowing what your reporting must deliver: What Metrics Should a Financial Reporting Dashboard Include? is a practical starting point before committing to a platform architecture.
Which Platform Has the Strongest Audit Trail for Regulated Industries?
Power BI, integrated with Microsoft Purview, provides the deepest native audit trail of the three platforms, logging every dataset refresh, report view, and data export with user identity and timestamp - capabilities that Tableau requires a paid add-on to approach and that Excel cannot replicate at all.
For finance teams operating under SOX, HIPAA, or FCA regulations, audit trail depth frequently removes Excel from consideration before any other feature comparison begins.
Power BI audit logging operates at two levels. At the platform level, Microsoft Purview Audit captures events including dataset refreshes, report views, data exports, dashboard snapshots, and workspace permission changes - all tied to Azure Active Directory user identities with timestamps and source IP address. At the data level, Row-Level Security (RLS) restricts what each authenticated user can see within a single report, and sensitivity labels from Microsoft Information Protection can be applied at the dataset level and propagated automatically to every downstream report, dashboard, and exported file. This means a 'Confidential - Board Only' classification follows a forecast figure from the data source to its final destination, regardless of how many hands touch it.
Tableau provides Site Activity Admin Views, which log content interactions, publish events, and user login activity. Full data lineage - tracing which reports depend on which data sources and which transformation steps produced them - requires the Data Management Add-on, priced above the standard Creator license. Organizations running Tableau Server on their own infrastructure gain more direct control over audit log retention periods, which regulated institutions often require for multi-year evidence storage under financial services recordkeeping rules.
Excel version history on SharePoint or OneDrive records document saves, not user-level data access events. There is no mechanism in Excel to log who viewed a cell value, who refreshed a Power Query connection, or whether a number was manually overwritten - a control gap that creates material risk in any SOX-regulated financial close process where a single altered figure in a distribution can constitute a material misstatement.
A 2026 World Economic Forum report, developed with participation from more than 50 major financial services organizations and over 100 senior data and analytics leaders, identified data lineage transparency and audit log accessibility as the compliance capabilities most frequently cited as gaps when organizations attempt to scale analytics in regulated environments.
Finance leaders evaluating their platform's compliance posture should review our CFO's AI risk checklist for Power BI, which covers the six questions auditors are most likely to raise about your BI stack.
When Should a Finance Team Move Beyond Excel for Financial Reporting?
The transition from Excel to a dedicated BI platform becomes necessary when any one of five conditions is met: routine data volumes exceed 500,000 rows, more than three analysts need concurrent report access, a regulator requests a data access log that Excel cannot produce, a single spreadsheet error has reached a board pack uncorrected, or the finance team requires AI-assisted analysis and natural-language report querying — capabilities Power BI Copilot delivers natively in 2026 that Excel cannot replicate without significant Power Platform overhead.
These conditions rarely arrive simultaneously. Most finance teams hit the collaboration wall first - Excel co-authoring on SharePoint works for simple edits but produces conflicts and corruption in workbooks combining Power Query, complex pivot tables, and cross-sheet formula dependencies. The row ceiling comes second, and in 2026 it arrives faster than it did three years ago: cloud ERP migrations to Dynamics 365, NetSuite, and SAP S/4HANA are generating transaction histories that push typical mid-market finance datasets well past one million rows, a volume that previously required a large enterprise to accumulate.
The business case for migration is direct. A finance team of five analysts spending three to four hours each per week on manual data refresh, version reconciliation, and file distribution incurs roughly 800 to 1,000 hours of lost analytical capacity per year — equivalent to half a full-time hire at median finance analyst compensation. A Power BI implementation that automates refresh and centralizes distribution through a governed workspace typically recovers that time within 90 days. The compliance dividend - clean audit logs, certified datasets, enforced row-level security - becomes visible immediately at the first regulatory review, often before a single new dashboard is built.
Excel does not retire at this transition. It remains the right tool for ad-hoc scenario modeling, one-off calculations, and exploratory analysis that precedes a formal dashboard requirement. The optimal architecture for most finance teams is Power BI or Tableau for governed reporting alongside Excel for the analytical workbench - not a binary choice that eliminates either tool entirely.
For teams exploring what outsourced financial analytics support looks like during a platform migration, specialist implementation assistance can compress a six-month internal rollout to six to eight weeks.
Which BI Tool Is Best for Healthcare Financial Analytics?
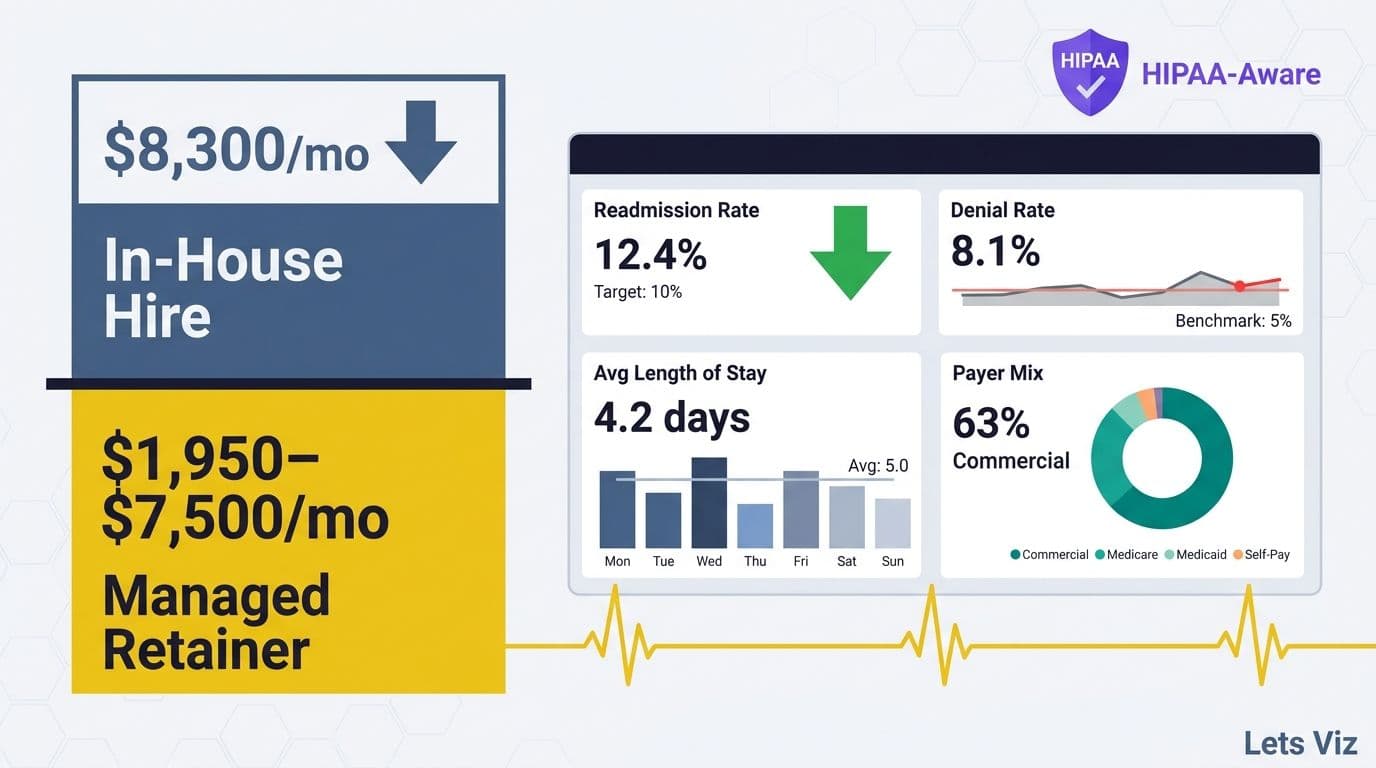
For healthcare finance teams, Power BI's native integration with Microsoft Purview and its availability under Microsoft's HIPAA Business Associate Agreement make it the strongest compliance-first choice, while Tableau's visualization depth suits clinical operational environments where data storytelling matters as much as governance.
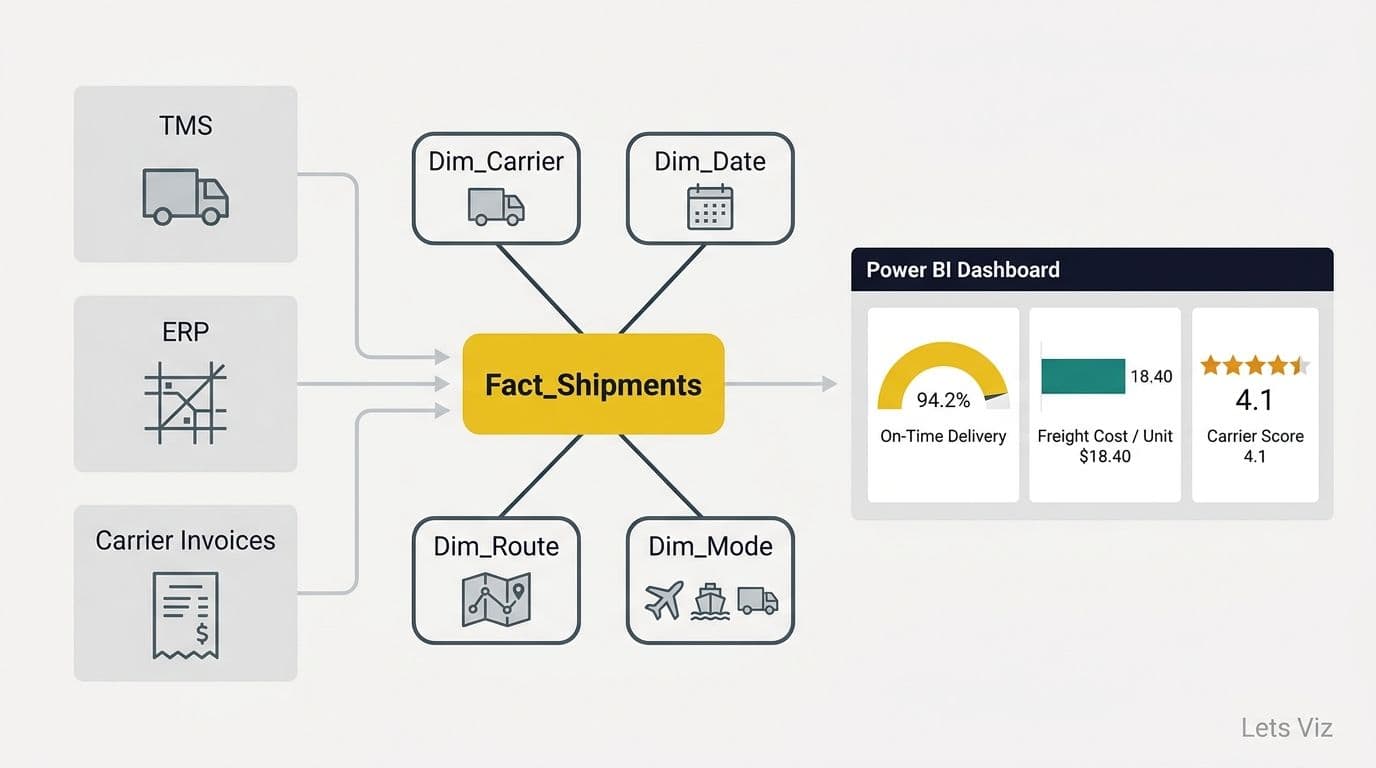
Healthcare is among the most demanding environments for BI platform selection. Finance teams in hospital networks need dashboards spanning revenue cycle management, cost per discharge, payer mix analysis, and operating margin by service line - all requiring joins across clinical and financial data at significant volume, with access restricted by department, facility, or clinical role.
Power BI meets healthcare compliance requirements through its Microsoft Purview integration and BAA availability under Microsoft's HIPAA and HITECH framework. Row-level security ensures that a regional CFO sees only their facilities' financial data within a single certified report. Healthcare KPI dashboard use cases - from denied claims tracking to days in accounts receivable to contribution margin by service line - are well served by Power BI's columnar storage engine and incremental refresh for high-volume EHR-sourced financial data. For AI analytics on hospital finance teams, Power BI's Copilot integration adds natural-language query capability directly on top of the certified semantic model. With Microsoft Fabric now generally available and embedded under Power BI's enterprise tier, healthcare finance teams gain a unified lakehouse for EHR-sourced financial data — eliminating the extract-transform handoff that previously added latency between source systems and the reporting layer.
Tableau performs strongly in clinical operational reporting environments where the audience spans clinicians, administrators, and finance staff with varying data literacy. For pure healthcare financial analytics dashboards for CFOs, Tableau's visualization advantage narrows considerably, and the licensing cost differential - roughly seven times the per-user cost of Power BI Pro - becomes the dominant factor in total cost of ownership analysis for most mid-size health systems.
According to MedInsight (2026), the three dominant themes shaping healthcare analytics in 2026 are AI-driven revenue cycle automation, value-based care performance measurement, and real-time payer analytics innovation — all generating large, multi-source datasets that require a governed BI platform with reliable refresh cadence, rather than spreadsheet-based reporting workflows.
Healthcare organizations evaluating managed Power BI services for hospital finance teams benefit from a model where a specialist firm manages the Power BI environment, maintains the semantic data model, and handles ongoing compliance controls - reducing internal IT burden while preserving the governance posture required by HIPAA and applicable state health data regulations.
---
If your finance team is ready to move beyond spreadsheets and needs a governed, scalable reporting platform, Managed Power BI services from Lets Viz provide end-to-end implementation, semantic model design, and ongoing management - so your analysts spend time on insight rather than infrastructure.
---
About Lets Viz: Lets Viz is an analytics consulting firm with over a decade of experience helping finance and healthcare organizations design, implement, and govern business intelligence platforms across the UK, US, and India. Our team has delivered Power BI, Tableau, and Excel migration engagements for clients in asset management, hospital systems, regulated financial services, and SaaS finance. We hold Microsoft data analytics and Power BI certifications and have worked in HIPAA-covered and FCA-supervised environments.