Power BI consulting for Vancouver teams — mining and resource analytics, SaaS, and BC healthcare.
Lets Viz builds, fixes, and manages Power BI for Metro Vancouver mining companies, technology and SaaS teams, healthcare organizations, and enterprise clients across BC. Remote delivery in Pacific Time. Named analyst, 2-business-day SLA on change requests, first dashboard live in 14 days. Transparent pricing: project builds from $6K USD, managed retainers from $4K USD/month — a fraction of a full-time Vancouver hire.
Trusted by technology, mining, and healthcare teams across Metro Vancouver and British Columbia
What Vancouver teams get from day one
Driving measurable success through data. We help our clients achieve improved KPIs, operational efficiency, and tangible business outcomes.
14
Days to first live dashboard
2 BD
Response SLA on managed plans
~⅓
Cost vs. a full-time Vancouver hire
PT
Pacific Time — your time zone
The problems Vancouver teams bring us
The problem
Quarterly board reports assembled manually from mine operations, commodity feeds, and treasury
Finance and operations teams doing data work instead of analysis
Your mine operations system, commodity price feed, treasury system, and capex tracker don't talk to each other. Someone spends 5 days per quarter reconciling them in Excel. Any ad-hoc board question about production variance or commodity price sensitivity triggers a fresh manual pull — and your CFO's question at 4:30 PT means the team works the weekend.
The problem
No BI analyst — and Vancouver tech hiring is competitive and expensive
Your operations or finance team doing data work instead
Senior Power BI analysts in Vancouver cost $100–140K CAD/yr, and the best ones get multiple competing offers in a tight tech labour market. The hire takes 3-4 months and doesn't solve the problem the week you need a board-ready dashboard. We are available now.
The problem
Reports built by an offshore team, PT timezone does not work
12-hour lag on every urgent production or investor ask
Your commodity prices move at market open and your dashboard is not updated. Your mine's night shift flagged a variance at 3 AM and your analyst in Bangalore won't see it until their morning. We work PT — same time zone as your Vancouver operations and technology teams.
Not just dashboards — analytics Vancouver's mining, tech, and healthcare teams can act on
We connect and model your data sources — mine operations systems, commodity price APIs, Salesforce, Snowflake, SaaS product telemetry, or EHR systems — and build the semantic model first, so every report answers real business questions rather than just displaying numbers.
Vancouver's dominant sectors have unique requirements: mining production and cost analytics, commodity price sensitivity modelling, OSFI-equivalent BC securities reporting, SaaS revenue metrics, and PIPA/FIPPA-compliant healthcare dashboards. We've built all of them and won't oversell what Power BI can do versus what needs an upstream data layer.
Your dashboards are built for the people who read them — the mining CFO sees production-vs-target and C1 costs, the SaaS CEO sees MRR and NRR, the health authority sees patient volumes and operational throughput. One model, multiple audiences.
Pipelines stay green. Scheduled refreshes are monitored; if a mine operations API connection, a commodity price feed, or a data warehouse export breaks, we fix it before your team opens a blank report on Monday morning.
When we hand off, you own everything — .pbix files, documented semantic model, a training session. No lock-in. If you ever leave, nothing disappears.

Built for Vancouver's leading sectors
Can you build production, cost, and commodity analytics for our mining company?
Yes. Vancouver is the mining capital of the world — more mining and resource companies are headquartered here than anywhere else, with hundreds listed on the TSX Venture Exchange and TSX. We build Power BI models for mining operations: production-vs-target tracking, C1/C2 cost monitoring, commodity price sensitivity analysis, capital expenditure dashboards, and hedging position reporting — connected to mine operations systems like Pronto, Ellipse EAM, and JD Edwards, with board-ready exports on an automated refresh cycle.
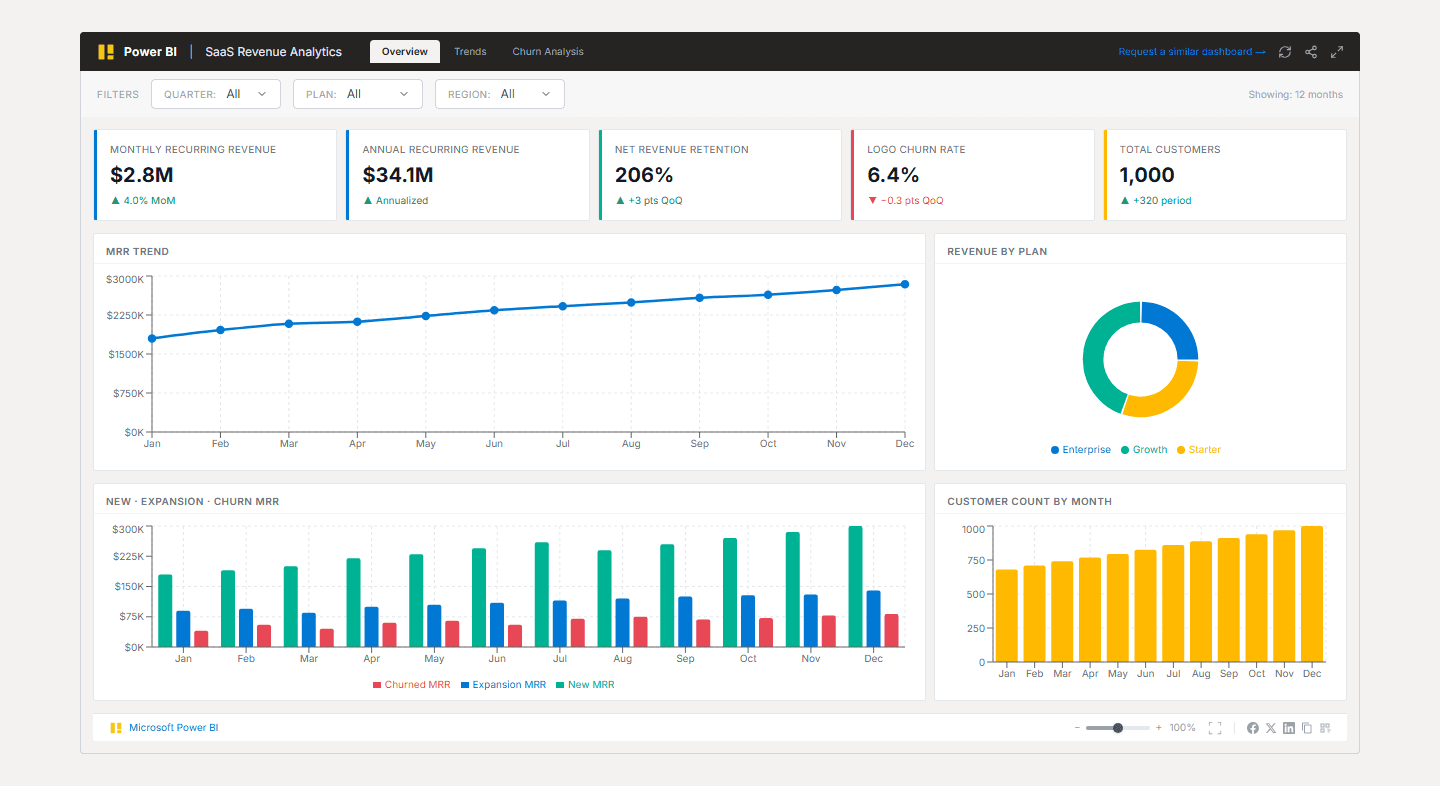
We're a Vancouver SaaS or tech company scaling fast — can you build product and revenue analytics?
Yes. Amazon's largest development office outside Seattle is in Vancouver — over 10,000 employees across their BC development centre. Microsoft, EA Canada, Hootsuite, and hundreds of SaaS companies call Metro Vancouver home. We build SaaS-native Power BI analytics: MRR, ARR, NRR, churn, feature adoption cohorts, burn rate, and sales pipeline — connected to Salesforce, Stripe, Mixpanel, and Snowflake. We understand the SaaS P&L at Series A through scale-up.
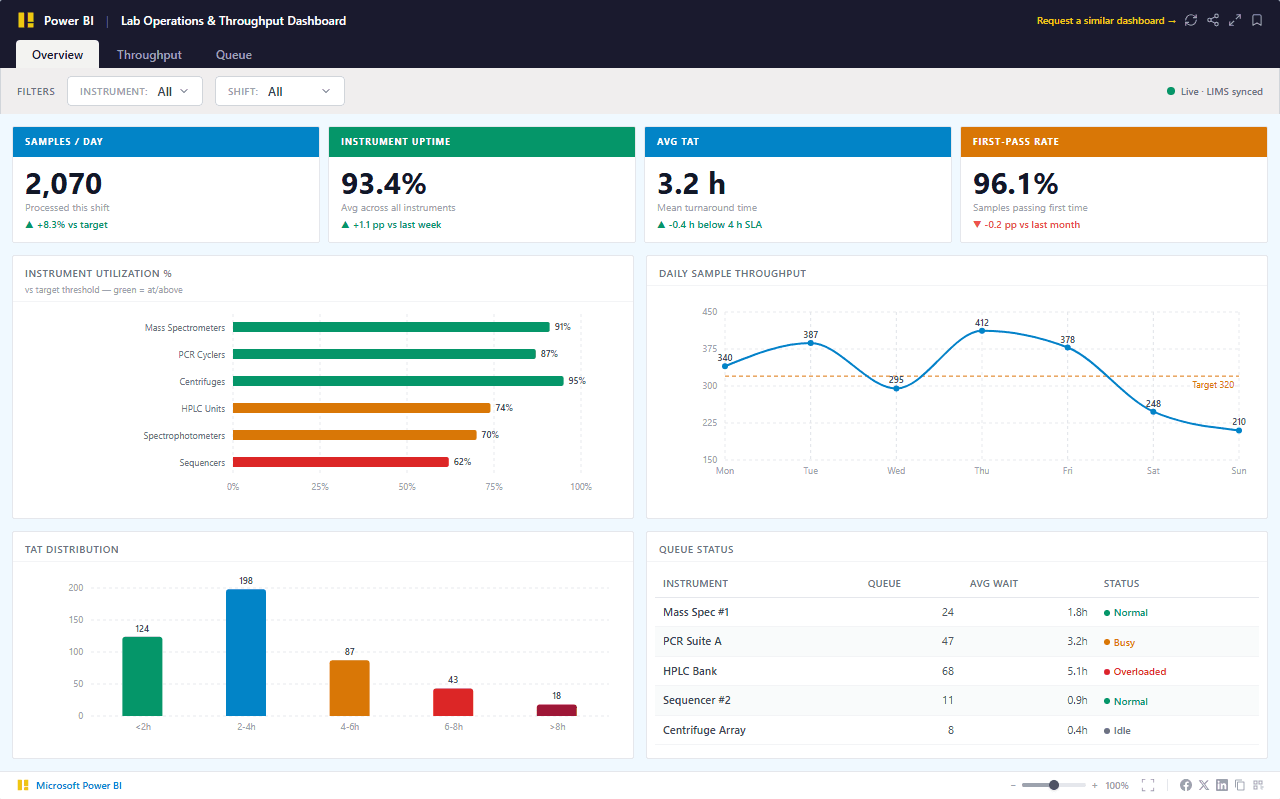
We're part of Vancouver Coastal Health or a BC health authority — can you build PIPA/FIPPA-compliant dashboards?
Yes. Vancouver Coastal Health, Providence Health Care, BC Cancer Agency, BC Children's Hospital, and BC Women's Hospital generate substantial clinical and operational data. BC healthcare is governed by FIPPA (for public health authorities) and PIPA (BC's private sector privacy law). We build Power BI models with row-level security so patient data only reaches authorised roles, audit logging, and no patient identifiers in cached query results — satisfying BC's privacy requirements at health authority scale.
Dashboards
Power BI Dashboards We Build for This Industry
Every dashboard below is built specifically for businesses in this market. Each one ships in 14 days — connected to your data, not a generic template.
What Vancouver clients get on a Lets Viz engagement
Our Offerings
Data modeling & semantic layer
Star-schema models built in Power BI Desktop or Fabric, with documented relationships, calculated tables, and row-level security. Handles mine production data, SaaS product metrics, and clinical records in a single unified model.

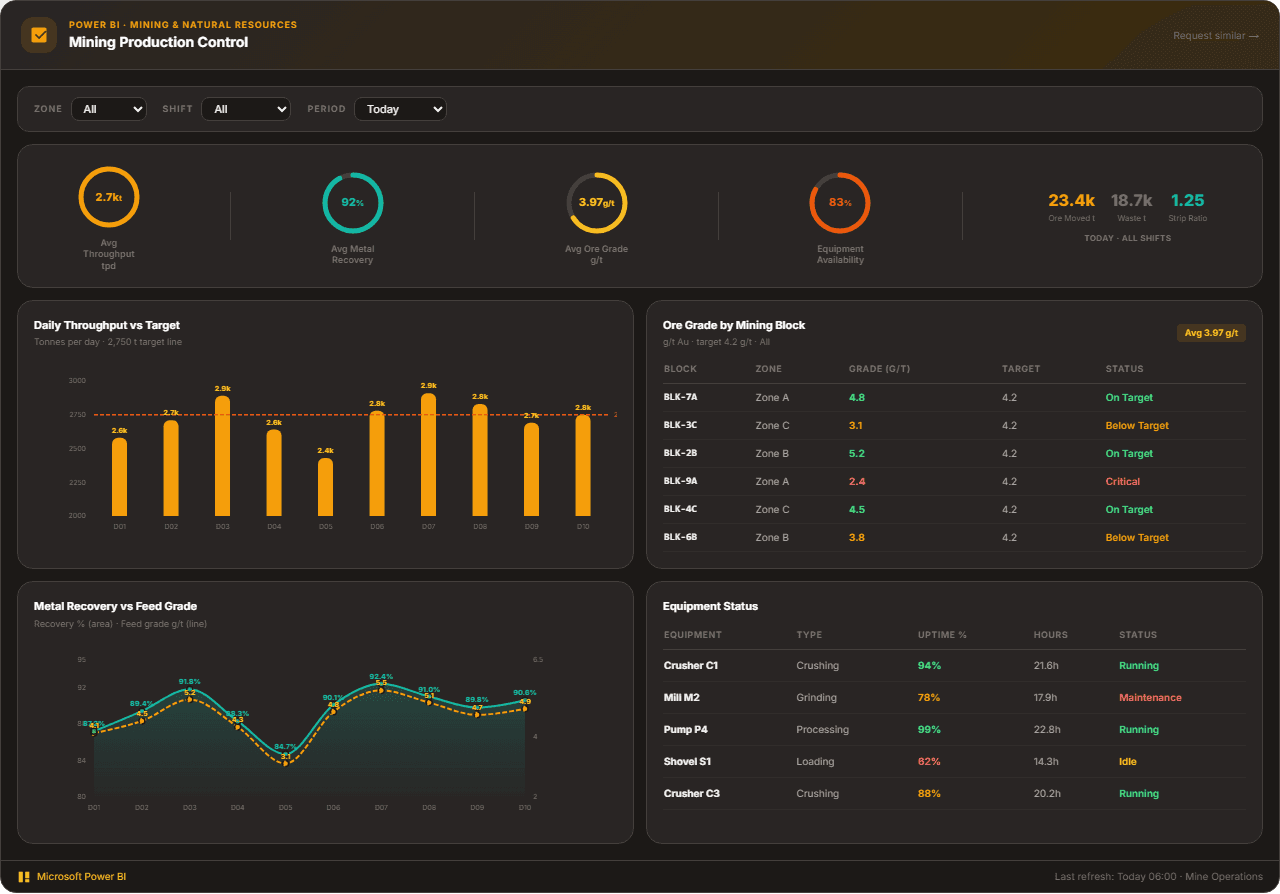
How a Vancouver-based mining company replaced quarterly commodity board reports with a live production analytics dashboard
An anonymised example from a recent engagement — same problem profile as many TSX-listed resource companies in Metro Vancouver.
The challenge
A Metro Vancouver mining company was producing quarterly board reports by manually pulling production data from their mine operations system, commodity spot prices from an external feed, and hedging positions from a treasury spreadsheet — then reconciling everything in Excel. The process took 5 days each quarter. Any ad-hoc board question about production variance or price sensitivity triggered a fresh manual export.
What we built
We built a unified Power BI semantic model connected to their mine operations system, commodity price APIs, and treasury data — with production-vs-target tracking, C1/C2 cost monitoring, commodity price sensitivity analysis, and hedging position dashboards. Board-ready exports generated automatically on a weekly refresh cycle.
Outcomes
5 days → 4 hrs
quarterly board report prep time
Real-time
commodity price sensitivity modeling
1 dashboard
replacing 6 separate manual data pulls
Built for Vancouver's dominant sectors
Natural resources & mining
Vancouver is the mining capital of the world. More mining and resource companies are headquartered in Metro Vancouver than anywhere else on the planet, with hundreds listed on the TSX Venture Exchange and TSX. Teck Resources and Wheaton Precious Metals — among the largest diversified mining and precious metals streaming companies globally — are both headquartered here. The BI requirements are specific: production-vs-target dashboards, C1/C2 cash cost tracking, commodity price sensitivity modelling, capex monitoring, and hedging position reporting. We build Power BI models for mining operations connected to systems like Pronto, Ellipse EAM, JD Edwards, and SAP PM — and we understand the board reporting cadence and investor disclosure requirements that govern a listed mining company.
Technology & SaaS
Metro Vancouver has become one of North America's most significant technology centres. Amazon's BC development centre — with over 10,000 employees — is one of Amazon's largest outside Seattle. Microsoft, EA Canada, Hootsuite, and hundreds of SaaS companies scale from Downtown Vancouver and Burnaby. These teams need SaaS-native analytics: MRR, ARR, net revenue retention, feature adoption cohorts, and burn rate — all in Power BI, connected to Salesforce, Stripe, Mixpanel, and Snowflake. The BC tech corridor also includes deep-tech companies in quantum computing and cleantech, whose BI layer needs to handle research data alongside standard commercial metrics.
Healthcare & life sciences
Vancouver Coastal Health, Providence Health Care, BC Cancer Agency, BC Children's Hospital, and BC Women's Hospital serve over a million patients and generate substantial clinical and operational data. BC healthcare privacy is governed by FIPPA (Freedom of Information and Protection of Privacy Act) for public health authorities, and PIPA (BC Personal Information Protection Act) for private sector healthcare. We build Power BI models with row-level security so patient data only reaches authorised roles, no patient identifiers in cached query results, and audit logging that satisfies BC's privacy requirements — built for the scale of the province's largest health authorities and research institutions.
What clients say
Have been working with Lets Viz technologies team for over a year now and it has been a very productive engagement. Team has a bunch of professionals who deliver on time and are always available for any questions or changes required.

Shravan Siddapurkar
Senior Director, Opsramp
They promoted outstanding communication and ensured timely delivery. Lets Viz Technologies has successfully delivered the project on time and at a high standard — exceptional communication throughout the engagement.

Andrew Fanner
General Manager, TransVirtual
Pacific Rim tech depth meets mining-grade analytical precision
Vancouver is home to one of North America's fastest-growing tech ecosystems — Amazon's largest development office outside Seattle, Microsoft, and Hootsuite all anchor the city. It is also the mining capital of the world: more mining and resource companies are headquartered here than anywhere else, with hundreds listed on the TSX Venture Exchange. We've built Power BI for both worlds.
Technology & SaaS analytics depth
ARR, MRR, NRR, product adoption, and customer cohort analytics for Vancouver's fast-growing SaaS companies — connected to Salesforce, Stripe, Mixpanel, Snowflake, and your data warehouse. We understand the SaaS P&L at Series A through scale-up.
Natural resources & mining analytics
Production-vs-target dashboards, commodity price sensitivity models, C1/C2 cost tracking, capital expenditure monitoring, and hedging position reporting — built for mining and resource companies listed on TSX-V, TSX, and NYSE.
PIPA/FIPPA-compliant healthcare analytics
BC healthcare is governed by FIPPA (public health authorities) and PIPA (private sector). We build Power BI models with row-level security, audit logging, and no patient identifiers in cached results — built for VCH, Providence Health Care, and BC Cancer.
Pacific Time, West Coast working hours
We work PT — same hours as Vancouver, Seattle, and San Francisco. No overnight lag on board presentations, investor reporting, or mining operations updates. Full morning overlap with Toronto and London.
Consulting vs. staffing agency
Consulting partner (Lets Viz)
- Outcome-scoped: pay for a working dashboard, not open hours
- Senior-only delivery — mining, technology, and healthcare depth
- Pacific Time — same hours as Vancouver, Seattle, and San Francisco
- Full documentation and model hand-off included
- Managed retainer available with 2BD SLA
- Mining-grade analytical precision at boutique pricing
Staffing agency / body shop
- Pay hourly regardless of output or quality
- Seniority varies — often get whoever is available
- Generic BI skills, no commodity or SaaS revenue depth
- 3-4 month hiring cycle before first deliverable
- Exit = starting over with next contractor
- Time zone and availability gaps common
How we compare
| What matters | RecommendedLets Viz | Local Vancouver boutique | Offshore agency |
|---|---|---|---|
| Pricing model | Fixed-scope or retainer | $130–$250 USD/hr open-ended | $25–50/hr |
| Sector depth | Mining / Technology / Healthcare | Generalist BI | |
| Time zone | Pacific Time | PT (local office overhead) | |
| Delivery speed | 14 days to first dashboard | 4–6 week ramp | |
| Ownership | Full hand-off, no lock-in | Varies |
From first call to a dashboard Vancouver leadership trusts
A strategic approach tailored to your business needs.
Day 1–2 — Discovery & data audit
We map your data sources — mine operations systems, ERP, SaaS data warehouse, or EHR — identify the highest-value reporting gap, and scope a fixed-price first deliverable.
Day 3–14 — First dashboard live
Semantic model built, pipeline connected, security configured. You see a working dashboard in your own Power BI workspace — board-ready for investor day, operations review, or clinical reporting.
Day 15–21 — Pipelines, governance & training
Automated refresh, KPI alerting, compliance documentation, and a handover session with your analysts. Nothing undocumented, nothing that creates dependency on us.
Ongoing — Managed retainer or clean hand-off
Stay on a managed plan for new reports, model changes, and a 2BD SLA — or take full ownership. We write the documentation either way.
Connects to Vancouver's tech, mining, and healthcare stacks
From mine operations systems to SaaS data warehouses — we build the pipeline, not just the report.
Mining & Resources
Pronto · Ellipse EAM · JD Edwards · SAP PM · Prometheus
Cloud & DWH
Snowflake · Azure Synapse · Redshift · BigQuery · dbt
SaaS & Product
Salesforce · Stripe · Mixpanel · HubSpot · Amplitude
Healthcare
Epic · Cerner · Meditech · Health Catalyst · InterSystems
CRM & ERP
Salesforce · SAP · Oracle · Microsoft Dynamics · NetSuite
DBs & Custom APIs
SQL Server · PostgreSQL · REST APIs · Kafka · Webhooks
What does a Power BI consultant cost in Vancouver?
Vancouver-market Power BI consultants typically charge $130–$250 USD/hr. We publish our rates — no discovery call needed to get a number.
Hourly
10-hr minimum
Best for focused fixes, mining report reviews, or DAX optimization sessions.
- DAX review or fix
- Data source troubleshooting
- Report redesign
- No long-term commitment
Project
fixed scope
End-to-end dashboard delivery for technology, mining, or healthcare teams. Fixed price, defined scope.
- Full semantic model build
- Up to 3 connected sources
- Row-level security
- Automated refresh setup
- Handover + documentation
Managed
retainer
Ongoing analyst coverage. New reports, model changes, and 2BD SLA for fast-moving Vancouver teams.
- Unlimited report updates
- Priority 2BD support
- Monthly model review
- Stakeholder-ready exports
Vancouver rates shown in USD. All engagements are remote — no local-office premium. Project rates vary by source count and model complexity.
Wondering what this would cost you?
Answer a few questions and see an honest price range on screen — no email, no call needed.
Serving Vancouver and Metro Vancouver
Locations
Other Power BI consulting locations
We serve major markets across North America — remote delivery, same named analyst, same 14-day SLA.
What Vancouver teams ask before starting

Ready to put Power BI to work in Vancouver?
30-min fit call — no pitch. We will review your current data stack, scope the first dashboard, and give you a fixed price. You decide whether to proceed. Serving Vancouver, Burnaby, Surrey, Richmond, North Vancouver, Coquitlam, Langley, Abbotsford, and Metro Vancouver — remotely on Pacific Time.