Power BI consulting for Denver teams — senior expertise in energy, aerospace, and healthtech.
Lets Viz builds, fixes, and manages Power BI for Denver-area energy operators, aerospace contractors, healthtech startups, and SaaS teams. Remote delivery in US Mountain Time. Named analyst, 2-business-day SLA on change requests, first dashboard live in 12 days. Transparent pricing: project builds from $6K, managed retainers from $4K/month — roughly a third of what a full-time Denver hire costs.
Trusted by energy, aerospace, and healthtech teams across North America
What Denver teams get from day one
Driving measurable success through data. We help our clients achieve improved KPIs, operational efficiency, and tangible business outcomes.
12
Days to first live dashboard
2 BD
Response SLA on managed plans
6+
Energy & aerospace stacks built
~⅓
Cost vs. a full-time Denver hire
The problems Denver teams bring us
The problem
SCADA and ERP data in separate silos
Leadership decisions delayed by days
Operations data, project ROI, and financial reporting live in three different systems. Leadership asks questions your team can't answer until next week.
The problem
Reporting is a full-time manual job
10–40 hrs/week of analyst time wasted
Someone on your team spends 10–40 hours a week pulling, reconciling, and formatting reports that should update themselves. That time belongs on higher-value work.
The problem
Offshore built it, now no one can maintain it
Every change takes 3 weeks
The dashboard works — barely. The consultant who built it is gone, the model is undocumented, and every change request becomes a project of its own.
Not just dashboards — analytics your Denver operations team can act on
We connect and model your data sources — SCADA historians, ERP systems, cloud data warehouses, Salesforce, Stripe, or whatever your stack runs — and build the semantic model first, so every dashboard answers real operational questions.
Energy and aerospace data has unique requirements: large time-series volumes, compliance constraints, and mixed SCADA/ERP sources. We've navigated these many times and won't oversell what Power BI can do versus what needs an upstream warehouse layer.
Your dashboards are built for the people who read them — the VP of Operations sees site-level performance vs. target, the CFO sees cost-per-unit and project ROI, the clinical lead sees patient cohort outcomes. One model, multiple audiences.
Pipelines stay green. Scheduled refreshes are monitored; if an OSIsoft PI connection, a Salesforce OAuth token, or an Azure Synapse pipeline breaks, we fix it before your team opens a blank report.
When we hand off, you own everything — .pbix files, documented model, a training session for your analysts. No lock-in. If you ever leave, nothing disappears.

Built for Denver's dominant sectors
Can Power BI connect to SCADA and historian data?
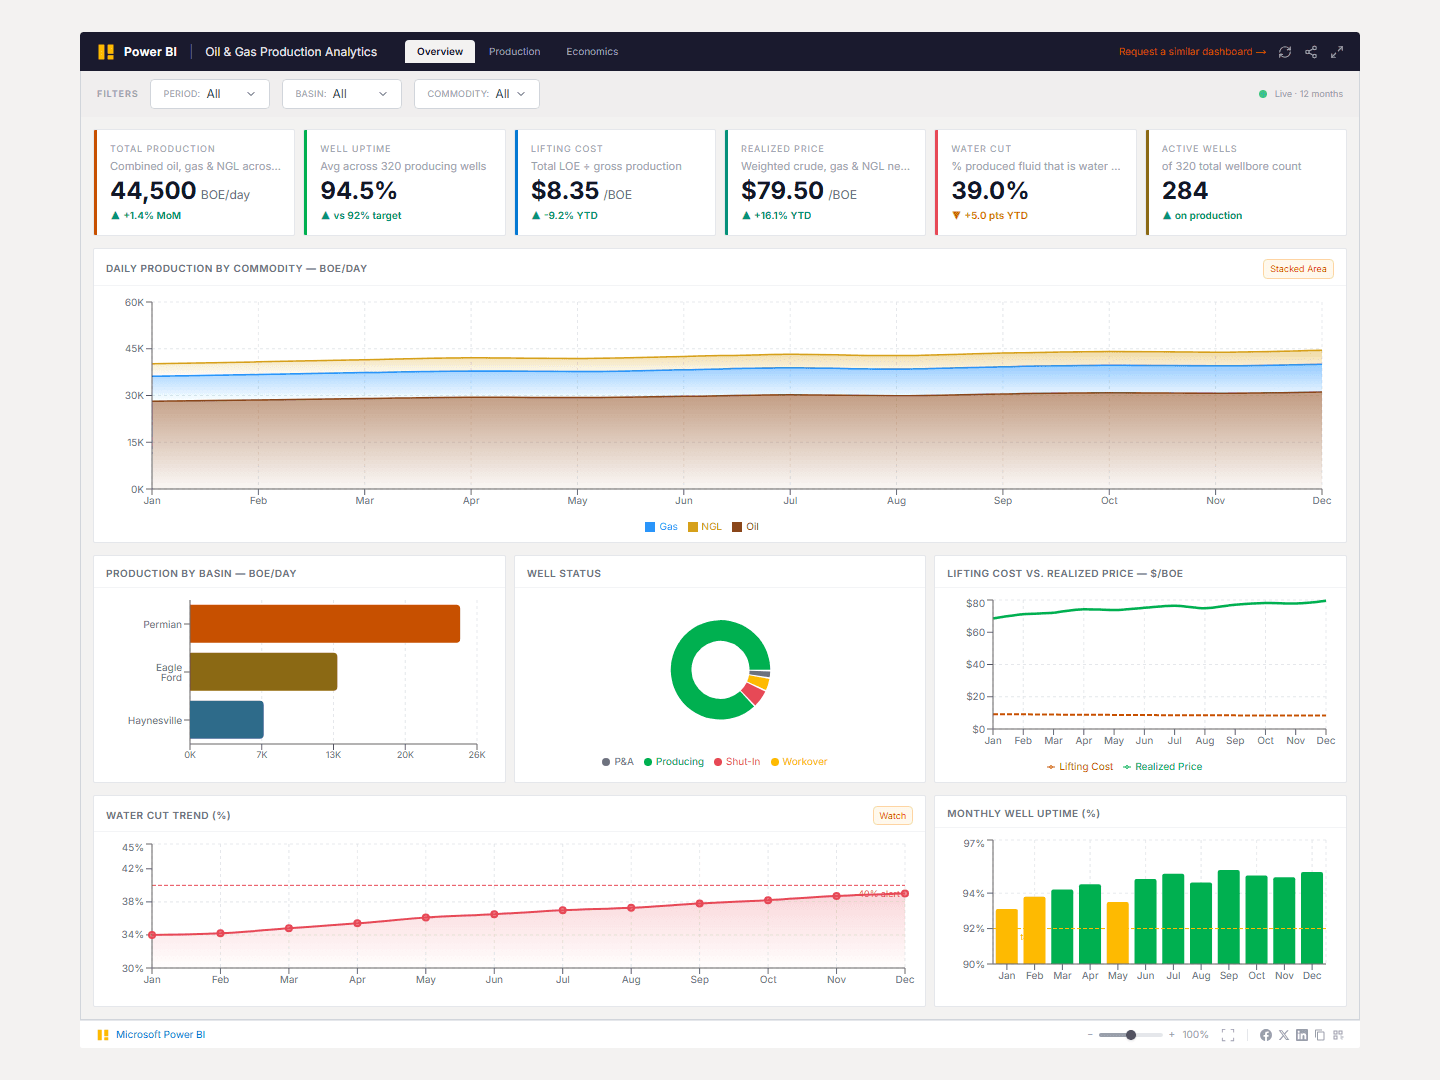
Yes. Colorado's renewable energy operators run SCADA historians like OSIsoft PI, Ignition, and AVEVA — the same platforms we build Power BI connections on top of. Generation vs. target, grid load, asset maintenance, and sustainability KPIs — live or scheduled refresh.
Can you build compliant dashboards for aerospace data?
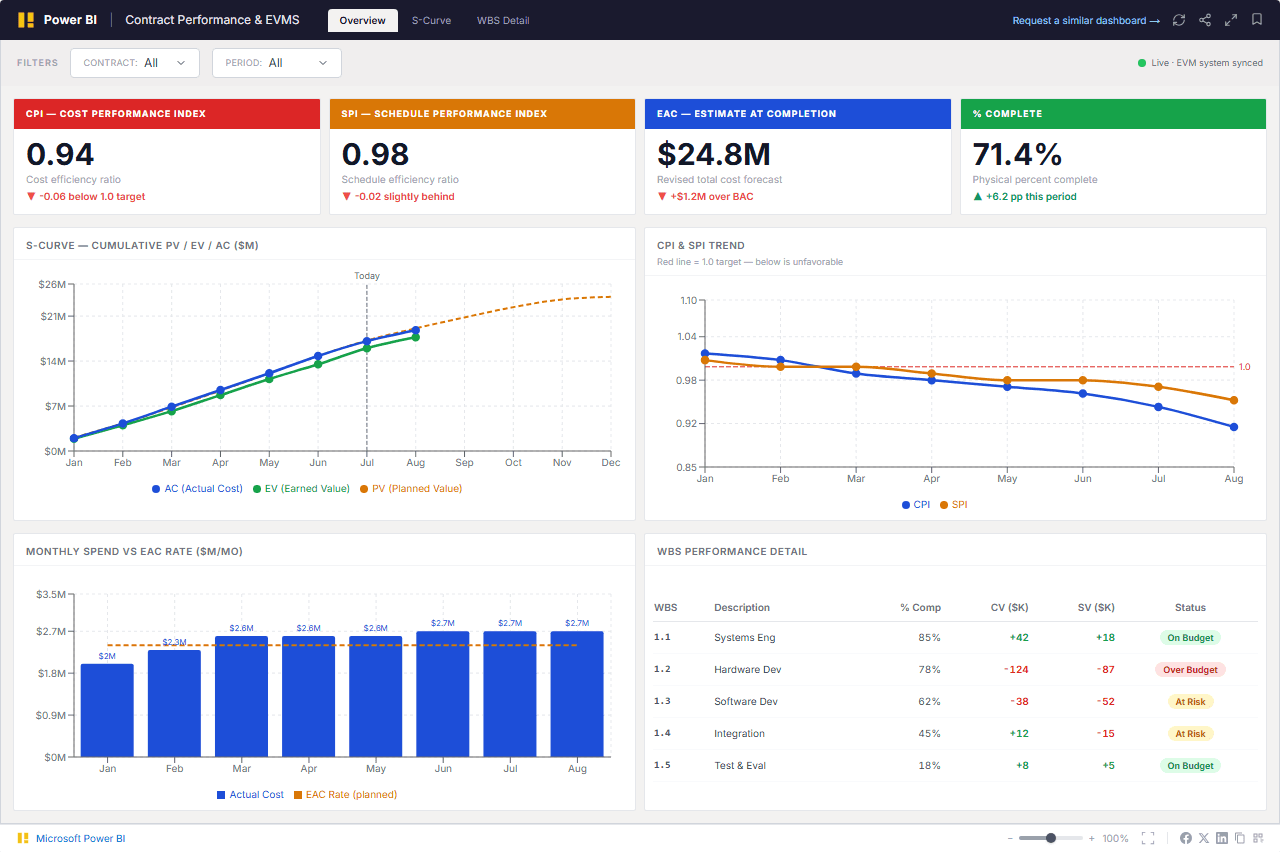
Yes. Row-level security, role-based workspace access, and audit logging for regulated environments. Supply chain, program cost, and operations dashboards on SAP and Deltek data.
Can you build HIPAA-compliant clinical dashboards?
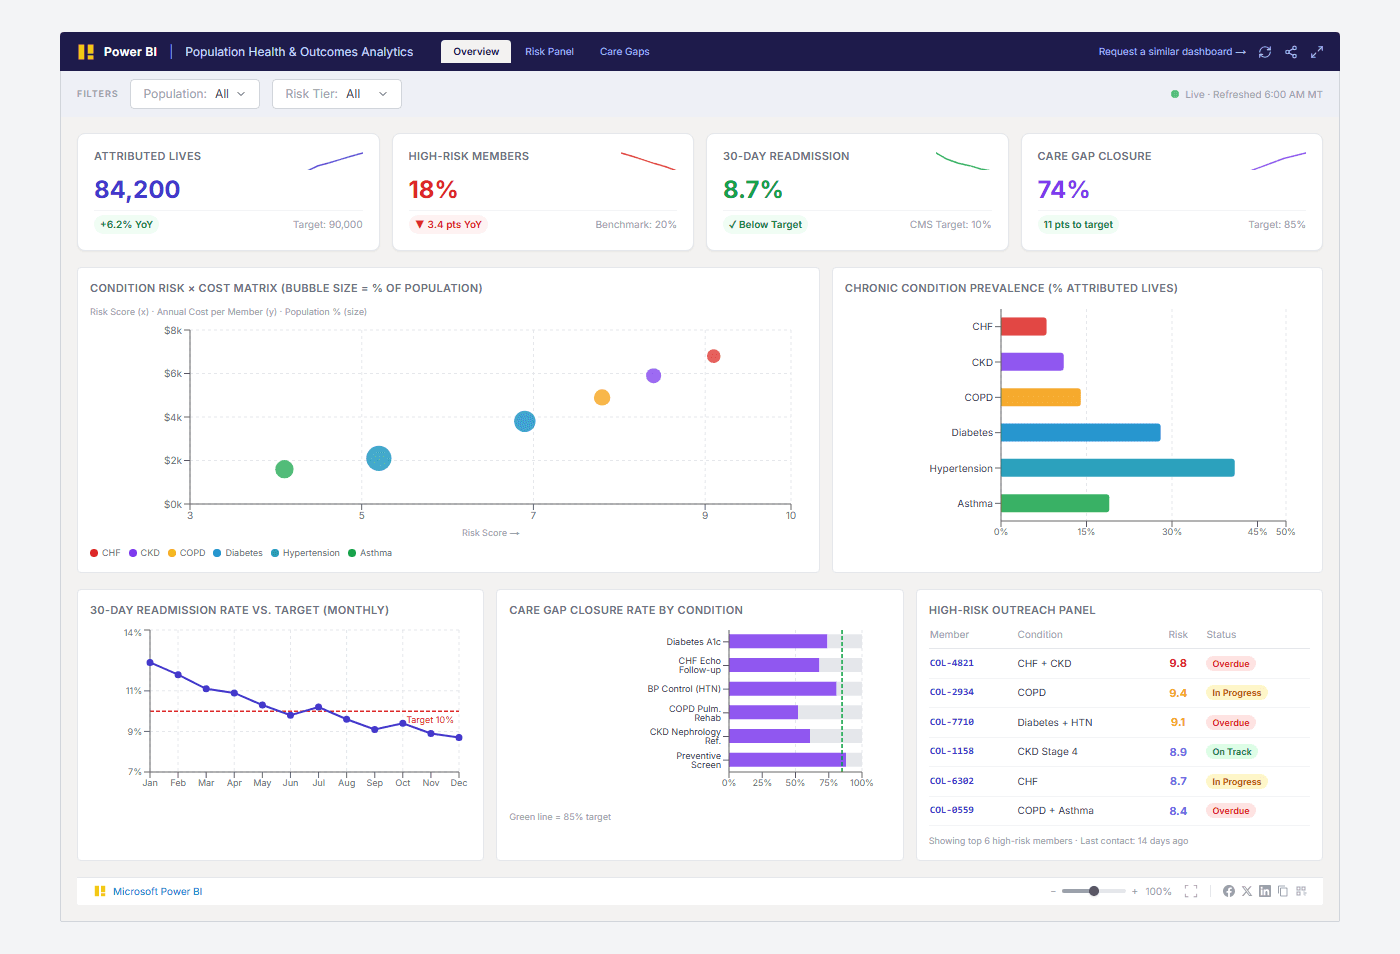
Yes. Patient cohort analytics, clinical outcomes, and cost-per-episode reporting with HIPAA-aware row-level security. Built for Denver's fast-growing healthtech sector.
Dashboards
Power BI Dashboards We Build for This Industry
Every dashboard below is built specifically for businesses in this market. Each one ships in 14 days — connected to your data, not a generic template.
What Denver clients get on a Lets Viz engagement
Our Offerings
Data modeling & semantic layer
Star-schema models built in Power BI Desktop or Fabric, with documented relationships, calculated tables, and row-level security. Handles SCADA time-series, ERP transactions, and cloud warehouse data in a single unified model.


How a Colorado renewable energy company automated 40 hours of weekly reporting
An anonymised example from a recent engagement — same problem profile as many Denver energy and industrial teams.
The challenge
A 120-person Colorado renewable energy developer was tracking generation output, maintenance tickets, and project ROI across 8 wind and solar sites — all in separate Excel files. Weekly board reporting took the ops team 40+ hours and was always 5 days behind real performance.
What we built
We connected live SCADA historian data and their project management system to a unified Power BI semantic model. Automated daily refresh, site-level performance vs. target, maintenance cost tracking per asset, and an executive summary that published itself every Monday at 6 AM.
Outcomes
40 hrs → 0
manual weekly reporting effort
8 sites
consolidated into one live model
5-day lag → live
operations data freshness
Built for Denver's dominant sectors
Energy & renewables
Colorado is one of the most active renewable energy markets in the US — wind, solar, storage, and grid integration projects are scaling fast across the Front Range. We build Power BI models on top of SCADA historians and project management systems so operations teams have real-time generation vs. target, maintenance cost per asset, and sustainability reporting without a weekly Excel pull. We've built this stack on OSIsoft PI, Ignition, and AVEVA data — and we'll tell you honestly when your data volume needs an upstream aggregation layer before Power BI can handle it reliably.
Aerospace & defense
Denver's aerospace sector — anchored by Lockheed Martin, Ball Aerospace, and a deep contractor ecosystem — generates complex program, supply chain, and operations data that needs careful data governance. We build secure Power BI architectures with row-level security, role-based access controls, and audit logging suitable for regulated environments. Manufacturing quality metrics, supply chain cost tracking, and mission operations dashboards that consolidate SAP, Deltek, and custom APIs into a single authoritative view.
Healthtech & clinical analytics
Denver's healthtech ecosystem — including well-funded companies like Strive Health, Artera, and Rightway — needs analytics infrastructure that scales from early-stage reporting to enterprise-grade clinical dashboards. We build HIPAA-compliant Power BI models with patient cohort analytics, clinical outcome tracking, cost-per-episode reporting, and payer performance views. Row-level security ensures sensitive patient data only reaches the right stakeholders.
What clients say
Have been working with Lets Viz technologies team for over a year now and it has been a very productive engagement. Team has a bunch of professionals who deliver on time and are always available for any questions or changes required.

Shravan Siddapurkar
Senior Director, Opsramp
Lets Viz built a unified Power BI model across our three data sources in under two weeks. Our operations team went from waiting 3 days for month-end reports to having live dashboards refresh every morning. Exceptional work.

James
Operations Lead, Energy Services Co.
Deep sector expertise, remote speed, zero office overhead
Denver's tech market spans energy, aerospace, healthtech, and SaaS — each with different data stacks and compliance requirements. We've built Power BI models across all four.
Energy & renewables analytics
Real-time generation tracking, grid load dashboards, and sustainability reporting for Colorado's renewable energy companies — built on live SCADA and IoT data feeds.
Aerospace & defense data governance
Secure, role-level Power BI architectures for regulated environments. Row-level security, audit trails, and compliance-ready data models for defence contractor workflows.
Healthtech scaling at Series B+ speed
Clinical outcomes dashboards, patient cohort analytics, and HIPAA-compliant data models — built to scale from 10K to 10M records without a full rebuild.
Mountain Time coverage, coast-to-coast reach
Based in MST — perfect overlap with Denver teams and West Coast stakeholders. Async updates every morning so you're never waiting on a time zone.
Consulting vs. staffing agency
Consulting partner (Lets Viz)
- Outcome-scoped: pay for a working dashboard, not hours
- Senior-only delivery — no junior handoffs mid-project
- Energy, aerospace, and healthtech sector depth
- Full documentation and model hand-off included
- Managed retainer available after project delivery
- Mountain Time coverage for Denver + West Coast teams
Staffing agency / body shop
- Pay hourly regardless of output or quality
- Seniority varies — often get whoever is available
- Generic BI skills, limited sector depth
- Ramp time 2–4 weeks before productive output
- Exit = starting over with next contractor
- Time zone alignment depends on who they place
How we compare
| What matters | RecommendedLets Viz | Local Denver boutique | Offshore agency |
|---|---|---|---|
| Pricing model | Fixed-scope or retainer | $150–$300/hr open-ended | $25–50/hr |
| Sector depth | Energy / Aerospace / Healthtech | Generalist BI | |
| Time zone | US Mountain Time | MST (local office overhead) | |
| Delivery speed | 12 days to first dashboard | 4–6 week ramp | |
| Ownership | Full hand-off, no lock-in | Varies |
Scoped in 48 hours, first dashboard live in under two weeks
A strategic approach tailored to your business needs.
Day 1–2 — Discovery & data audit
We map your existing data sources (ERP, SCADA, cloud DWH, spreadsheets), identify the highest-value reporting gap, and scope a fixed-price first deliverable.
Day 3–12 — First dashboard live
Core semantic model built, data pipeline connected, row-level security configured. You see a working dashboard in your environment — no demo environment, no mockups.
Day 13–21 — Pipelines, governance & training
Automated refresh schedules, alerting on key KPIs, gateway configuration for on-premise sources, and a 90-minute handover session with your team.
Ongoing — Retainer or clean hand-off
Stay on a managed plan for new reports, model changes, and priority support — or take full ownership with complete documentation and source files.
Connects to Denver's energy, aerospace, and healthtech stacks
From SCADA systems to cloud data warehouses — we build the pipeline, not just the report.
Energy & SCADA
OSIsoft PI · Ignition · Historian · AVEVA
Cloud & DWH
Snowflake · Azure Synapse · BigQuery · dbt
Aerospace & ERP
SAP · Dynamics 365 · Deltek · Oracle
Healthtech
Epic · Athena · Salesforce Health · Redshift
SaaS & CRM
HubSpot · Salesforce · Pipedrive · NetSuite
DBs & Custom APIs
SQL Server · PostgreSQL · REST APIs · Webhooks
What does a Power BI consultant cost in Denver?
Denver Power BI consultants typically charge $150–$300/hr. We publish our rates — no discovery call needed to get a number.
Hourly
10-hr minimum
Best for focused fixes, model reviews, or training sessions.
- DAX review or fix
- Data source troubleshooting
- Report redesign
- No long-term commitment
Project
fixed scope
End-to-end dashboard delivery. Fixed price, defined scope, no surprises.
- Full semantic model build
- Up to 3 connected sources
- Row-level security
- Automated refresh setup
- Handover + documentation
Managed
retainer
Ongoing analyst coverage. New reports, model changes, and 2BD SLA.
- Unlimited report updates
- Priority 2BD support
- Monthly model review
- Stakeholder-ready exports
Denver rates shown. All engagements are remote — no local-office premium baked in. Project rates vary by source count and model complexity.
Wondering what this would cost you?
Answer a few questions and see an honest price range on screen — no email, no call needed.
Serving Denver and the Colorado Front Range
Locations
Other Power BI consulting locations
We serve major markets across North America — remote delivery, same named analyst, same 14-day SLA.
What Denver teams ask before starting

Ready to put Power BI to work in Denver?
30-min fit call — no pitch. We'll review your current data stack, scope the first dashboard, and give you a fixed price. You decide whether to proceed. Serving Denver, Broomfield, Boulder, Aurora, Westminster, Lakewood, and the broader Colorado Front Range — remotely on US Mountain Time.