Power BI · SaaS Analytics

SaaS Revenue & Churn Dashboard

Real-time MRR, ARR, NRR, and churn intelligence — from Stripe and Salesforce to Power BI in under 48 hours.

Built for SaaS CFOs and Revenue leaders who need accurate, trusted visibility into subscription revenue health, plan-level mix, and expansion opportunity.

Powered by Power BI, connected to Stripe, Salesforce, HubSpot, and your data warehouse.
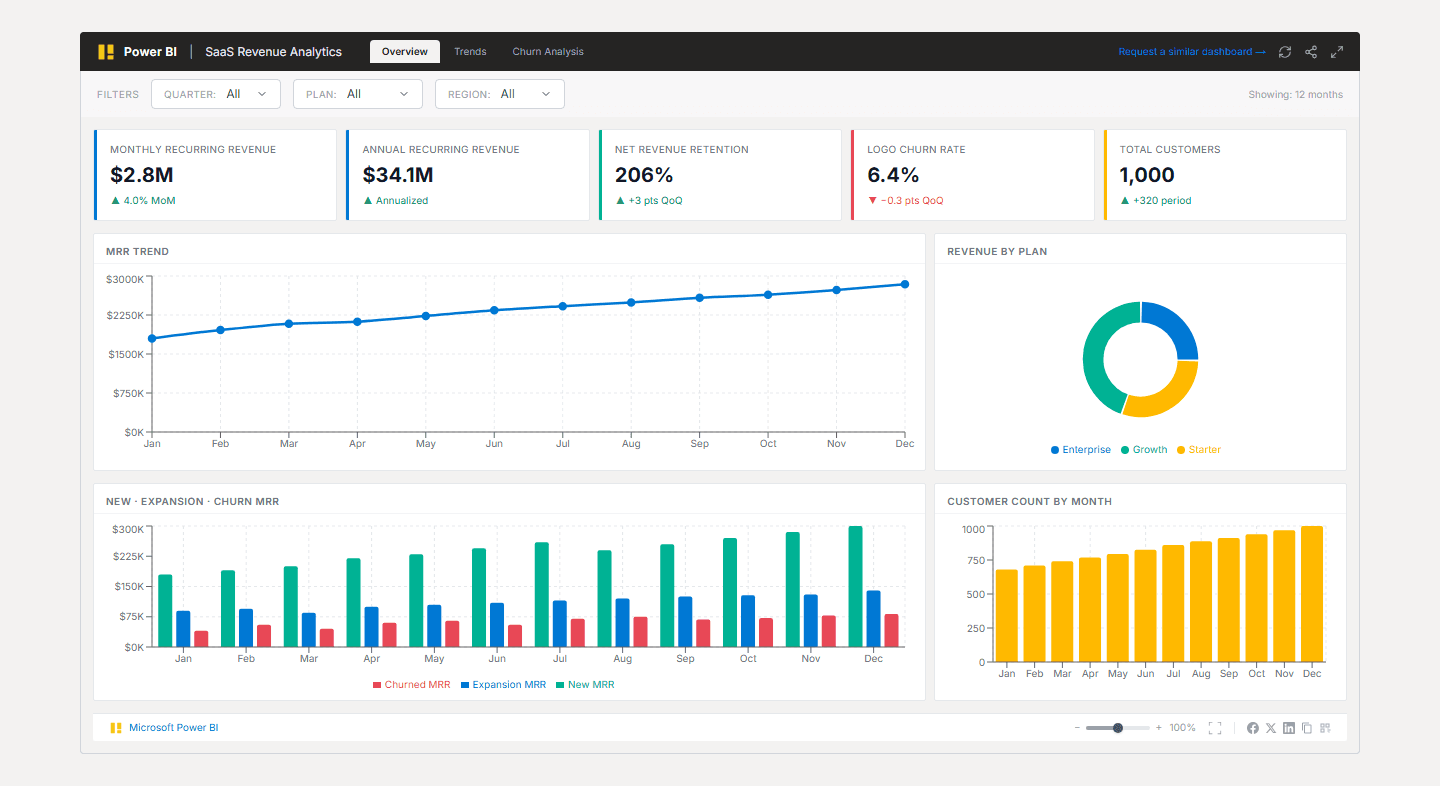
SaaS Revenue & Churn Dashboard — interactive Power BI dashboard preview

Trusted by teams across 15+ countries

100+
Clients Served
300+
Dashboards Delivered
50,000+
Hours Saved
5.0★
Rating · 15 Reviews
Trusted by teams at
Audience

Who This Dashboard Is For

Ideal For

  • SaaS CFOs and VPs of Finance who own board-level MRR and ARR reporting
  • Revenue Operations teams managing expansion, contraction, and churn waterfall
  • Growth-stage SaaS companies ($1M–$50M ARR) with Stripe + CRM as their source of truth
  • Teams who have outgrown spreadsheet-based MRR reconciliation
  • CROs and CEOs who need a shared revenue number — not three competing ones

Not Ideal For

  • Businesses on usage-based billing without a subscription component
  • Companies that already have a mature BI team and revenue data model in place
  • Pre-revenue or very early-stage startups (better to wait until $500K ARR)
By the numbers

Revenue Metrics That Drive Decisions

Five indicators every SaaS CFO and CRO watches daily — tracked in real time across plan tiers and regions.

Monthly Recurring Revenue

$2.84M

+7.2% MoM

Annual Recurring Revenue

$34.1M

Annualized

Net Revenue Retention

118%

+3 pts QoQ

Logo Churn Rate

1.3%

−0.3 pts QoQ

New MRR (period)

$300K

+11% QoQ

The problem we solved

From Fragmented Stripe Exports to a Real-Time Revenue Command Center

SaaS finance teams waste 3-5 hours per week reconciling Stripe exports, Salesforce ARR schedules, and HubSpot pipeline data — often arriving at board meetings with stale or conflicting MRR figures.

The challenge

A growth-stage SaaS company was pulling MRR from Stripe CSV exports every Monday, manually reconciling churn against Salesforce records, and calculating NRR in a shared spreadsheet — with three people producing three different numbers. Board decks were delayed two days while finance resolved discrepancies.

  • MRR, ARR, and churn figures differed between finance, RevOps, and the CEO — all from the same raw data
  • No visibility into expansion MRR by plan tier or region
  • Churn analysis was a manual 4-hour task run after month close — too late to act
  • No single source of truth for the monthly revenue waterfall

Our approach

We built a Power BI semantic model on top of a Snowflake staging layer that pulls from Stripe (subscriptions, invoices, charges), Salesforce (account and opportunity data), and HubSpot (pipeline). The dashboard calculates MRR, ARR, NRR, and logo churn using the same formulas defined with the CFO, so every stakeholder sees the same number.

  • Defined single canonical formulas for MRR, ARR, NRR, and churn — agreed with CFO before any code was written
  • Built Stripe → Snowflake pipeline with daily incremental loads
  • Power BI semantic model with row-level security (finance vs. sales view)
  • Interactive slicers for Quarter, Plan tier, and Region with full cross-filter behavior

What we achieved

MRR reporting cycle reduced from 2 days to real-time
NRR tracking went from quarterly to daily — enabling proactive expansion outreach
Logo churn identified 3× faster, reducing time-to-intervention from 45 days to 14 days
Board deck preparation time cut by 6 hours per month
Finance, RevOps, and the CEO now share one authoritative revenue number
Results verifiedRead full case study

Common Questions

Questions we hear from SaaS finance and RevOps teams before starting a revenue analytics engagement.

This dashboard connects to Stripe (subscriptions, invoices, refunds), Salesforce or HubSpot (account and opportunity data), and optionally a Snowflake or BigQuery data warehouse. We can also pull from Chargebee, Recurly, or Zuora if Stripe is not your billing system. The exact connector set is confirmed during scoping.

From Lets Viz

Ready to Consolidate Your Revenue Data?

Most SaaS teams are 5 business days away from a real-time MRR and churn dashboard. Book a free scoping call and we'll confirm your data sources, define your formulas, and estimate delivery.

NDA-safe · No obligation · Clear delivery timeline