Featured Dashboard

Mining Production & Grade Control Dashboard

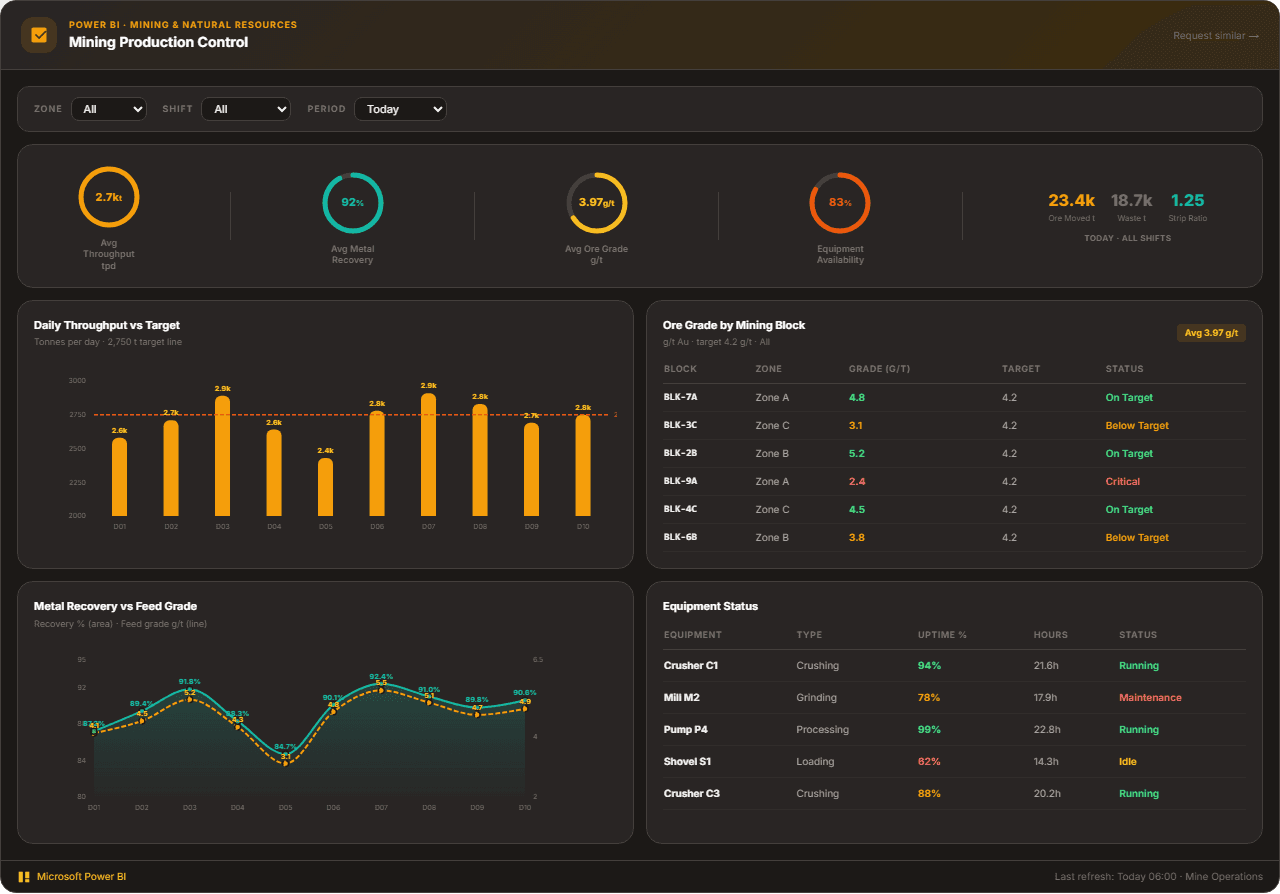
Real-time ore throughput tracking, block-level grade variance analysis, and metallurgical recovery monitoring — built to maximize mill feed quality, reduce dilution, and surface equipment availability issues before they impact production targets.

Powered by modern analytics tools including

Power BI, Tableau, Zoho and Looker.

Mining Production & Grade Control Dashboard — interactive Power BI dashboard preview

Trusted by teams across 15+ countries

100+
Clients Served
300+
Dashboards Delivered
50,000+
Hours Saved
5.0★
Rating · 15 Reviews
Trusted by teams at
Audience

Who This Dashboard Is For

Ideal For

  • Gold, copper, and base metal mining operations with surface or underground mining and milling operations
  • Mine operations managers, metallurgists, and production planning teams responsible for throughput and recovery targets
  • Vancouver- and Toronto-based mining companies with operations in Canada, West Africa, South America, or Australia
  • Teams using Datamine, Micromine, or Deswik for grade control with PI System or Ignition for operational data
  • Operations teams that need to bridge the gap between the geological resource model and actual production performance

Not Ideal For

  • Exploration or development-stage mining companies without active production — this dashboard requires operational production data
  • Coal or potash operations with fundamentally different grade control and processing models
  • Organizations without digital mine management systems or SCADA — the dashboard requires structured operational data feeds
By the numbers

Metrics That Drive Decisions

Real impact, clearly measured. These KPIs show the tangible outcomes of data-informed strategy.

Ore Processed

2,847 t/h

Current ore throughput rate through primary crusher and mill circuit

+3.5% above 2,750 t/h target

Gold Recovery Rate

91.3%

Metallurgical recovery of gold through the CIL/CIP circuit

+0.7pp vs prior month

Dilution Rate

8.2%

Percentage of waste rock mixing with ore in the mining blocks

-1.4pp vs Q3 average

Op. Cost / Tonne

$43.80

Total operating cost per tonne of ore processed including mining, milling, and G&A

-$1.20 vs last month

From challenge to success

From Shift-End Reports to Live Production Intelligence

How we turned fragmented data into a single source of truth—and what we achieved.

The challenge

Most mining operations run on 12-hour or 24-hour reporting cycles — shift supervisors compile production numbers manually, metallurgists pull assay data from spreadsheets, and management sees production performance the morning after. By the time grade variance or throughput shortfalls are visible, the production plan has already slipped. Mine management systems, SCADA historians, and lab information systems all have the data, but no single view exists.

  • Mine management systems (Datamine, Deswik, Micromine) contain the resource model and production plan but don't connect to real-time SCADA production data
  • Assay lab results arrive 8-24 hours after sampling, creating a lag in grade control visibility — blend decisions are made on incomplete data
  • Equipment availability is tracked per shift in spreadsheets, with no rolling trend visibility across fleet categories
  • Operating cost per tonne is calculated monthly in finance, not available to production teams making daily decisions

Our approach

We built a Power BI semantic model that integrates your mine management system, SCADA historian, assay lab database, and EAM into a single dashboard — refreshed hourly for shift-level production decisions and daily for management reporting. The model compares actual throughput against the production plan by block, tracks grade variance against the resource model, and monitors equipment availability to flag constraints before they cascade into production losses.

  • Connect SCADA historian (PI System, Ignition) for real-time throughput, recovery, and energy consumption data
  • Integrate assay LIMS (LabWare, STARLIMS) for block-level grade results with automated comparison to resource model grades
  • Pull equipment shift reports from CMMS (SAP PM, IBM Maximo) for availability trending by fleet type and shift
  • Calculate rolling cost per tonne using daily production volumes joined with GL actuals from ERP for near-real-time visibility

What we achieved

Mill throughput improved from 2,650 t/h to 2,847 t/h through early identification of crusher bottleneck patterns
Gold recovery rate increased 0.7pp by correlating feed grade variance with CIL residence time data surfaced in the dashboard
Dilution rate reduced from 9.6% to 8.2% by identifying high-variance blocks earlier in the grade control cycle
Unplanned equipment downtime reduced 18% through predictive maintenance scheduling based on SCADA fault pattern analysis
Production reporting cycle reduced from 24 hours to 4 hours, enabling shift-level decision-making by operations supervisors
Results verifiedRead full case study

Frequently Asked Questions

Find answers to common questions about this dashboard and our process.

We support Datamine Studio RM and NPD (via SQL Server or CSV export), Micromine Pitram (via database connector), and Deswik Suite (via export API). For SCADA, we integrate with OSIsoft PI System (AVEVA PI Web API), Ignition (REST API), and Wonderware Historian (ODBC). Assay LIMS integrations include LabWare, STARLIMS, and custom SQL-based lab databases. The integration method is confirmed in the scoping call based on your systems and network security posture.

From Lets Viz

Ready to Transform Your Data?

Let's build something extraordinary together. Book a free consultation with our experts today.