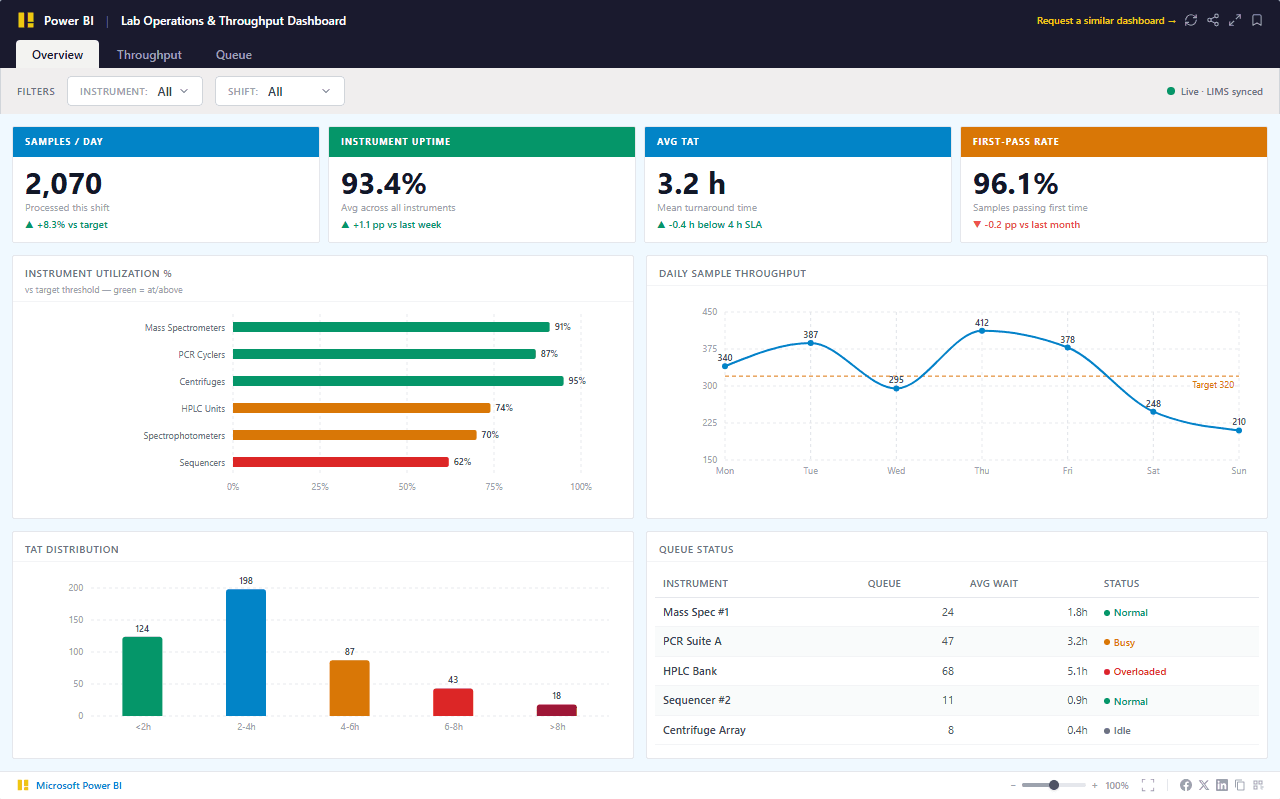
Featured Dashboard

Lab Operations & Throughput Dashboard

Real-time instrument utilization tracking, sample throughput monitoring, and turnaround time analytics — built to maximize lab capacity, reduce queue bottlenecks, and surface SLA breaches before they impact patient or study timelines.

Powered by modern analytics tools including

Power BI, Tableau, Zoho and Looker.

Lab Operations & Throughput Dashboard — interactive Power BI dashboard preview

Trusted by teams across 15+ countries

100+
Clients Served
300+
Dashboards Delivered
50,000+
Hours Saved
5.0★
Rating · 15 Reviews
Trusted by teams at
Audience

Who This Dashboard Is For

Ideal For

  • Clinical reference labs, hospital core labs, and pharmaceutical QC labs running high-volume sample testing workflows
  • Lab directors, operations managers, and shift supervisors responsible for daily throughput and TAT targets
  • Vancouver-based biotech and pharmaceutical companies with regulated analytical labs running GMP or CLIA workflows
  • Labs using LIMS systems (LabWare, STARLIMS, LabVantage, Labworks) with instrument middleware for data capture
  • Operations teams that need to move from shift-end reporting to real-time capacity and queue visibility

Not Ideal For

  • Research labs running low-volume, method-development workflows where throughput KPIs are not the primary concern
  • Labs without a LIMS or structured instrument data capture — the dashboard requires structured operational data feeds
  • Point-of-care or decentralized testing operations with no centralized sample management system
By the numbers

Metrics That Drive Decisions

Real impact, clearly measured. These KPIs show the tangible outcomes of data-informed strategy.

Samples / Day

2,070

Total samples processed across all instruments in the past 24 hours

+8.3% vs 1,910/day target

Instrument Uptime

93.4%

Percentage of scheduled instrument hours with no unplanned downtime

+1.1pp vs prior 7-day average

Avg TAT

3.2 hrs

Average turnaround time from sample receipt to result authorization

-0.4h vs 4-hour SLA target

First-Pass Rate

96.1%

Percentage of samples that pass QC on the first run without repeat testing

-0.2pp vs prior month

From challenge to success

From Lab Chaos to Real-Time Throughput Intelligence

How we turned fragmented data into a single source of truth—and what we achieved.

The challenge

High-volume labs run on a treadmill of manual tracking — shift supervisors log instrument downtime in spreadsheets, sample queues build up invisibly in LIMS work lists, and TAT breaches are discovered after the fact when a clinician or study coordinator escalates. Lab managers can tell you yesterday's throughput but not where today's queue is accumulating or which instrument is pulling down the daily target.

  • LIMS systems contain sample status and result data but provide no real-time view of instrument-level queue depth or capacity utilization
  • Turnaround time is calculated post-hoc from completed results — SLA breaches are invisible until after the result is already late
  • Instrument downtime is tracked manually per shift with no rolling trend visibility across instrument categories or time periods
  • Daily throughput targets vary by shift and day type but are not surfaced against actual performance in any operational system

Our approach

We built a Power BI semantic model that connects your LIMS, instrument data interfaces, and scheduling system into a single real-time dashboard — refreshed every 30 minutes for shift-level capacity decisions and daily for operational reporting. The model shows instrument utilization against target, tracks sample throughput by shift against daily targets, flags SLA-breaching turnaround time buckets, and surfaces live queue lengths per instrument so supervisors can redistribute load before it becomes a late result.

  • Connect LIMS (LabWare, STARLIMS, LabVantage) via database connector or REST API for real-time sample status, result, and queue data
  • Pull instrument status events from middleware interfaces (Roper MIO, Data Innovations Instrument Manager) for uptime and downtime classification
  • Build TAT calculation logic from accession timestamp to result authorization timestamp with configurable SLA thresholds per test type
  • Create shift-aware throughput targets as a configuration table so daily vs weekend targets are correctly compared against actuals

What we achieved

Daily sample throughput increased from 1,910 to 2,070 by identifying mid-shift queue accumulation patterns and redistributing instrument assignments
Average TAT reduced from 3.6 hours to 3.2 hours through early detection of HPLC bank bottlenecks surfaced in the live queue table
Instrument uptime improved from 89% to 93.4% by tracking maintenance windows against scheduled hours for trend-based PM scheduling
First-pass repeat rate reduced from 5.2% to 3.9% by correlating repeat testing spikes with specific reagent lot numbers flagged in the dashboard
SLA breach rate dropped 34% in the 6 weeks post-deployment as supervisors acted on queue alerts before results were late
Results verifiedRead full case study

Frequently Asked Questions

Find answers to common questions about this dashboard and our process.

We support LabWare LIMS (via SQL Server database connector), STARLIMS (REST API and SQL connector), LabVantage (REST API), and Labworks (ODBC). For labs using custom or legacy LIMS systems, we can connect via SQL Server or PostgreSQL database views if direct API access is unavailable. The LIMS integration scope and access method is confirmed during the scoping call based on your system version and IT network configuration.

From Lets Viz

Ready to Transform Your Data?

Let's build something extraordinary together. Book a free consultation with our experts today.