Total Production
44,500 BOE/day
Barrels of oil equivalent produced daily across all basins
▲ +2.3% MoM
Real-time Permian, Eagle Ford, and Haynesville production intelligence — from SCADA historian to Power BI in under 48 hours.
Built for E&P operators, asset managers, and production engineers who need accurate, trusted visibility into field performance, well uptime, and lifting economics across every basin.
Powered by Power BI, connected to SCADA Historian, OSIsoft PI, production accounting, and ERP systems.
Trusted by teams across 15+ countries
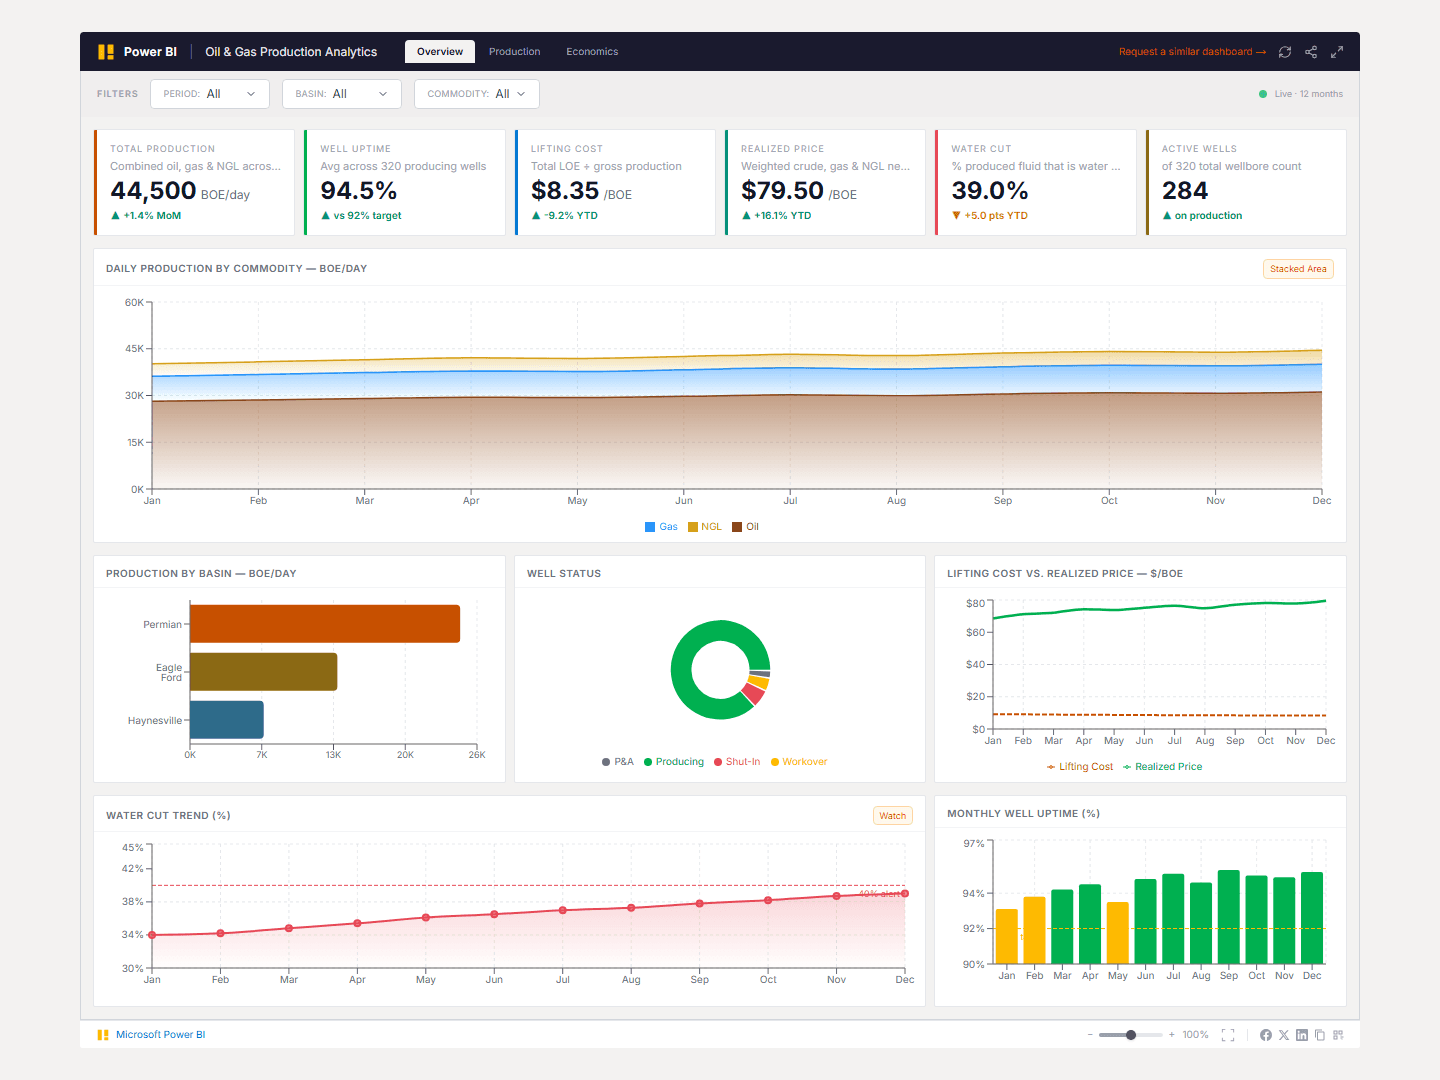
Five indicators every production engineer and asset manager tracks daily — updated automatically from your SCADA historian and production accounting system.
44,500 BOE/day
Barrels of oil equivalent produced daily across all basins
▲ +2.3% MoM
95.2%
Producing hours as % of calendar hours — target is 92%
▲ vs 92% target
$8.35/BOE
Total LOE per barrel of oil equivalent produced
▲ -9.2% YoY
118%
New reserves added vs production volume consumed this year
▲ +18 pts vs 100%
39.0%
Water volume as % of total fluid — rising trend flagged
▼ +5 pts YTD (watch)
E&P operations teams waste hours each week manually reconciling SCADA exports, well test data, and production accounting — often presenting stale field numbers to asset managers and partners.
A mid-size Permian Basin operator was pulling daily production data from three SCADA historians, reconciling against production accounting in Excel, and building asset-level reports in PowerPoint — a 3-person process that consumed two full days before every monthly asset team meeting. Numbers differed between field operations, the reservoir team, and finance, because each used a different export timestamp.
We built a Power BI semantic model on top of a unified staging layer that pulls from OSIsoft PI (real-time SCADA), ARIES/Quorum production accounting (daily volumes), and the ERP (cost allocation). The dashboard calculates BOE/day, lifting cost, well uptime, and water cut using definitions agreed with the reservoir and finance teams — so every stakeholder sees the same number.
Questions we hear from E&P operations and finance teams before starting a production analytics engagement.
We connect to OSIsoft PI (via the PI Web API), Ignition SCADA, and Emerson DeltaV for real-time production data. On the production accounting side, we integrate with ARIES, Quorum, PHDWin, and Enertia. For cost data, we connect to SAP, Oracle, or any ERP with an ODBC or REST export. The exact connector set is confirmed during scoping and depends on your existing system landscape.
From Lets Viz
Most E&P teams are 7–10 business days away from a real-time production command center. Book a free scoping call and we'll confirm your SCADA sources, production accounting system, and cost structure.
NDA-safe · No obligation · Clear delivery timeline