Revenue
$2.4M
▲ Revenue represents the total income a company generates from the sale of products or services before any expenses are deducted, providing insight into overall business performance.
A Finance Dashboard in Looker Studio empowers decision-makers with real-time insights into financial performance, enabling data-driven strategies and improved profitability. With its intuitive interface, this dashboard consolidates key metrics like revenue, expenses, profit margins, and cash flow analysis into a single, interactive platform.
Track revenue, expenses, profit margins, cash flow, and budget variance in one Looker Studio finance view.
Built in Looker Studio with finance-focused KPI tracking, CFO reporting, and drill-down analysis.
Trusted by teams across 15+ countries
Explore the core Looker Studio finance dashboard views designed for faster decision-making.
Interactive Looker Studio finance reporting view.
Open the live embedded Looker Studio finance dashboard directly in a fullscreen modal.
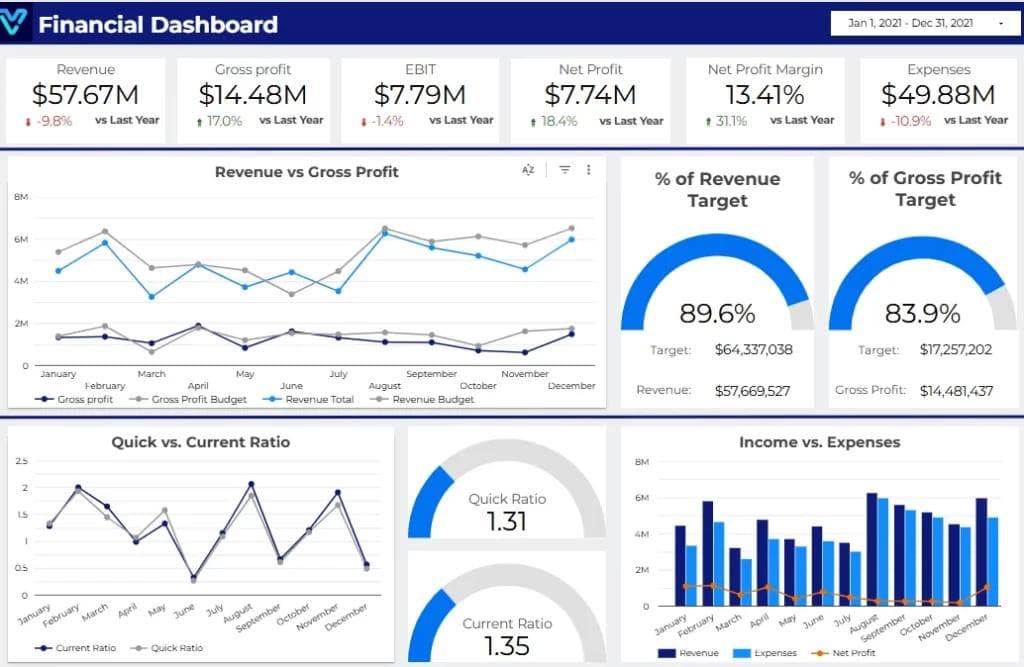
Track revenue, gross profit, EBIT, net profit, net profit margin, and expenses in one place.
$2.4M
▲ Revenue represents the total income a company generates from the sale of products or services before any expenses are deducted, providing insight into overall business performance.
18%
▲ Gross Profit is calculated by subtracting the Cost of Goods Sold (COGS) from total revenue. It indicates the basic profitability of a business before accounting for other operating costs.
$740K
▲ EBIT is a key financial metric that measures a company’s profitability from core operations, excluding the impact of interest and tax expenses. It offers a clearer view of operational efficiency.
18%
▲ Net Profit, also known as the bottom line, reflects the company’s actual profitability after accounting for all expenses, including taxes, interest, and operating costs. It is a critical measure of overall financial health.
18%
▲ Net Profit Margin is a profitability ratio calculated by dividing net profit by total revenue. This percentage demonstrates how much profit a company generates for each dollar of sales, offering insights into cost management and efficiency.
$740K
▲ Business Expenses encompass all costs incurred in the course of operating a company, including both fixed and variable costs such as salaries, utilities, rent, and raw materials. Managing these expenses is vital for maintaining profitability.
These are the practical challenges this finance dashboard is built to solve.
Finance dashboards provide real-time data visualizations, enabling businesses to monitor their financial health instantly, allowing for quick decision-making.
By consolidating financial data into easily digestible visuals, finance dashboards simplify complex financial information, making it accessible to all stakeholders.
Dashboards allow businesses to track essential financial metrics, such as revenue, expenses, cash flow, and profit margins, in real-time.
Finance dashboards foster collaboration by providing a single platform where multiple users can view, analyze, and share financial data seamlessly.
Dashboards allow for easy comparison of financial data across different time frames, helping businesses identify trends and anomalies.
Finance dashboards make it easier to track the return on investment (ROI) for different projects, investments, or marketing campaigns, providing a clear understanding of profitability.
Key Details
All major finance dashboard points summarized as concise bullets.
A visualised financial dashboard can help individuals and organisations track their financial performance over time. By visualising financial data in real-time, users can quickly see how their finances are changing and identify areas where they may need to make adjustments.
A financial dashboard can also be used for budgeting and forecasting purposes. By tracking expenses, revenues, and other financial metrics, users can create accurate budgets and forecasts for the future.
A visualised financial dashboard can help users identify trends and patterns in their financial data. By visualising data in different ways, users can spot trends that may not be apparent in raw data or traditional financial reports.
A visualised financial dashboard can also be used for financial reporting purposes. By presenting financial data in an easy-to-understand format, users can create reports that are accessible to a wider audience.
A visualised financial dashboard helps users make better financial decisions and take more calculated risks with money. With simple-to-understand dashboards, users can quickly analyze their financial situation and make more calculated decisions about investments and expenses.
How this dashboard helps teams move from fragmented finance reporting to faster CFO and leadership decisions.
Finance teams often struggle with delayed reporting, fragmented sources, and low confidence in KPI consistency.
This dashboard centralizes financial metrics in one view with real-time updates and consistent definitions. Want a Looker Studio dashboard like this for your team? See our certified Looker Studio consulting service.
Find answers to common questions about this finance dashboard.
The Finance Dashboard consolidates and visualizes critical financial data, helping businesses track performance, monitor key metrics, and make data-driven decisions to ensure financial health and growth.
From Lets Viz
Experience superior data analysis with our custom dashboards. Specializing in all tools and technologies, we turn data into visually compelling, actionable insights
NDA-safe · No obligation · Clear next steps