Sessions
$2.4M
▲ The number of visits to your website within a specific timeframe, reflecting overall traffic.
Unlock the gateway to online success with our Website Performance Dashboard! Dive into a world of real-time insights, where every click, every second counts. Discover trends, pinpoint bottlenecks, and turbocharge your site for unparalleled user experience and skyrocketing conversions.
Track sessions, users, engagement rate, conversions, revenue, and channel performance in one live GA4 reporting view.
Built in Looker Studio with GA4-focused KPI tracking for acquisition, engagement, and conversion performance.
Trusted by teams across 15+ countries
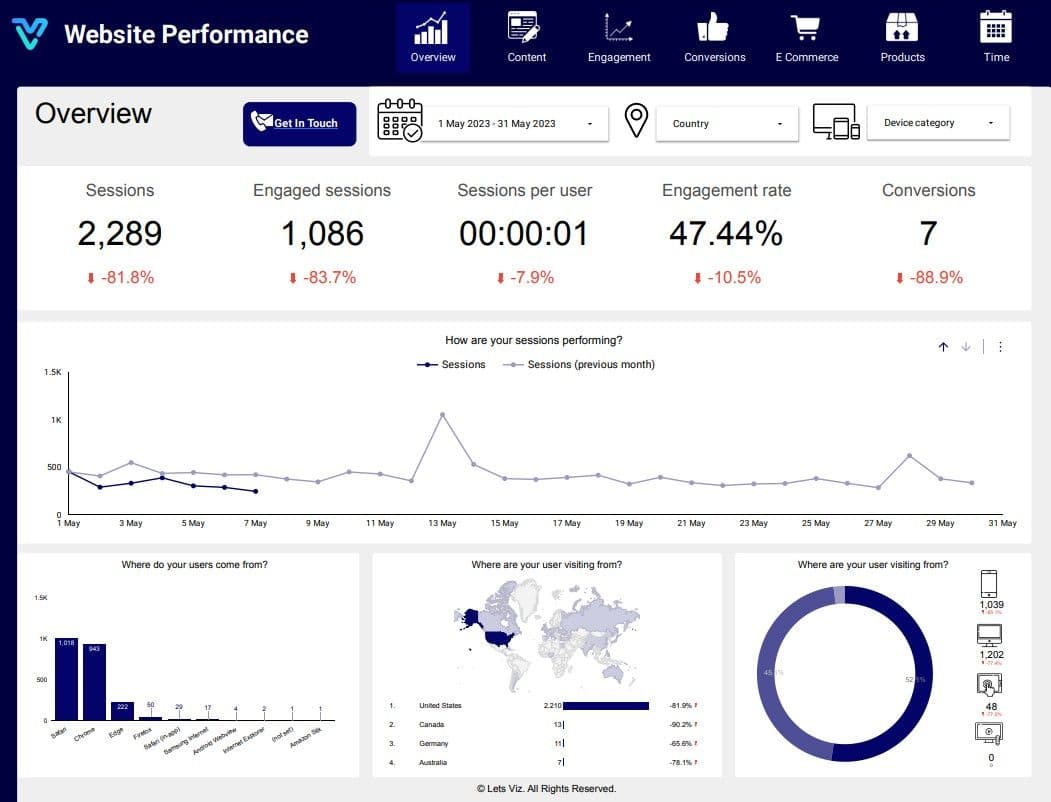
Explore the core Looker Studio GA4 dashboard views built for website and growth decisions.
Interactive Looker Studio GA4 reporting view.
Open the live embedded Looker Studio GA4 dashboard directly in a fullscreen modal.
Track traffic, engagement, conversion, and revenue KPIs in one Looker Studio GA4 view.
$2.4M
▲ The number of visits to your website within a specific timeframe, reflecting overall traffic.
18%
▲ Sessions where users actively interact with your content, indicating higher interest and potential conversion.
41K
▲ Average number of visits per individual user, revealing user retention and frequency of visits.
9.6%
▲ Percentage of engaged sessions out of total sessions, offering insights into content relevance and user satisfaction.
3.9%
▲ Instances where users complete desired actions, such as making a purchase or signing up, indicating the effectiveness of your website in meeting objectives.
41K
▲ Analysis of where your website visitors are located geographically, helping tailor content and marketing strategies to specific regions.
These are the practical GA4 reporting challenges this dashboard helps teams resolve.
The Let’s Viz Website Performance GA4 Dashboard consolidates complex website data into an easy-to-read format. It simplifies the interpretation of key performance indicators (KPIs) like page views, session duration, and bounce rates, helping businesses understand their website performance without needing deep technical expertise.
With real-time data updates, the GA4 Dashboard enables businesses to monitor their website’s performance at any given moment. This allows for the immediate detection of issues, such as drops in traffic or slow load times, so that corrective actions can be taken quickly, minimizing potential losses.
The GA4 Dashboard allows businesses to segment their audience based on user demographics, behavior, and engagement. This targeted approach empowers marketing teams to create tailored campaigns that resonate with specific user groups, improving customer engagement and ROI.
With detailed analytics at your fingertips, the Let’s Viz GA4 Dashboard empowers businesses to make data-driven decisions. From traffic sources to content performance, the insights offered help fine-tune strategies and maximize growth potential.
The dashboard provides enhanced conversion tracking, making it easier to understand how visitors interact with your site. By tracking specific user behaviors and events, businesses can optimize their website for better conversion rates, leading to higher sales and more effective marketing strategies.
One of the standout features of the GA4 Dashboard is its ability to map the entire user journey. By identifying drop-off points and understanding how visitors navigate through your site, businesses can refine their UX design, reducing bounce rates and boosting user retention.
Key Details
Key Looker Studio GA4 dashboard capabilities with context from the source page.
The number of visits to your website within a specific timeframe, reflecting overall traffic.
Sessions where users actively interact with your content, indicating higher interest and potential conversion.
Average number of visits per individual user, revealing user retention and frequency of visits.
Percentage of engaged sessions out of total sessions, offering insights into content relevance and user satisfaction.
Instances where users complete desired actions, such as making a purchase or signing up, indicating the effectiveness of your website in meeting objectives.
Analysis of where your website visitors are located geographically, helping tailor content and marketing strategies to specific regions.
How this dashboard helps teams move from fragmented analytics reporting to faster, insight-led growth decisions.
Marketing and growth teams often struggle with fragmented GA4 reporting, delayed insights, and low confidence in traffic and conversion KPI consistency.
This Looker Studio dashboard centralizes GA4 acquisition, engagement, conversion, and revenue KPIs in one view for faster growth decisions. Want a Looker Studio dashboard like this for your team? See our certified Looker Studio consulting service.
Find answers to common questions about this Looker Studio GA4 dashboard.
has context menu help you Measure clicks, bounces, email delivery rate, and engagement rate of your marketing email campaigns in a simple, easy-to-read dashboard. Compare performance over time to double-dip on your winning sequences. View Dashboard View all Frequently Asked Questions
From Lets Viz
Experience superior data analysis with our custom dashboards. Specializing in all tools and technologies, we turn data into visually compelling, actionable insights
NDA-safe · No obligation · Clear next steps