Impressions
2.8M
▲ The number of times your website appears in search results, indicating visibility and potential reach.
Dominate search with our Google Search Console Dashboard! Effortlessly track impressions, clicks, CTR, and average position. Unleash insights to optimize content and skyrocket your online visibility—all in one sleek interface. Your path to search engine supremacy starts here!
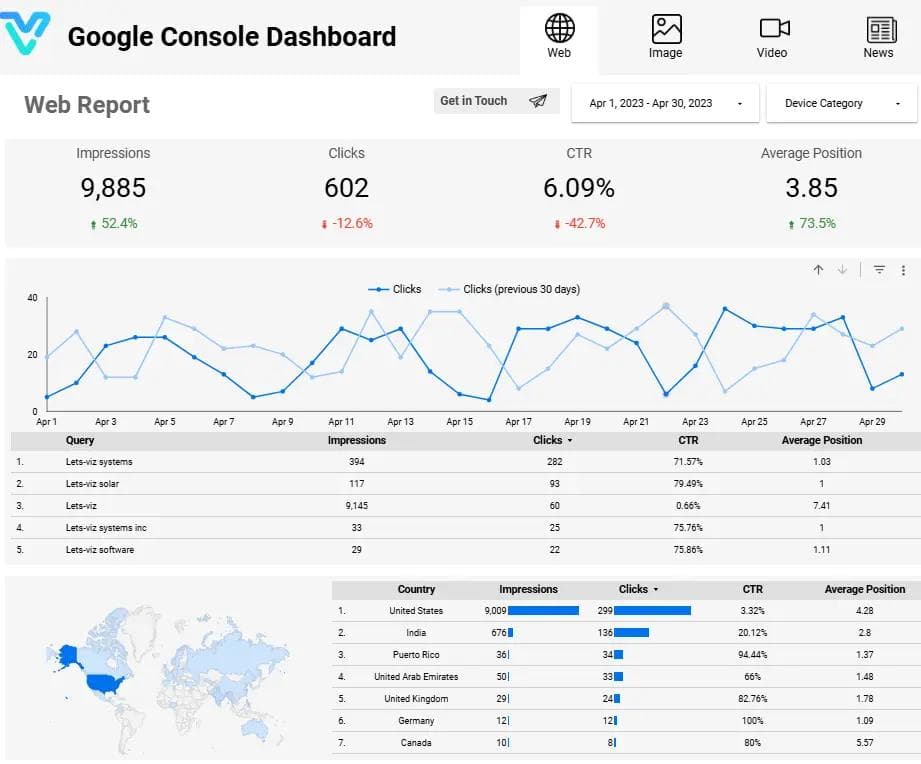
Track impressions, clicks, CTR, average position, top queries, and top pages in one live Search Console reporting view.
Built in Looker Studio with Search Console-focused KPI tracking for impressions, clicks, CTR, and ranking performance.
Trusted by teams across 15+ countries
Explore the core Looker Studio Search Console dashboard views built for SEO and organic growth decisions.
Interactive Looker Studio Search Console reporting view.
Open the live embedded Looker Studio Search Console dashboard directly in a fullscreen modal.
Track impressions, clicks, CTR, average position, and related SEO KPIs in one Looker Studio Search Console view.
2.8M
▲ The number of times your website appears in search results, indicating visibility and potential reach.
18%
▲ The average ranking of your website in search results, providing insights into visibility and competitiveness.
126K
▲ Instances where users click through to your website from search results, reflecting traffic driven by search engines.
24%
▲ Analysis of performance metrics segmented by geographical location, aiding in localized SEO strategies and targeting.e.
126K
▲ The percentage of clicks compared to impressions, revealing the effectiveness of your search snippets in enticing clicks.
2.1x
▲ A structured display of performance data in table format, facilitating easy comparison and analysis of KPIs over time and across different dimensions.
These are the practical Search Console reporting challenges this dashboard helps teams resolve.
Google Search Console Dashboards help monitor how well your website is performing in search results, giving you access to crucial metrics like clicks, impressions, and average position.
You can easily identify which search queries are driving traffic to your site, helping you optimize your content for high-ranking keywords that matter most.
By identifying high-traffic pages and underperforming content, dashboards give you insights into areas where you can improve your content strategy for better results.
Dashboards show how your pages are performing in terms of CTR, which helps you optimize meta descriptions, titles, and content to attract more clicks from search results.
The dashboards allow you to track traffic trends over time, helping you identify patterns, seasonal fluctuations, and the impact of your SEO efforts on site traffic.
You can see how your site is performing in different countries and regions, helping you tailor your SEO strategies to specific markets or local search behavior.
Key Details
Key Looker Studio Search Console dashboard capabilities with context from the source page.
The number of times your website appears in search results, indicating visibility and potential reach.
The average ranking of your website in search results, providing insights into visibility and competitiveness.
Instances where users click through to your website from search results, reflecting traffic driven by search engines.
Analysis of performance metrics segmented by geographical location, aiding in localized SEO strategies and targeting.e.
The percentage of clicks compared to impressions, revealing the effectiveness of your search snippets in enticing clicks.
A structured display of performance data in table format, facilitating easy comparison and analysis of KPIs over time and across different dimensions.
How this dashboard helps SEO teams move from fragmented Search Console reporting to faster, data-backed optimization decisions.
SEO teams often struggle with fragmented Search Console reporting, delayed ranking visibility, and low confidence in query and page performance interpretation.
This Looker Studio dashboard centralizes Search Console impressions, clicks, CTR, average position, and page/query insights in one view for faster SEO decisions. Want a Looker Studio dashboard like this for your team? See our certified Looker Studio consulting service.
Find answers to common questions about this Looker Studio Search Console dashboard.
The dashboard provides insights into search performance, indexing status, crawl errors, mobile usability, backlinks, security issues, and much more to help optimize your website’s presence on Google.
From Lets Viz
Experience superior data analysis with our custom dashboards. Specializing in all tools and technologies, we turn data into visually compelling, actionable insights
NDA-safe · No obligation · Clear next steps