Spends
$2.4M
▲ Total amount of money spent on advertising campaigns, indicating budget allocation and expenditure.
Supercharge your ad strategy with the Ads Performance Overview Dashboard! Instantly track Google Ads spend, clicks, and performance. Optimize campaigns and boost ROI—all in one sleek, powerful dashboard. Transform data into results!
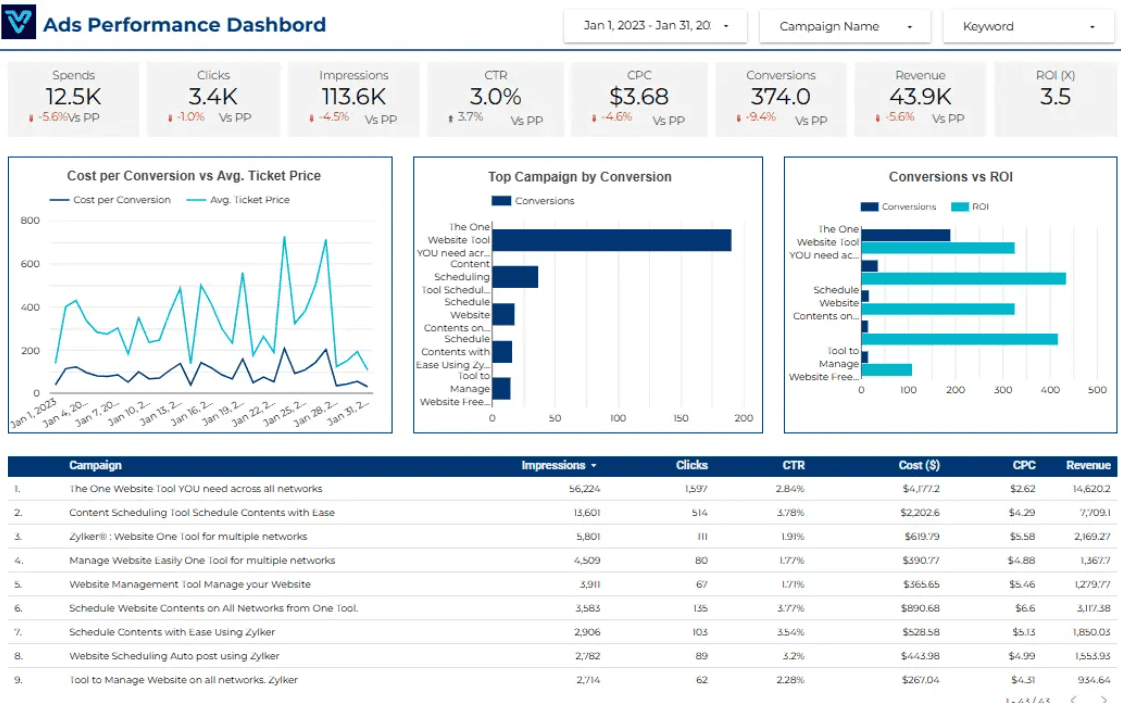
Track impressions, clicks, CTR, CPC, conversions, cost, and ROAS in one Looker Studio Google Ads reporting view.
Built in Looker Studio with Google Ads KPI tracking for impressions, clicks, CTR, CPC, conversions, and spend.
Trusted by teams across 15+ countries
Explore the core Looker Studio Google Ads performance dashboard views built for paid-search decisions.
Interactive Looker Studio Google Ads reporting view.
Open the live embedded Looker Studio Google Ads performance dashboard directly in a fullscreen modal.
Track impressions, clicks, CTR, CPC, conversions, cost, and ROAS in one Looker Studio view.
$2.4M
▲ Total amount of money spent on advertising campaigns, indicating budget allocation and expenditure.
$1.2M
▲ Average cost incurred for each ad click, indicating the efficiency of your ad spend.
126K
▲ Number of times users click on your ads, reflecting the ad's effectiveness in driving traffic.
$2.4M
▲ Total income generated from ad-driven conversions, reflecting the financial impact of your ads.
2.8M
▲ Total number of times ads are displayed, indicating the reach and visibility of your campaigns.
3.9%
▲ Number of times users complete desired actions after clicking your ads, measuring campaign effectiveness.
126K
▲ Percentage of clicks relative to impressions, measuring the ad's ability to attract clicks.
4.2x
▲ Ratio of revenue generated to ad spend, indicating the overall profitability of your advertising efforts.
These are the practical Google Ads reporting challenges this dashboard helps teams resolve.
By displaying key performance indicators (KPIs) like cost-per-click (CPC), cost-per-impression (CPM), and conversions, these dashboards make it easier for marketers to track the return on investment (ROI) of their ad spend.
Rather than manually collecting data from multiple platforms, dashboards automatically integrate and present data from various ad channels, saving marketers valuable time.
Ads performance dashboards simplify complex data analysis with easy-to-read graphs and charts, making it accessible to both seasoned marketers and beginners..
Dashboards aggregate data across multiple platforms, offering a unified view of performance, making it easier to track and analyze cross-platform campaigns.
With real-time data updates, dashboards allow marketers to make immediate adjustments to campaigns, improving performance while the campaign is still active.
Ads performance overview dashboards provide a clear, consolidated view of all ad metrics. This eliminates confusion and helps businesses understand which ads are performing well and which ones need improvement.
Key Details
Key Google Ads dashboard capabilities with context from the source page.
Total amount of money spent on advertising campaigns, indicating budget allocation and expenditure.
Average cost incurred for each ad click, indicating the efficiency of your ad spend.
Number of times users click on your ads, reflecting the ad's effectiveness in driving traffic.
Total income generated from ad-driven conversions, reflecting the financial impact of your ads.
Total number of times ads are displayed, indicating the reach and visibility of your campaigns.
Number of times users complete desired actions after clicking your ads, measuring campaign effectiveness.
Percentage of clicks relative to impressions, measuring the ad's ability to attract clicks.
Ratio of revenue generated to ad spend, indicating the overall profitability of your advertising efforts.
How this dashboard helps paid-search teams move from fragmented Google Ads reporting to faster campaign optimization decisions.
Paid-search teams often struggle with fragmented Google Ads reporting, delayed campaign visibility, and low confidence in spend, CTR, and conversion analysis.
This Looker Studio dashboard centralizes Google Ads impressions, clicks, CTR, CPC, conversions, and spend in one view for faster paid-search decisions. Want a Looker Studio dashboard like this for your team? See our certified Looker Studio consulting service.
Find answers to common questions about this Looker Studio Google Ads performance dashboard.
The dashboard can integrate with major platforms like Google Ads, Facebook Ads, Instagram Ads, LinkedIn Ads, and more, providing a unified view of all your campaigns.
From Lets Viz
Experience superior data analysis with our custom dashboards. Specializing in all tools and technologies, we turn data into visually compelling, actionable insights
NDA-safe · No obligation · Clear next steps