Impressions
2.8M
▲ Total number of times your ads are displayed on Bing, indicating the reach and visibility of your campaigns.
Boost your marketing impact with the Bing Ads Dashboard! Track impressions, clicks, and conversions effortlessly. Optimize campaigns, enhance engagement, and maximize ROI—all from one powerful, user-friendly dashboard. Elevate your Bing Ads performance today!
Track Bing Ads impressions, clicks, CTR, CPC, conversions, and spend in one live Looker Studio reporting view.
Built in Looker Studio with Bing Ads-focused KPI tracking for impressions, clicks, CTR, CPC, conversions, and spend.
Trusted by teams across 15+ countries
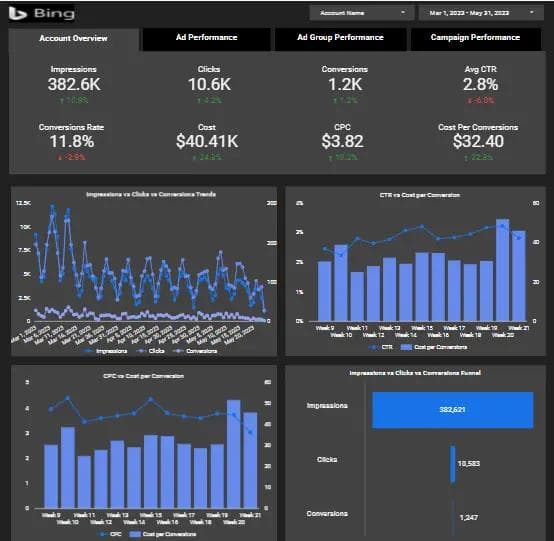
Explore the core Looker Studio Bing Ads performance dashboard views built for paid-search optimization decisions.
Interactive Looker Studio Bing Ads reporting view.
Open the live embedded Looker Studio Bing Ads performance dashboard directly in a fullscreen modal.
Track impressions, clicks, CTR, CPC, conversions, spend, and related Bing Ads KPIs in one Looker Studio view.
2.8M
▲ Total number of times your ads are displayed on Bing, indicating the reach and visibility of your campaigns.
$1.2M
▲ Total expenditure on Bing ads, providing insights into budget allocation and overall spending.
126K
▲ Number of times users click on your site from search results, indicating interest and engagement.
$1.2M
▲ Average cost incurred for each click on your Bing ads, indicating the efficiency of your ad spend.
3.9%
▲ Total instances where users complete desired actions after clicking your ads, measuring campaign effectiveness.
3.9%
▲ Percentage of visits leading to conversions, indicating the success of your site in achieving desired actions.
126K
▲ Percentage of clicks relative to impressions, gauging the ad's ability to attract interactions.
$38
▲ Average cost of achieving a conversion through your ads, reflecting the financial efficiency of your campaigns.
These are the practical Bing Ads reporting challenges this dashboard helps teams resolve.
The dashboard offers a clear view of all active campaigns, enabling advertisers to track their performance in real time. This eliminates the need for manual tracking and allows for quicker optimization.
It helps you analyze how individual ads are performing, breaking down metrics like clicks, impressions, click-through rates (CTR), and conversion rates. This helps pinpoint what's working and what needs improvement.
The dashboard shows detailed spending patterns, helping you keep track of your budget in real time. This prevents overspending and ensures your advertising budget is used efficiently.
Automatic generation of reports saves time on data collection and analysis. You can focus on making strategic decisions rather than gathering numbers manually.
Bing Ads Dashboards allow you to track the performance of specific keywords, helping you understand which keywords drive the most valuable traffic. This assists in refining your keyword strategy for optimal results.
The ability to customize the dashboard to your specific needs means you can prioritize the data that matters most to your campaigns, making it easier to focus on critical KPIs.
Key Details
Key Looker Studio Bing Ads dashboard capabilities with context from the source page.
Total number of times your ads are displayed on Bing, indicating the reach and visibility of your campaigns.
Total expenditure on Bing ads, providing insights into budget allocation and overall spending.
Number of times users click on your site from search results, indicating interest and engagement.
Average cost incurred for each click on your Bing ads, indicating the efficiency of your ad spend.
Total instances where users complete desired actions after clicking your ads, measuring campaign effectiveness.
Percentage of visits leading to conversions, indicating the success of your site in achieving desired actions.
Percentage of clicks relative to impressions, gauging the ad's ability to attract interactions.
Average cost of achieving a conversion through your ads, reflecting the financial efficiency of your campaigns.
How this dashboard helps paid-search teams move from fragmented Bing Ads reporting to faster campaign optimization decisions.
Paid-search teams often struggle with fragmented Bing Ads reporting, delayed campaign visibility, and low confidence in spend, CTR, and conversion analysis.
This Looker Studio dashboard centralizes Bing Ads impressions, clicks, CTR, CPC, conversions, and spend in one view for faster paid-search decisions. Want a Looker Studio dashboard like this for your team? See our certified Looker Studio consulting service.
Find answers to common questions about this Looker Studio Bing Ads performance dashboard.
The Bing Ads Performance Overview Dashboard is a tool that provides detailed metrics to track, optimize, and analyze the performance of your Bing Ads campaigns in real time.
From Lets Viz
Experience superior data analysis with our custom dashboards. Specializing in all tools and technologies, we turn data into visually compelling, actionable insights
NDA-safe · No obligation · Clear next steps