Packages Shipped (YTD)
$2.4M
▲ Packages Shipped (YTD) tracks the total number of packages shipped year-to-date, helping businesses evaluate shipment volume and measure operational efficiency over time..
A Logistics Dashboard in Looker Studio provides real-time insights into your supply chain, enabling data-driven decisions to optimize efficiency and reduce costs. Designed for logistics managers and operations leaders, this tool simplifies complex data, offering interactive visualizations to track delivery performance, identify bottlenecks, and improve customer satisfaction.
A Logistics Dashboard in Looker Studio provides real-time insights into your supply chain, enabling data-driven decisions to optimize efficiency and reduce costs.
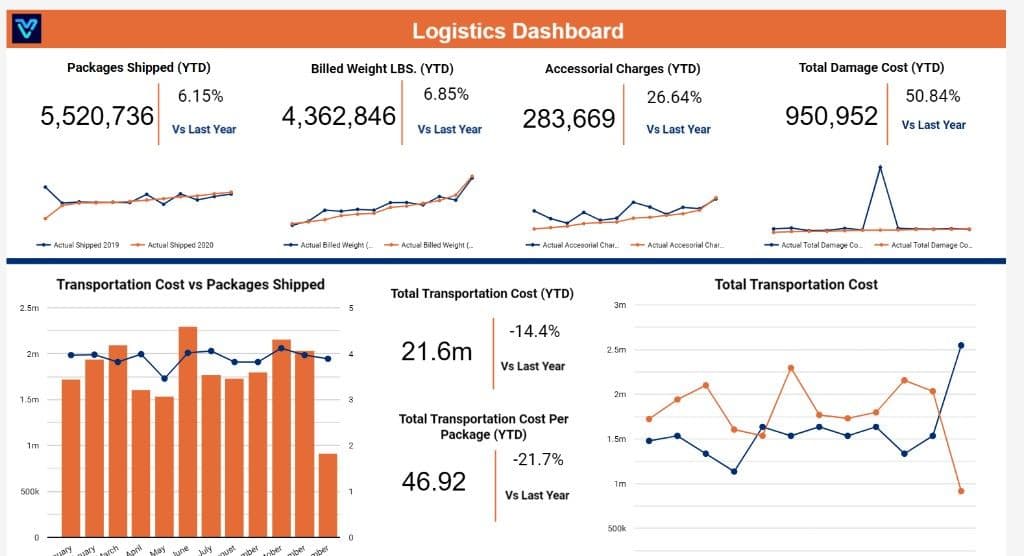
Built in Looker Studio with real-time logistics KPI tracking for shipments, billed weight, accessorial charges, damage cost, and transportation cost.
Trusted by teams across 15+ countries
Explore the core Looker Studio logistics dashboard views built for operations and supply-chain decision-making.
Interactive Looker Studio logistics reporting view.
Open the live embedded Looker Studio logistics dashboard directly in a fullscreen modal.
Track packages shipped, billed weight, accessorial charges, damage cost, transportation cost, and related logistics KPIs in one place.
$2.4M
▲ Packages Shipped (YTD) tracks the total number of packages shipped year-to-date, helping businesses evaluate shipment volume and measure operational efficiency over time..
18%
▲ Billed Weight LBS (YTD) measures the total billed weight of all shipments year-to-date. This KPI helps identify shipping cost patterns based on weight and optimize packaging and delivery strategies.
$740K
▲ Accessorial Charges (YTD) tracks additional charges, such as fuel surcharges or delivery fees, incurred during shipping. Monitoring this helps businesses control unexpected costs and improve budgeting accuracy. tax expenses. It offers a clearer view of operational efficiency.
$1.2M
▲ Total Damage Cost tracks the cost of damaged goods during transportation. By monitoring this KPI, businesses can reduce losses and implement better packaging or handling procedures to prevent damage.
$1.2M
▲ Transportation Cost reflects the total expenses related to moving goods, including fuel, labor, and carrier fees. Monitoring this KPI helps businesses optimize routes and reduce unnecessary shipping costs.
2.1x
▲ Packages Shipped measures the number of shipments processed within a specified period. This KPI helps businesses track shipping activity and analyze trends to adjust resources and improve service delivery
These are the practical logistics challenges this dashboard helps teams resolve.
A logistics dashboard solves the issue of poor visibility by providing real-time data on shipments, billed weights, and accessorial charges, allowing stakeholders to monitor operations instantly.
With accurate tracking of packages shipped and billed weights, businesses can optimize warehouse resources and delivery routes, reducing unnecessary overhead and operational costs.
By tracking accessorial charges and damage costs, a logistics dashboard helps pinpoint areas of inefficiency, enabling companies to minimize extra charges and mitigate losses due to damages.
A logistics dashboard ensures accurate billing by providing detailed insights into billed weights and accessorial charges, preventing discrepancies and costly errors.
By tracking Total Damage Cost, businesses can identify the root causes of damage and implement preventative measures, reducing future losses.
A logistics dashboard centralizes transportation cost data alongside shipments and accessorial charges, making it easier to see where spend is going and optimize carrier and route choices.
Key Details
Key logistics dashboard capabilities with context from the source page.
The Logistics Dashboard helps measure KPIs across shipping and supply-chain steps in one place.
Track sales, costs, net profit ratio, shipments, average delivery times, order status, and inventory metrics.
The dashboard supports deeper analysis by allowing users to click into specific metrics and views.
With operational visibility and faster KPI interpretation, teams can optimize supply-chain performance.
How this dashboard helps operations teams improve supply-chain execution with centralized KPI visibility.
Logistics teams often struggle with poor visibility, inefficient resource allocation, high operational costs, inaccurate billing, and difficulty tracking damages.
This Looker Studio dashboard centralizes packages shipped, billed weight, accessorial charges, damage cost, and transportation cost in one view for faster logistics decisions. Want a Looker Studio dashboard like this for your team? See our certified Looker Studio consulting service.
Find answers to common questions about this Looker Studio logistics dashboard.
The Looker Logistics Dashboard is a comprehensive analytics tool designed to track and visualize key logistics metrics in real-time. It provides insights into vital KPIs such as Package Shipped (YTD), Billed Weight (YTD), Accessorial Charges (YTD), Total Damage Cost, and Transportation Costs.
From Lets Viz
Experience superior data analysis with our custom dashboards. Specializing in all tools and technologies, we turn data into visually compelling, actionable insights
NDA-safe · No obligation · Clear next steps