Sessions
$2.4M
▲ The total number of visits to your site, indicating user activity and website traffic volume. More sessions generally reflect increased engagement and interest.
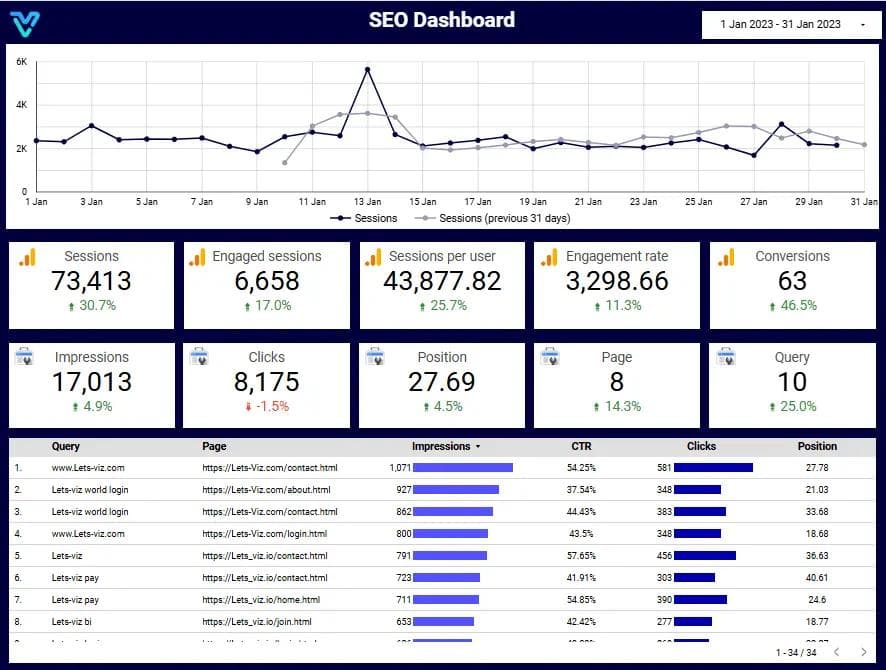
Keyword positions, CTR by page, impression funnel, and organic traffic trend — connected to your live GSC and GA4 data.
Built for marketing managers and SEO leads who need a single dashboard instead of switching between Search Console, Analytics, and spreadsheets every Monday.
Connected to Google Search Console, GA4, and Bing Webmaster Tools. Refreshes daily. No spreadsheets.
Trusted by teams across 15+ countries
Track search and analytics KPIs in one decision-ready Looker Studio report.
$2.4M
▲ The total number of visits to your site, indicating user activity and website traffic volume. More sessions generally reflect increased engagement and interest.
9.6%
▲ The percentage of sessions with meaningful interaction, such as clicks, video plays, or other actions. A higher rate suggests more engaged visitors.
$740K
▲ Sessions where users interact meaningfully with your site, indicating higher content engagement and interest.
3.9%
▲ The number of completed goals (sales, sign-ups, etc.) on your website, reflecting the effectiveness of your SEO in driving desired actions.
41K
▲ The average number of sessions per unique user, showing how frequently users return to your website.
2.8M
▲ The number of times your site or content appears in search results. Higher impressions mean your content is visible to more users.
These are the practical SEO reporting challenges this dashboard helps teams resolve.
Critical KPI signals get lost when metrics are spread across multiple tools.
Teams struggle to connect search metrics with business outcomes.
Manual exports and slide creation reduce decision speed.
How this dashboard helps SEO teams move from fragmented reporting to faster decisions.
Finance teams often struggle with delayed reporting, fragmented sources, and low confidence in KPI consistency.
This dashboard centralizes financial metrics in one view with real-time updates and consistent definitions. Want a Looker Studio dashboard like this for your team? See our certified Looker Studio consulting service.
Find answers to common questions about this finance dashboard.
The Looker SEO Dashboard is a powerful analytics tool that helps you monitor and track key SEO performance metrics for your website. It provides insights into sessions, engagement, conversions, clicks, and keyword rankings, all in one place. This allows businesses to optimize their digital marketing efforts by analyzing detailed SEO data and making data-driven decisions.
From Lets Viz
Experience superior data analysis with our custom dashboards. Specializing in all tools and technologies, we turn data into visually compelling, actionable insights
NDA-safe · No obligation · Clear next steps