Clicks
126K
▲ The number of times users interact with your ad, reflecting interest and potential conversion.
Introducing the Marketing Performance Dashboard: your ultimate hub for comprehensive marketing insights. Integrate Google Ads, Google Search Console, and Email Marketing metrics. Track performance, optimize strategies, and maximize ROI with unified, actionable data—all in one powerful dashboard.
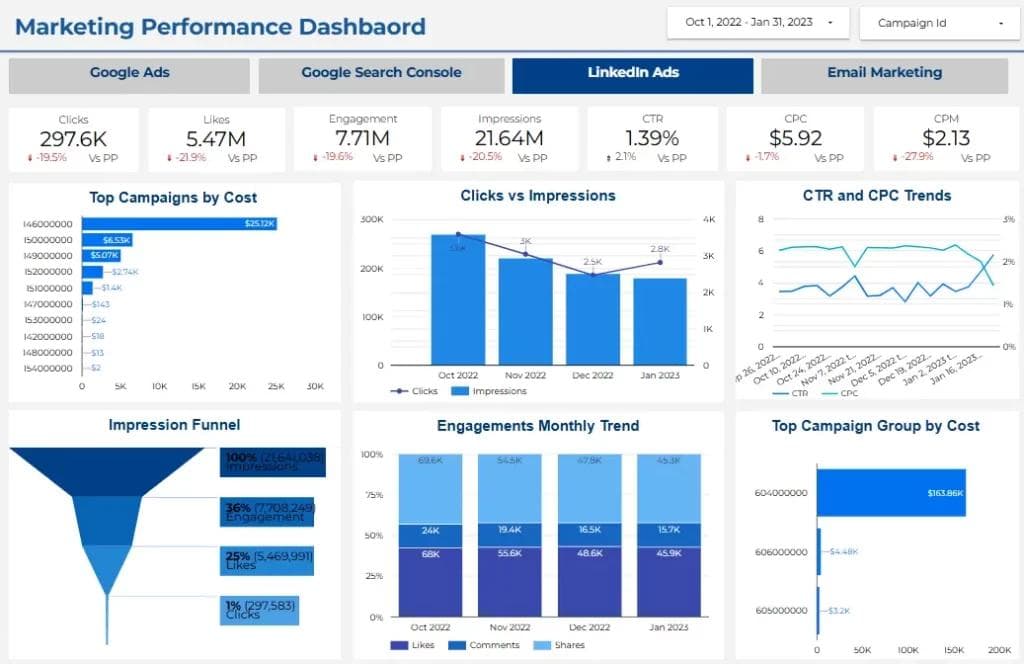
Track LinkedIn ads, email engagement, and AdSense monetization KPIs in one live Looker Studio reporting view.
Built in Looker Studio with combined KPI tracking for LinkedIn ads, email performance, and AdSense monetization.
Trusted by teams across 15+ countries
Explore the core Looker Studio combined dashboard views built for LinkedIn ads, email performance, and AdSense revenue decisions.
Interactive Looker Studio combined channel reporting view.
Open the live embedded Looker Studio LinkedIn + Email + AdSense combined dashboard directly in a fullscreen modal.
Track LinkedIn campaign KPIs, email engagement metrics, and AdSense revenue trends in one unified Looker Studio view.
126K
▲ The number of times users interact with your ad, reflecting interest and potential conversion.
126K
▲ The percentage of ad clicks compared to impressions, measuring the effectiveness of your ad in driving traffic.
38.7K
▲ Instances where users express appreciation for your ad, indicating positive engagement and brand affinity.
$1.2M
▲ The average cost incurred for each click on your ad, indicating efficiency in ad spending.
9.6%
▲ Overall interaction with your ad, encompassing clicks, likes, comments, and shares, revealing the level of audience involvement.
$1.2M
▲ The cost of reaching one thousand ad impressions, aiding in budget allocation and campaign optimization.
2.8M
▲ The total number of times your ad is displayed, indicating reach and visibility.
2.8M
▲ Analysis of the journey from impressions to clicks, helping identify potential drop-off points and optimizing ad performance.
These are the practical multi-channel reporting challenges this dashboard helps teams resolve.
Marketing teams often struggle to determine which campaigns are delivering the best results. Dashboards provide a centralized view of key performance indicators (KPIs), offering real-time insights into how campaigns are performing. This allows businesses to quickly assess what’s working and make data-driven decisions to optimize marketing strategies.
Many businesses struggle to measure the return on investment (ROI) of their marketing campaigns. Dashboards provide clear and customizable metrics that track the performance of each campaign, allowing businesses to calculate ROI accurately. This ensures that marketing budgets are being spent wisely and efficiently.
Traditional marketing reports often take days or weeks to compile, delaying decision-making. Dashboards provide real-time data and visual reports, enabling faster and more informed decisions. This speed allows marketing teams to adjust strategies promptly for better outcomes.
Aligning marketing strategies with overall business goals is a common challenge. Dashboards help bridge this gap by showing how marketing efforts align with broader company objectives. By visualizing this relationship, businesses can ensure that marketing efforts contribute directly to their long-term goals.
When marketing data is scattered across different departments, it becomes difficult for teams to collaborate effectively. Marketing performance dashboards promote transparency by providing a single, accessible platform where all team members can monitor and discuss performance in real time. This fosters better collaboration and helps all teams stay on the same page.
With multiple data sources such as social media, email marketing, and web analytics, it can be overwhelming to track performance manually. Marketing performance dashboards solve this problem by integrating all the data into one platform, helping businesses consolidate complex data into easy-to-understand visualizations.
Key Details
Key combined dashboard capabilities with context from the source page.
The number of times users interact with your ad, reflecting interest and potential conversion.
The percentage of ad clicks compared to impressions, measuring the effectiveness of your ad in driving traffic.
Instances where users express appreciation for your ad, indicating positive engagement and brand affinity.
The average cost incurred for each click on your ad, indicating efficiency in ad spending.
Overall interaction with your ad, encompassing clicks, likes, comments, and shares, revealing the level of audience involvement.
The cost of reaching one thousand ad impressions, aiding in budget allocation and campaign optimization.
The total number of times your ad is displayed, indicating reach and visibility.
Analysis of the journey from impressions to clicks, helping identify potential drop-off points and optimizing ad performance.
How this dashboard helps teams move from fragmented channel reports to faster, data-backed cross-channel decisions.
Marketing teams often struggle with fragmented LinkedIn ads, email campaign, and AdSense reporting, leading to delayed cross-channel optimization decisions.
This Looker Studio dashboard centralizes LinkedIn ads, email performance, and AdSense monetization KPIs in one view for faster cross-channel marketing decisions. Want a Looker Studio dashboard like this for your team? See our certified Looker Studio consulting service.
Find answers to common questions about this Looker Studio LinkedIn + Email + AdSense combined dashboard.
The Facebook Insights Dashboard provides comprehensive analytics on page performance, post engagement, and follower demographics, enabling the client to refine their social media strategy and enhance audience interaction effectively. View Dashboard Email Performance Are you struggling to manage your email performance .This Email Performance Dashboard help you Measure clicks, bounces, email delivery rate, and engagement rate of your marketing email campaigns in a simple, easy-to-read dashboard. Compare performance over time to double-dip on your winning sequences.
From Lets Viz
Experience superior data analysis with our custom dashboards. Specializing in all tools and technologies, we turn data into visually compelling, actionable insights
NDA-safe · No obligation · Clear next steps