Tableau Interview Questions for Data Analysts: 2026 Guide
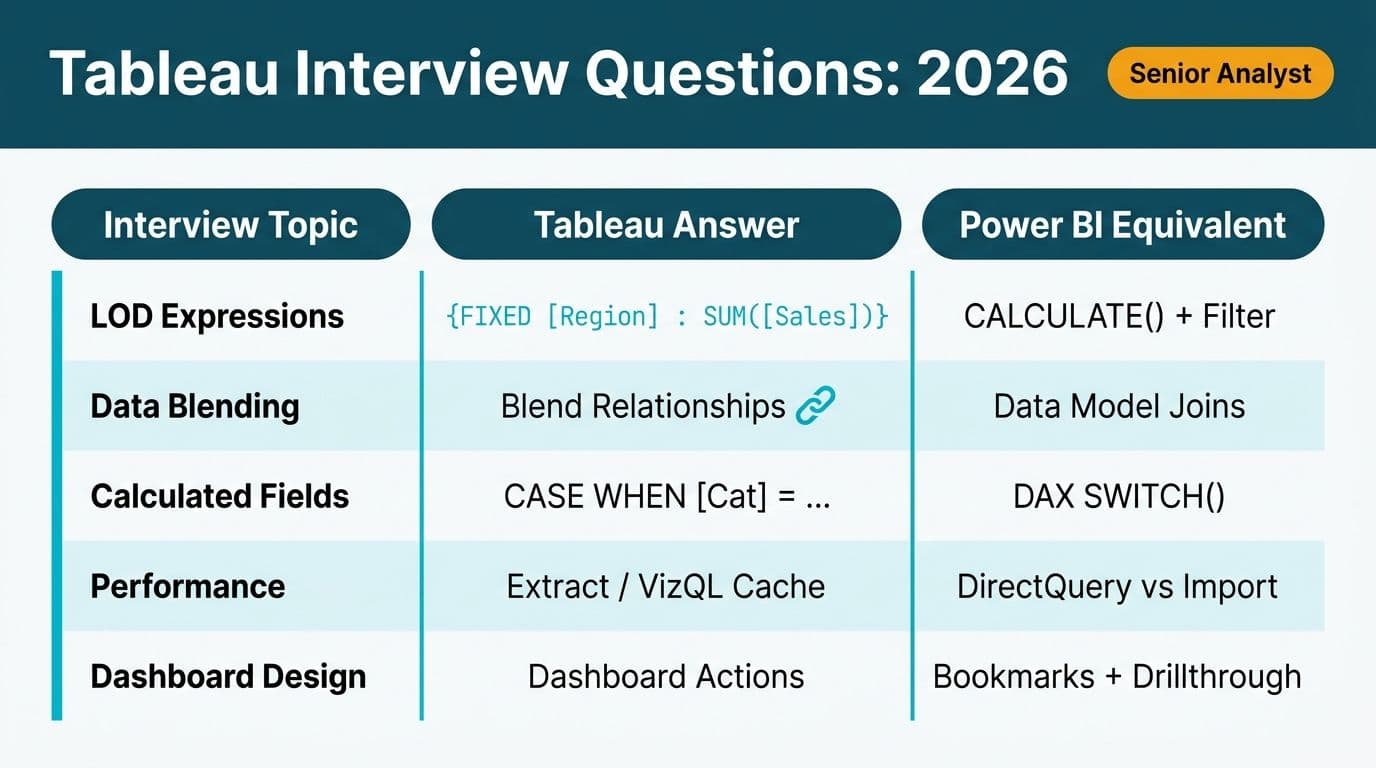
Tableau interview questions for data analysts typically cover calculated fields, LOD (Level of Detail) expressions, data blending, performance optimisation, and dashboard design principles. Interviewers at regulated-industry employers increasingly expect candidates to translate Tableau skills into Power BI equivalents, reflecting live platform evaluation cycles happening inside organisations. Cross-platform fluency - knowing where these tools overlap and diverge - signals the strategic analytical maturity that separates senior hires from competent mid-level candidates.
Key Takeaways
- LOD expressions (FIXED, INCLUDE, EXCLUDE) are the most-tested advanced Tableau concept in data analyst technical screens
- Cross-platform literacy - translating Tableau concepts to Power BI DAX - is a growing interview expectation at organisations evaluating both platforms
- Regulated-industry roles (healthcare, fintech, manufacturing) add data governance and compliance layers to standard technical questions
- Performance optimisation strategy - extract vs live connection, context filter design, aggregation choices - separates mid-level from senior candidates
- Understanding where Microsoft Fabric fits in enterprise analytics signals commercial BI awareness valued at senior hiring levels
What Are the Most Common Tableau Interview Questions for Data Analysts?
Data analyst interviews at BI-heavy organisations follow a recognisable pattern. Interviewers open with conceptual questions - what is the difference between a dimension and a measure, or when would you use a table calculation versus a calculated field - before progressing to scenario-based problems that expose depth of practice under time pressure.
The topics that appear most consistently in Tableau technical screens:
Calculated fields vs table calculations: Calculated fields execute at the database level during query time; table calculations operate on aggregated data already present in Tableau's view. Candidates who conflate the two signal a gap in query performance awareness that matters significantly at scale.
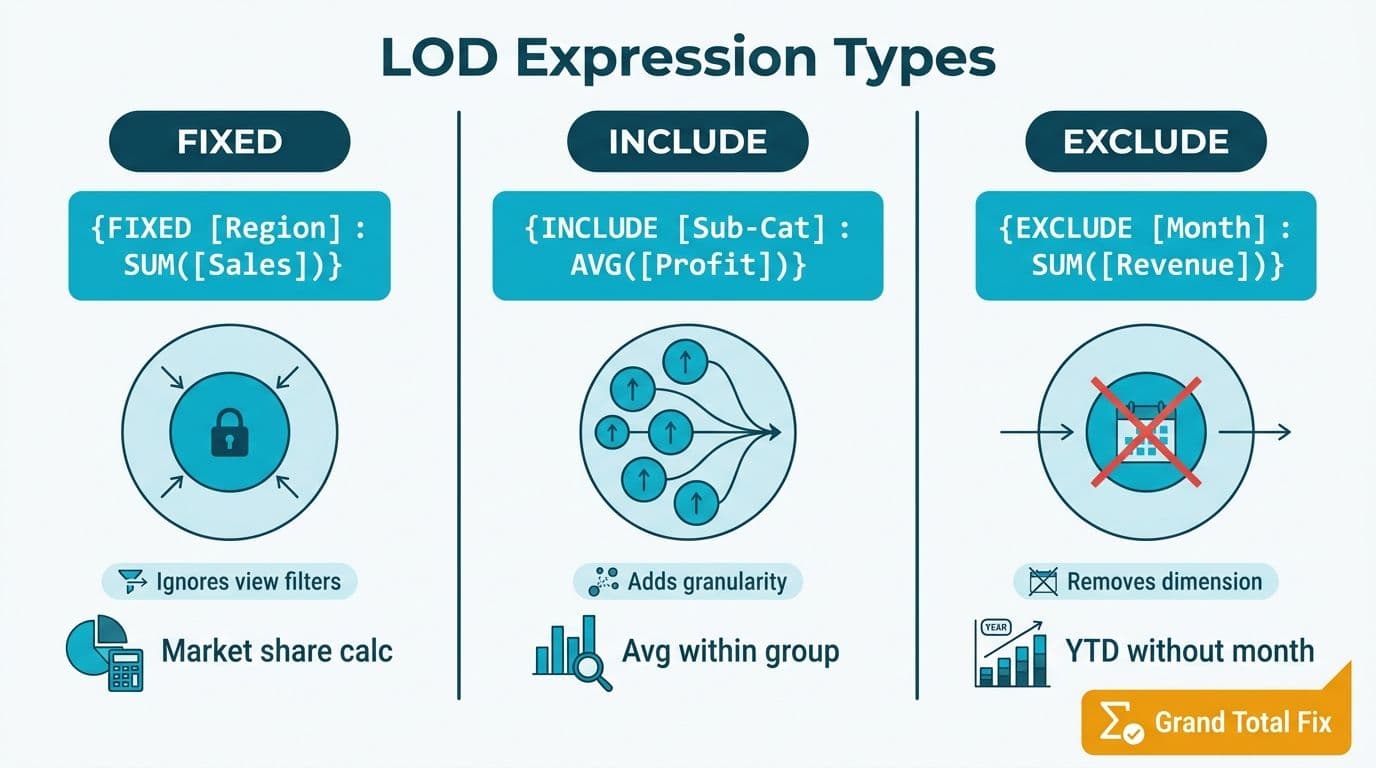
LOD expressions: FIXED, INCLUDE, and EXCLUDE expressions are the most-tested advanced concept in senior technical screens. A FIXED LOD expression calculates at a specified dimension regardless of the dimensions in the current view - the backbone of cohort analysis and customer-level aggregations built on top of order-level data.
Data blending vs joins: Blending performs a left join after individual data sources are queried independently; joins happen at the source level before data reaches Tableau. Blending is useful when native joins are not possible across live connections, but it restricts certain aggregation types and should be treated as a workaround, not a default architecture.
Extract (.hyper file) vs live connection: Extracts deliver faster query performance and reduce load on source databases but introduce refresh latency. Live connections reflect real-time data at the cost of source database query time. Interviewers want candidates to articulate the operational tradeoffs, not just recite the definitions.
Context filters: Applied before all other filters, context filters restrict the data scope for INCLUDE LOD expressions and improve performance on large sources by creating a temporary table. Misunderstanding the evaluation order of context filters versus regular filters is one of the most common intermediate-level errors.
Sets and groups: Sets are dynamic or static subsets of dimension members used in calculations and as filters; groups are manual bins for dimension values. The interview question is not just "what are these" but "when would you choose a set over a group for a given segmentation requirement."
Row-level security (RLS): Enforcing RLS through user filters (calculated fields referencing `USERNAME()` or `USERDOMAIN()`) or through Tableau Server and Tableau Cloud permission models is a standard question in regulated-industry roles where data segregation is a compliance requirement, not a feature request.
Dashboard actions and performance: Filter actions, highlight actions, URL actions, and set actions all carry performance implications. Interviewers check whether candidates design for interactivity without degrading load time, and whether they can use Performance Recording to diagnose slow workbooks systematically.
Before committing to Tableau licensing for a new analytics build-out, use the Instant project cost calculator to model platform, headcount, and implementation costs across different scenarios - particularly useful when comparing Tableau against other platforms during a procurement decision.
How Do Tableau Concepts Map to Power BI Equivalents?
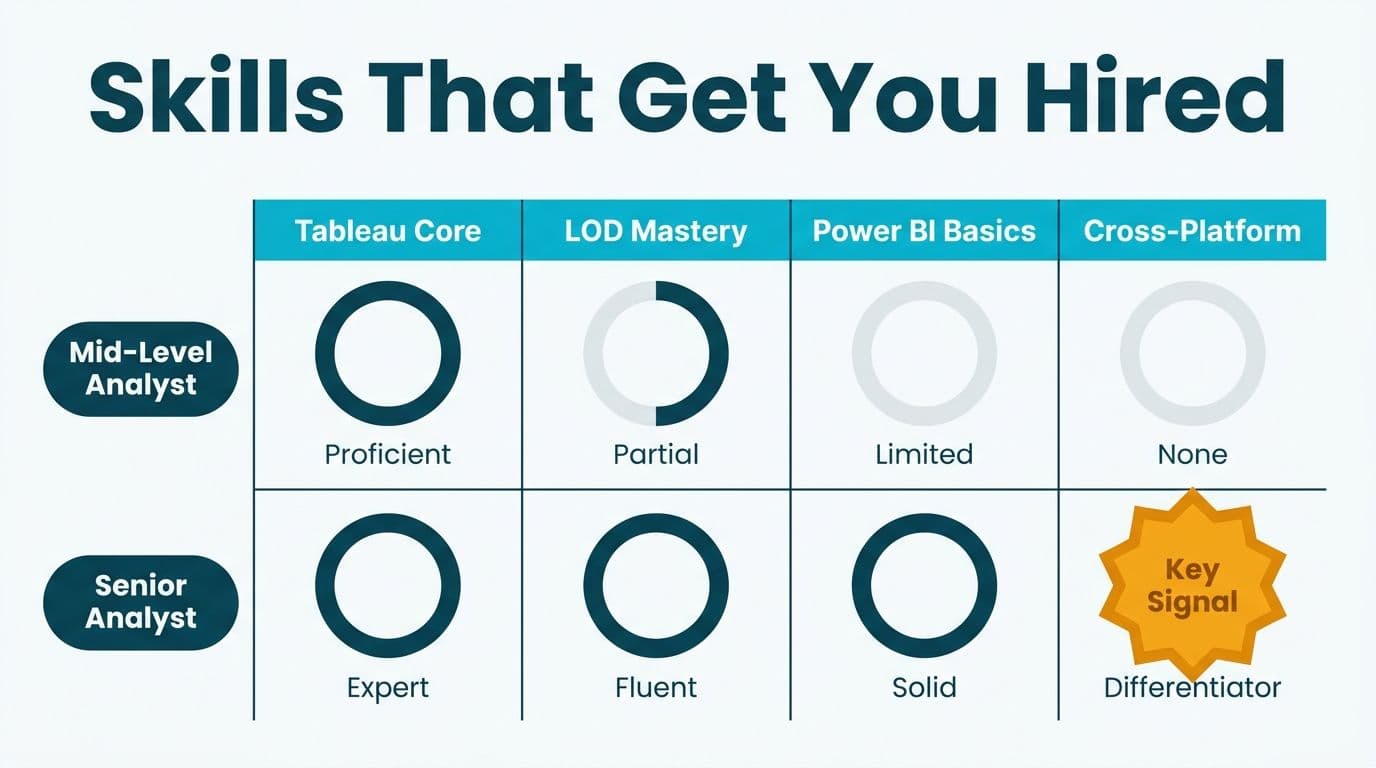
The highest-value skill a data analyst can demonstrate in 2026 is the ability to move fluently between Tableau and Power BI. Most mid-market and enterprise organisations operate in mixed environments, and hiring managers are increasingly screening for cross-platform literacy alongside single-tool depth.
The table below maps core Tableau concepts to their Power BI equivalents and identifies the key architectural difference for each pair.
| Tableau Concept | Power BI Equivalent | Key Architectural Difference |
|---|---|---|
| Calculated Field | DAX Measure or Calculated Column | Power BI separates row-context (column) from filter-context (measure); Tableau infers field type from context |
| LOD FIXED | CALCULATE with ALL() or REMOVEFILTERS() | DAX CALCULATE rewrites filter context programmatically; FIXED anchors the dimension scope declaratively |
| LOD INCLUDE | CALCULATE with SUMMARIZE | Forces a finer aggregation grain than the current visual context |
| LOD EXCLUDE | CALCULATE with ALLEXCEPT() | Removes specific dimensions from the active filter context |
| Data Blending | Composite Model / DirectQuery federation | Power BI Composite Models support mixed Import and DirectQuery modes across sources in one model |
| Extract (.hyper file) | Import Mode dataset | Both cache data locally; Tableau uses the Hyper engine, Power BI uses the VertiPaq columnar store |
| Context Filter | Visual-level / Page-level Filter + CALCULATE | Power BI applies filters top-down via the filter pane; CALCULATE achieves equivalent scoping in DAX |
| Sets (dynamic) | DAX measure with conditional membership | No native Set object in Power BI; replicated with DAX expressions or Field Parameters |
| Parameters | What-if Parameters / Field Parameters | Power BI Field Parameters enable dynamic measure switching, closer to Tableau's parameter behaviour |
| Server / Cloud permissions | Workspace roles with DAX RLS | Power BI uses Azure Active Directory-backed workspace roles; RLS rules are defined in DAX |
| Data Source Filter | Power Query filter step with query folding | Power Query applies filters before import when the source supports folding; equivalent in effect to Tableau's data source filter |
Understanding how CALCULATE works in Power BI DAX is the single most important bridge concept for analysts moving from Tableau. CALCULATE rewrites the filter context for any expression - the DAX equivalent of what a FIXED LOD achieves by anchoring a calculation to a declared dimension set, as described in Microsoft's DAX function reference (2025).
For coverage of Power BI governance structures that parallel Tableau Server's permission model, the Power BI Governance Best Practices: 12-Point Checklist covers workspace roles, RLS configuration, and data classification controls in detail.
What Do Senior-Level Tableau Interview Questions Test?
Senior-level Tableau interviews shift from feature recall to architectural judgment. The three areas that most reliably separate mid-level from senior candidates are LOD design under constraint, performance strategy, and governance architecture.
LOD design under constraint
The classic scenario problem: show each customer's first purchase date alongside every order row in the same view. The answer uses `{FIXED [Customer ID] : MIN([Order Date])}` - a FIXED LOD that computes independently of whatever dimensions appear in the view. Candidates who reach for a table calculation instead reveal a misunderstanding of evaluation order that would produce incorrect results at scale.
The analogous DAX pattern - `CALCULATE(MIN('Orders'[Order Date]), ALLEXCEPT('Orders', 'Orders'[Customer ID]))` - is a natural follow-up at organisations running both platforms, and demonstrates the cross-platform translation ability that interviewers increasingly value.
Performance architecture
Strong senior candidates diagnose slow workbooks systematically: switching from live to extract for analytical workloads, reducing the mark count rendered per view, using context filters to limit the data passed to LOD calculations, hiding unused fields from published extracts to reduce extract size, and - on Tableau Server - assessing whether extract refresh schedules create contention during peak query hours.
Governance and audit readiness
Senior hires are expected to design security before designing dashboards. Interview questions cover implementing role-based access to row-level data, auditing workbook access on Tableau Server, managing extract credential security for automated refresh pipelines, and documenting data lineage from source system to published view.
How Do Regulated Industries Frame Tableau Interview Questions Differently?
Healthcare, fintech, and manufacturing employers in regulated markets add compliance layers to standard technical questions. The frame shifts from "can you build this dashboard" to "can you build this dashboard in a way that would survive a compliance audit."
US healthcare (HIPAA, SOC 2)
A US health system evaluating a data analyst will probe how PHI (protected health information) is handled in published Tableau workbooks. Strong answers cover data source filters that strip identifiable fields before the extract is published, row-level security tied to care-team membership, and refresh pipelines that maintain access logs. SOC 2 Type II certification of the Tableau Cloud hosting environment is a common follow-up question for organisations with contractual obligations to business associates.
UK and EU fintech (GDPR)
A UK fintech firm running Tableau Cloud needs to confirm data residency - where extracts are stored and processed. Under GDPR, personal data transferred outside the UK or EU requires an adequacy decision or Standard Contractual Clauses. Interviewers probe whether a candidate understands the difference between data processed inside Tableau's hosted engine and data that remains behind a live connection to an on-premises or in-country source.
Canadian manufacturing (PIPEDA)
A Canadian manufacturing company governed by PIPEDA faces consent and purpose-limitation obligations that affect how customer and employee data may be modelled in shared dashboards. Interview questions in this context probe whether a candidate can design workbooks that cleanly separate anonymised operational metrics from identifiable employee performance records, satisfying data minimisation requirements without limiting analytical utility.
Real data disputes rarely originate from the technology itself. An events production company we worked with had two Tableau reports showing different grand totals, and no one trusted either. After reconciliation, the totals matched exactly - the only real difference was 34 filler rows captured across different date windows. The dispute was never about the data; it was about undocumented filter logic. Interviewers in regulated industries are looking for candidates who can diagnose this kind of discrepancy methodically, document the root cause, and prevent recurrence through better workbook governance.
When Should an Organisation Choose Tableau Over Power BI?
The Tableau versus Power BI decision for retail and e-commerce analytics - and for regulated industries more broadly - depends on data infrastructure, team skill profile, and licensing economics rather than abstract platform quality comparisons.
Tableau holds structural advantages when:
- The team prioritises ad hoc visual exploration - Tableau's drag-and-drop interaction model delivers faster exploratory analysis for analysts not writing DAX
- The data stack is multi-cloud and heterogeneous - Tableau's live connection federation across BigQuery, Snowflake, Databricks, and relational databases offers broader flexibility than Power BI's DirectQuery multi-source support
- The use case is embedded analytics in a SaaS product - Tableau Embedded and the JavaScript API provide more granular white-labelling control for custom integration scenarios
- The organisation operates outside the Microsoft ecosystem - Tableau integrates cleanly with non-Microsoft identity providers without Azure Active Directory dependency
Power BI holds structural advantages when:
- The organisation is inside Microsoft 365 - native connections to Teams, SharePoint, Excel, and Azure make Power BI the low-friction default for most enterprise workflows
- DAX modelling sophistication is required - the power bi vs power pivot vs power query architecture (Power Query for transformation, the DAX semantic model for calculations, Power BI for visualisation) provides a cleaner multi-layer design than Tableau's calculated field approach for complex financial models
- Fabric lakehouse integration is on the roadmap - Microsoft Fabric vs Power BI for enterprise analytics is less a competition and more an evolution: Fabric adds OneLake, Synapse Data Engineering, Data Activator, and Eventhouse as components that Power BI surfaces through Direct Lake mode
For a detailed cost comparison at different team sizes, the Power BI vs Tableau TCO 2026: Full Cost Breakdown covers licensing, infrastructure, and professional services spend side by side.
How Should You Prepare for a Tableau Technical Interview in 2026?
Preparation strategy matters as much as technical knowledge. Interviewers at mature analytics organisations test judgment and problem-solving approach, not just feature recall.
Build with real data. Publish two or three Tableau Public workbooks that solve genuine analytical questions - customer cohort analysis, revenue waterfall, or operational KPI dashboards. Workbooks that show performance decisions (extract over live, context filter placement, aggregation strategy) signal practical depth that tutorial screenshots cannot.
Practice the cross-platform translation. For every Tableau concept you can execute, learn its Power BI DAX equivalent. CALCULATE is the most frequently tested bridge concept at organisations running both platforms. The CROSSFILTER DAX: Override Relationship Direction in Power BI article covers advanced filter context manipulation that pairs naturally with Tableau LOD interview preparation.
Broaden your BI platform literacy. Many analyst roles now span more than two tools. Building a Looker Studio sales dashboard - from a Looker Studio sales dashboard template or from scratch against a GA4 or Google Sheets source - adds multi-platform adaptability to a portfolio that single-tool candidates cannot match. The 5 Looker Studio Templates for GA4: Setup and Pitfalls is a practical starting point for Looker Studio preparation alongside your Tableau and Power BI work.
Prepare for governance questions. Know how to describe the end-to-end data flow from source to published workbook - where credentials are stored, how refresh schedules are managed, and how you would implement row-level security for a multi-tenant environment. Governance architecture questions are standard at regulated-industry employers and are rarely covered by tutorial content.
Develop a platform selection framework. Interviewers at senior levels will present a scenario and ask you to recommend a BI platform. A structured framework - existing infrastructure, team skill profile, licensing economics, governance requirements - delivers a stronger answer than a recited list of feature comparisons.
---
Ready to scope your organisation's BI build-out or platform migration costs before your next stakeholder presentation? Use the Instant project cost calculator to generate a structured estimate across tooling, licensing, and implementation services.
---
About Lets Viz: Lets Viz has delivered data analytics and BI implementations since 2020 across US healthcare, UK fintech, Canadian manufacturing, and global SaaS organisations. Our consultants hold Microsoft and Tableau certifications and carry a 5.0 Clutch rating from verified client reviews. We work across Tableau, Power BI, Microsoft Fabric, and Looker Studio to help teams build, govern, and scale their analytics capability.