Power BI vs Tableau TCO 2026: Full Cost Breakdown
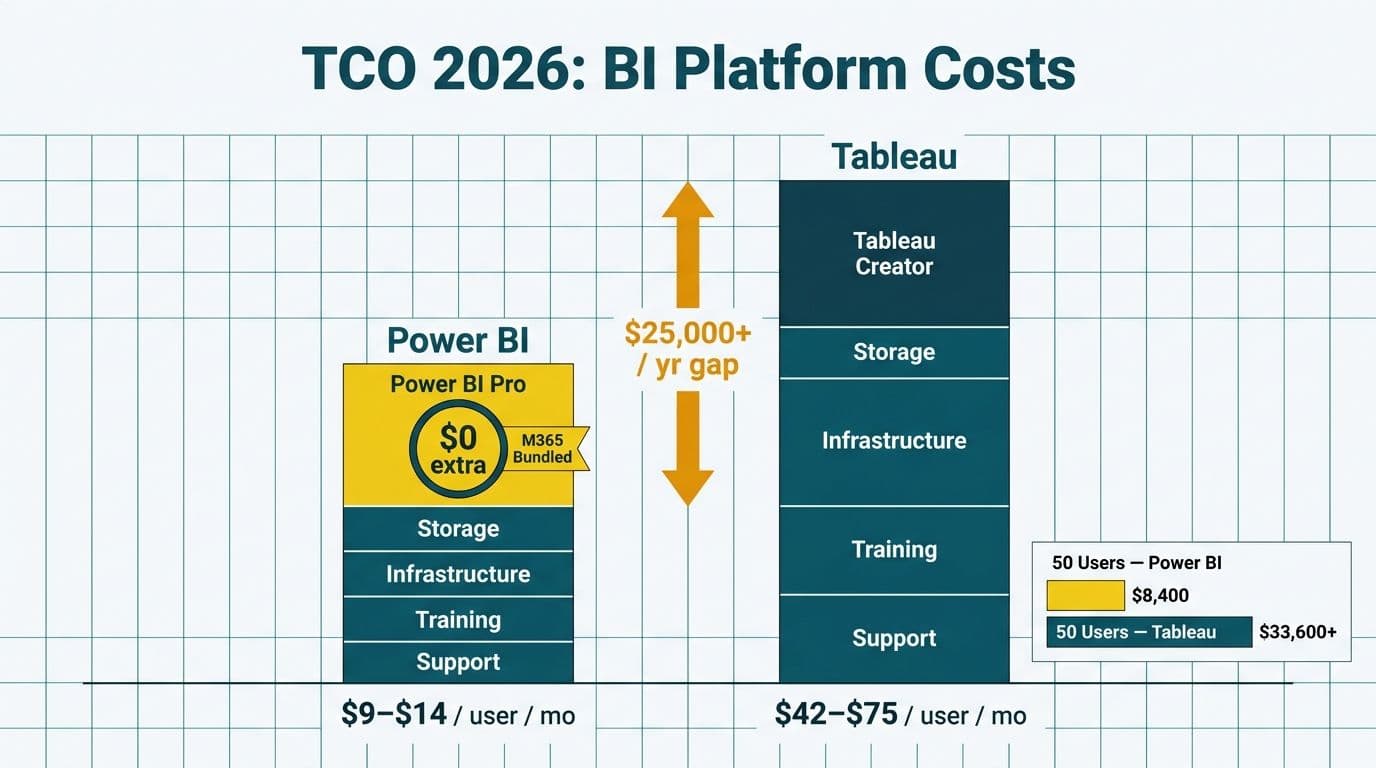
For most organisations already paying for Microsoft 365, Power BI Pro adds zero incremental licensing cost - yet a full Tableau deployment for the same team runs $42 to $75 per user per month at published 2026 list prices. At 50 users, that licensing gap alone exceeds $25,000 annually. The break-even analysis below maps exactly where bundling shifts the decision and where Tableau's architecture still earns its premium.
Key Takeaways
- Power BI Pro is included in Microsoft 365 E3 and E5 - if your organisation already pays for either plan, the BI license line drops to zero.
- At 50 users, the annual licensing gap between Power BI (M365-bundled) and a mid-tier Tableau mix exceeds $25,000; at 500 users the gap approaches $200,000 on published list pricing.
- Training and professional services typically represent 40-60% of total five-year BI platform cost on both platforms - often exceeding the license cost itself.
- Regulated industries in the US (HIPAA, SOC 2), UK and EU (GDPR), and Canada (PIPEDA) face compliance configuration costs that differ meaningfully between Power BI and Tableau.
- Looker and Looker Studio are separate products with fundamentally different pricing structures - Looker Studio is free; Looker Enterprise carries a negotiated contract comparable in scale to Tableau Creator pricing.
What Does Power BI vs Tableau Total Cost of Ownership Include in 2026?
TCO for a BI platform extends well beyond the per-seat license. The full stack covers platform licensing, connector and add-on fees, embedded analytics capacity, initial training, implementation services, change management, ongoing platform administration, and compliance configuration costs. Before requesting vendor quotes, use the Instant project cost calculator to model your specific combination and pinpoint where the largest cost drivers sit for your environment.
Licensing is the most visible line item but rarely the largest over a five-year horizon. Microsoft publishes Power BI Pro at $10 per user per month and Power BI Premium Per User (PPU) at $20 per user per month (Microsoft pricing, 2026). Tableau's published list prices are $75 per user per month for Creator seats (full authoring and publishing rights), $42 per user per month for Explorer seats (content interaction and lightweight editing), and $15 per user per month for Viewer-only access (Salesforce Tableau pricing, 2026). The gap looks decisive at first glance but narrows once bundling, enterprise volume discounts, and capability tradeoffs are factored in.
Connector and capacity costs are the hidden multiplier most procurement teams underestimate. Tableau's Data Management Add-on - required for Tableau Catalog, data lineage, and governed data source certification at scale - adds per-seat cost on top of the base Creator license. Power BI Premium unlocks paginated reports, deployment pipelines, and XMLA endpoint access for third-party tabular model tools. Microsoft Fabric capacity pricing bundles many of these capabilities but introduces a compute-unit billing model that requires careful right-sizing against expected concurrent query volumes.
Training and change management costs rarely appear on vendor-supplied TCO sheets. A realistic budget for a 50-seat rollout - covering classroom or live-online training, internal documentation, and an analytics champion programme - runs $15,000 to $30,000 in year one, depending on the team's pre-existing SQL and Excel fluency. This figure holds broadly consistent across both platforms at equivalent scope.
Professional services and ongoing support add the largest and most variable cost category. Implementation complexity, data model scope, embedded reporting requirements, and regulatory obligations all drive this number. The sections below model all four cost dimensions across four common organisation sizes.
How Does Microsoft 365 Bundling Change the Power BI TCO at Each Org Size?
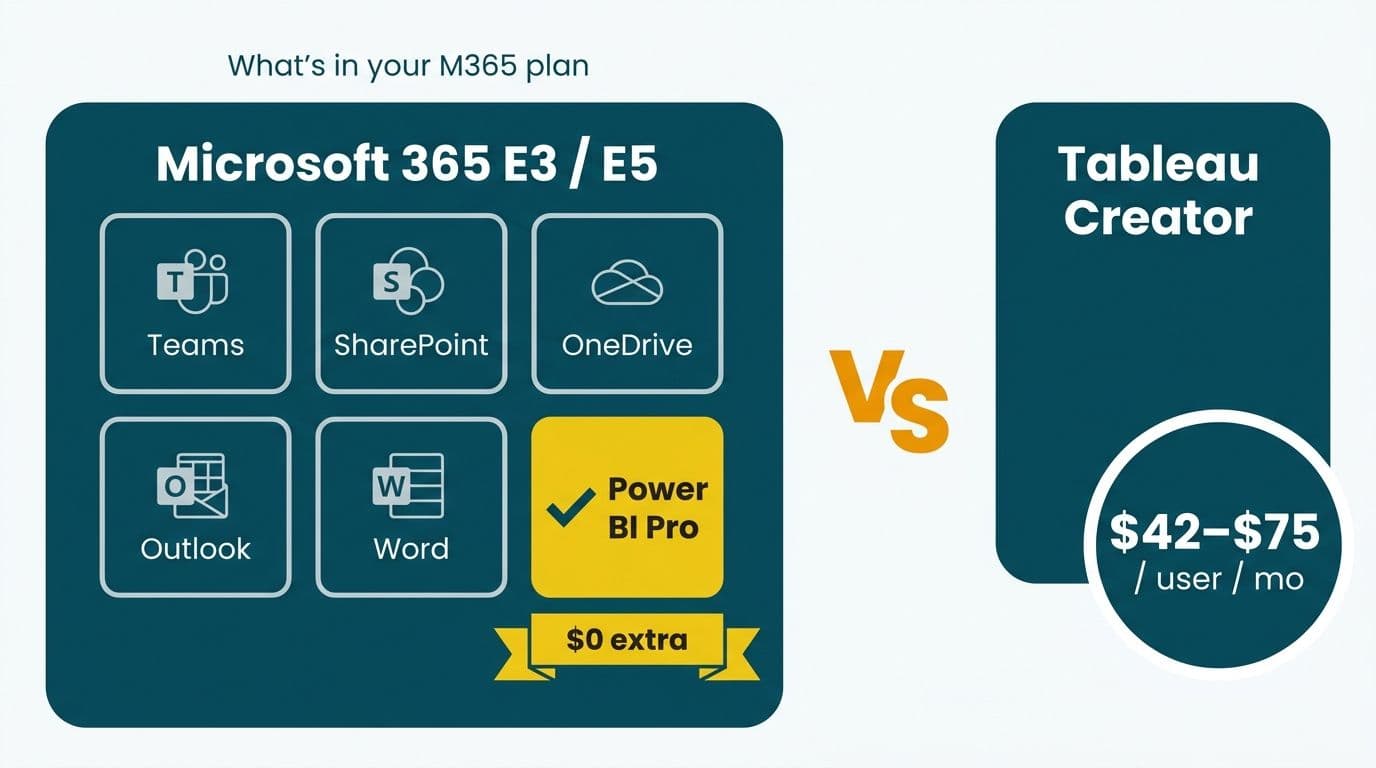
If your organisation already runs Microsoft 365 E3 (published at $36 per user per month) or E5 ($57 per user per month), Power BI Pro is included with no additional license fee. The incremental BI licensing cost drops to zero for standard reporting, self-service dashboards, and collaborative workspaces shared across teams.
The bundling advantage is most pronounced for small and mid-size teams. The table below uses published 2026 list prices to model all four cost dimensions across four common organisation sizes. Enterprise agreement pricing, which carries volume discounts, is not reflected - your actual Tableau cost may be lower depending on contract terms.
Annual TCO Model: Power BI vs Tableau at Four Org Sizes (USD, Year 1)
| Cost Line | 10 Users | 50 Users | 200 Users | 500 Users |
|---|---|---|---|---|
| **Power BI Pro - standalone** | $1,200 | $6,000 | $24,000 | $60,000 |
| **Power BI Pro - M365 E3 bundled** | $0 | $0 | $0 | $0 |
| **Power BI Premium Per Capacity (P1)** | N/A | N/A | N/A | ~$59,940 |
| **Tableau Creator (20% of seats)** | $1,800 | $9,000 | $36,000 | $90,000 |
| **Tableau Explorer (60% of seats)** | $3,024 | $15,120 | $60,480 | $151,200 |
| **Tableau Viewer (20% of seats)** | $360 | $1,800 | $7,200 | $18,000 |
| **Tableau blended total** | $5,184 | $25,920 | $103,680 | $259,200 |
| **Training (amortised, Year 1)** | $4,000 | $12,000 | $30,000 | $60,000 |
| **Implementation / consulting** | $5,000 | $20,000 | $60,000 | $150,000 |
| **Annual support / admin (est.)** | $8,000 | $20,000 | $50,000 | $120,000 |
Notes: Premium Per Capacity (P1) is appropriate at 500-user scale for Power BI Embedded, unlimited Viewer access, or large-model refresh requirements. Tableau blended pricing assumes 20% Creator, 60% Explorer, 20% Viewer as a representative enterprise split. Training and implementation figures reflect a mid-complexity deployment against an existing data warehouse - simpler or greenfield environments will differ.
For a 50-user organisation where M365 E3 is already in place, the $25,920 Tableau licensing cost funds approximately two weeks of dedicated analytics consulting per year - enough capacity to build a full P&L variance dashboard suite, configure a compliance audit report, and automate scheduled distribution to finance stakeholders.
Where Does the Power BI vs Tableau Break-Even Point Fall?
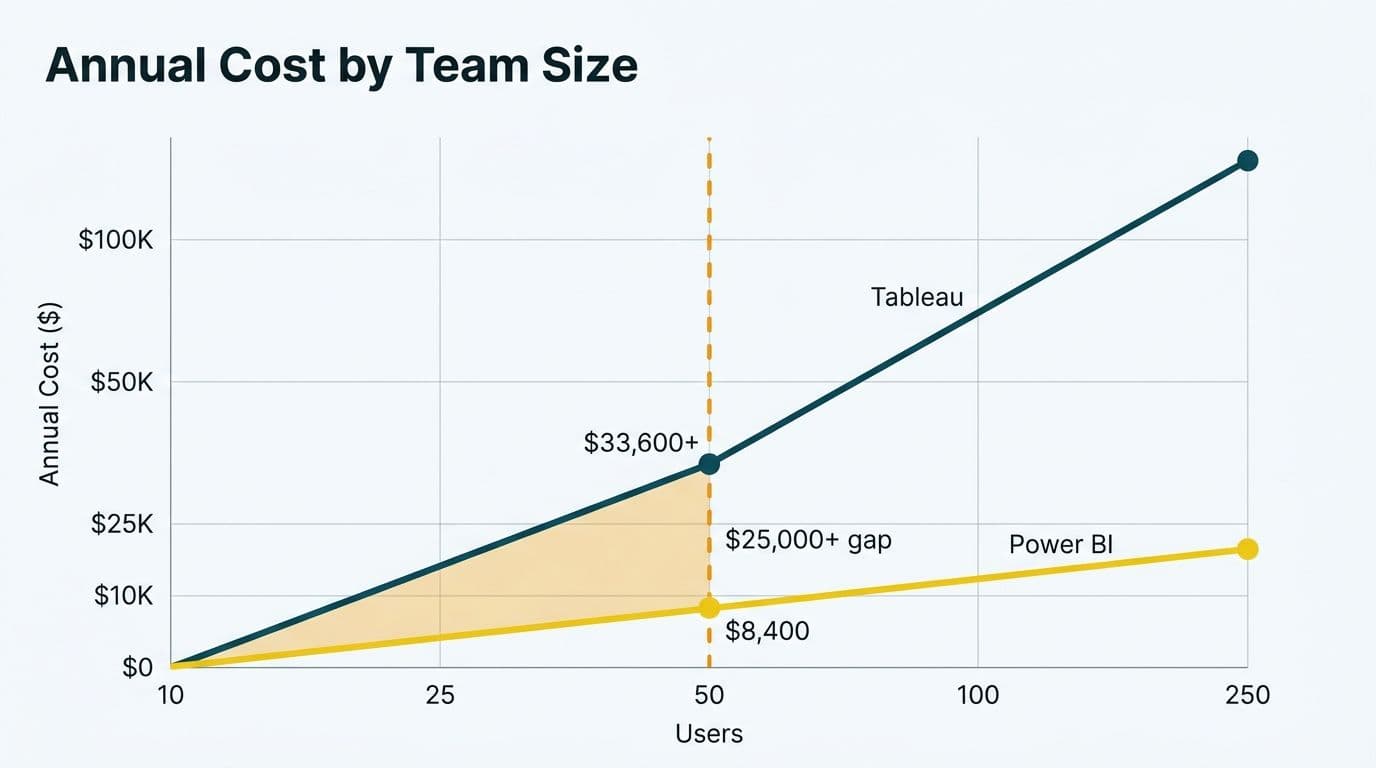
The break-even question has two distinct layers. First: does your organisation already pay for M365 E3 or E5? If yes, Power BI Pro is already in your contract and the BI license is a sunk cost. Second: does Power BI's capability set meet your requirements, or do Tableau's deeper visualisation controls or Salesforce CRM integration justify the ongoing premium?
Licensing break-even by user count (Power BI standalone vs Tableau Explorer mid-tier, annual):
- 10 users: Power BI Pro standalone saves $3,984/year versus Tableau Explorer-only - a 3.3x licensing advantage.
- 50 users: the annual saving is $19,920 on licensing alone.
- 200 users: Power BI Pro saves $79,680/year versus Tableau Explorer; if Premium Per Capacity ($59,940/year) is required at this scale for capacity-based workloads, the net advantage narrows to approximately $20,000 but remains material.
- 500 users: Power BI Pro standalone ($60,000) versus a full Tableau blended deployment ($259,200) shows a $199,200 annual licensing gap. Adding Fabric or Premium capacity still leaves Power BI significantly ahead on per-seat economics.
The M365 bundling benefit activates at the first user if you are already an M365 E3 or E5 subscriber - there is no minimum seat threshold. For organisations not yet committed to M365, the bundling argument requires evaluating the full productivity suite cost alongside the BI license, which extends the analysis beyond a BI-only procurement decision.
Teams evaluating Power BI Copilot as an additional AI layer on top of this base TCO should note it requires either Premium Per User (PPU) or a Microsoft Fabric capacity SKU, adding a separate licensing tier to the model above. For enterprise data platform decisions that include semantic-layer governance - particularly those comparing Microsoft Fabric vs Looker as the enterprise data platform backbone - Fabric's compute-unit pricing model should be modelled explicitly at your projected query volume before committing.
What Are the Hidden Costs of Connectors, Training, and Support?
Connector and Data Pipeline Costs
Both platforms support standard connectors to SQL Server, Snowflake, BigQuery, and Salesforce without add-on fees in their base tiers. Cost escalates at the governance and enterprise-integration edges of each platform.
Tableau's Data Management Add-on is required for Tableau Catalog, lineage tracking, and governed data source certification at enterprise scale - a cost that does not appear in the base per-seat headline price. Power BI's on-premises data gateway is free, but enterprise-grade Fabric data pipelines consume capacity units beyond the base Power BI Premium SKU. Third-party ETL and transformation tools - cloud-native pipeline services or transformation layers - are vendor-agnostic costs that often exceed the BI license itself for data-intensive organisations running dozens of source integrations.
A practical illustration of where connector spend goes wrong: one events production company maintained two Tableau dashboards that consistently showed different revenue totals, creating a dispute between finance and operations that ran for months. Investigation found the grand totals matched exactly - the only real difference was 34 filler rows pulled from slightly different date windows. The cost was not in the connector configuration or the license tier. It was in an unresolved data contract between two source tables. No add-on purchase would have resolved it; clear data governance and a canonical source-of-truth definition would have.
Training Ramp Time by Role
| Role | Power BI Ramp | Tableau Ramp | Key Difference |
|---|---|---|---|
| Analyst (SQL background) | 20-30 hrs | 25-40 hrs | Power BI DAX steeper curve; Tableau drag-drop quicker for exploration |
| Developer (IT/engineering) | 40-60 hrs | 50-70 hrs | Power BI XMLA and Fabric APIs add an enterprise integration layer |
| Report consumer / viewer | 4-8 hrs | 6-10 hrs | Both platforms have modern, low-friction consumption UIs |
| Admin (governance, security) | 30-50 hrs | 40-60 hrs | Power BI RLS simpler at small scale; Tableau more granular at enterprise |
Analysts with strong Excel and SQL backgrounds generally ramp on Power BI faster because DAX mirrors Excel function logic and Power Query is embedded in the same workspace. Tableau's training advantage sits with non-technical business users who need to build exploratory visualisations quickly without writing calculation syntax. The right platform depends on who builds dashboards most often - IT teams or the business itself.
If your team is migrating from Tableau, the Power BI skills map for Tableau users covers exact capability translations, including equivalent calculated field syntax and publishing workflow differences that affect your ramp timeline estimate.
Support Model Costs
- Self-serve (community documentation): free on both platforms; viable for small, technically capable teams with senior Power BI or Tableau developers in-house.
- Microsoft Unified Support: tiered annual contract; required for SLA-backed incident response on Power BI service outages and tenant-level support cases.
- Salesforce Premier Success Plans: typically 20-30% of net Tableau contract value per year; includes named technical account management and priority case routing for critical dashboard failures.
- Third-party managed service: offloads platform administration, monitoring, and model optimisation to a specialist provider; often more cost-effective than an internal BI FTE for teams under 200 seats. Managed Power BI services offer a structured alternative to in-house staffing at predictable monthly cost.
How Do Power BI and Tableau Handle Compliance Costs in Regulated Industries?
Financial reporting in regulated environments adds a compliance configuration cost layer that vendor-provided TCO calculators routinely omit. These differences are material and procurement-relevant across all three major geographic markets.
US healthcare and financial services teams subject to HIPAA or SOC 2 can deploy Power BI within Azure's HIPAA-eligible services boundary, where Microsoft will sign a Business Associate Agreement as part of an enterprise cloud contract (Microsoft Trust Center, 2026). HIPAA compliance still demands customer-side configuration: enabling audit logging in the Power BI admin portal, applying Microsoft Purview sensitivity labels to datasets containing protected health information, restricting export to approved formats only, and enforcing Row Level Security so only authorised roles access patient-level data. For Power BI vs Looker vs Tableau compliance architecture in regulated healthcare settings, the HIPAA-compliant BI tools guide covers BAA procurement steps, audit log configuration, and Private Link setup for all three platforms.
UK fintech firms and EU organisations subject to GDPR face data residency requirements for personal data in financial reports. Power BI ties data residency to Azure region selection at the tenant level - a single configuration decision with broad downstream effect. Tableau requires Data Management policy settings at the site level and a careful review of Salesforce's sub-processor list against the organisation's Data Processing Agreement obligations. For a structured audit framework covering both platforms, the GDPR-compliant financial reporting BI checklist provides field-level guidance applicable to UK and EU deployments, including data subject request handling and retention policy configuration.
Canadian organisations subject to PIPEDA and Quebec's Law 25 need documented cross-border data flow controls before processing personal data in a cloud BI platform. Both Power BI and Tableau support Canadian data residency - Azure Canada East for Power BI and Salesforce's Canadian infrastructure for Tableau. PIPEDA compliance documentation requirements favour whichever platform your legal team can audit more readily. Power BI's activity log and Microsoft Purview sensitivity label framework is generally more legible for compliance teams already operating in the Microsoft ecosystem, because the audit evidence sits within the same toolchain as identity and access management.
When the comparison expands to a three-platform view - Power BI vs Looker vs Tableau for enterprise financial reporting in regulated industries - Looker's semantic-layer approach centralises governance controls in a single LookML model, which some compliance auditors find easier to evidence than Power BI's distributed PBIX model pattern or Tableau's workbook-level permissions structure. Microsoft Fabric, the next-generation enterprise data platform into which Power BI is converging, adds unified governance through Microsoft Purview that competes directly with Looker's semantic-layer governance proposition at enterprise scale. Teams evaluating a migration from Looker to Power BI should include Purview licensing, data governance reconfiguration, and LookML-to-DAX translation effort as explicit TCO line items in the transition plan rather than treating them as implementation overhead.
When Does Tableau Deliver Better TCO Than Power BI?
Tableau earns its licensing premium in three specific scenarios, even after accounting for the substantial cost differential at list price:
1. Salesforce CRM is your primary data source. Tableau's native Salesforce integration and Tableau CRM capabilities deliver real-time pipeline analytics and CRM-embedded reporting that Power BI's Salesforce connector approaches but does not fully replicate. For sales organisations where the BI platform must live inside the Salesforce experience, Tableau's integration depth reduces custom development cost that would otherwise offset the licensing gap.
2. Non-technical business users build the majority of dashboards without IT support. Tableau's drag-and-drop interface significantly reduces the training burden for analysts who need exploratory visualisation flexibility. A US SaaS company with a 15-person marketing analytics team of mixed technical ability, for example, may find Tableau's time-to-first-dashboard advantage reduces the implementation and ongoing support cost enough to close the licensing gap.
3. No Microsoft 365 commitment exists and cross-cloud portability is a requirement. For a Canadian manufacturing company running workloads across AWS and GCP with no current M365 contract, full Tableau list pricing applies - but so does cloud-agnostic deployment flexibility. Power BI's architecture is tightly coupled to Azure; avoiding that dependency has a real strategic value for multi-cloud procurement strategies, even if it carries a higher short-term license cost.
Where Tableau loses the cost argument cleanly: any organisation with existing M365 E3 or E5 licensing, deep Microsoft ecosystem dependencies (Azure Data Factory, Dynamics 365, Teams integration), and primarily financial and operational reporting needs. Under those conditions, Power BI Pro at zero incremental licensing cost is difficult to justify displacing on a cost basis alone - the decision becomes a pure capability and ecosystem-fit question.
---
About Lets Viz: Lets Viz has delivered BI platform strategy and analytics implementation since 2020, working with clients across US healthcare, UK fintech, Canadian manufacturing, and global SaaS organisations. The practice holds a 5.0 Clutch rating and specialises in Power BI, Tableau, Fabric, and Looker deployments for regulated industries where cost governance, compliance configuration, and auditable data trails are first-class requirements - not afterthoughts.
Use the Instant project cost calculator to run your own line-item TCO model - enter your user count, current M365 licensing position, and preferred support model to see the Power BI vs Tableau cost gap specific to your organisation before finalising your vendor shortlist.